RESEARCH ARTICLE
A lipidomic approach to the study
of human CD4
+
T lymphocytes in multiple
sclerosis
Daniele Vergara
1,2, Michele D’Alessandro
3, Antonia Rizzello
1,2, Lidia De Riccardis
1, Paola Lunetti
1,
Piero Del Boccio
3, Francesca De Robertis
4, Giorgio Trianni
4, Michele Maffia
1,2*†and Anna M Giudetti
1*†Abstract
Background: Lipids play different important roles in central nervous system so that dysregulation of lipid pathways has been implicated in a growing number of neurodegenerative disorders including multiple sclerosis (MS). MS is the most prevalent autoimmune disorder of the central nervous system, with neurological symptoms caused by inflam-mation and demyelination. In this study, a lipidomic analysis was performed for the rapid profile of CD4+ T
lympho-cytes from MS patient and control samples in an untargeted approach.
Methods: A matrix-assisted laser desorption/ionization-time of flight (MALDI-TOF) mass spectrometry based approach was used for the analysis of lipid extracts using 9-aminoacridine as matrix. Lipids were analyzed in negative mode and selected species fragmented using MALDI tandem mass spectrometry for their structural assignments. Results: The analysis reveals some modifications in the phospholipid pattern of MS CD4+ T lymphocytes with
respect to healthy controls with a significant increase of cardiolipin species in MS samples.
Conclusions: These results demonstrate the feasibility of a MALDI-TOF approach for the analysis of CD4+ lipid
extracts and suggest how alterations in the lipid metabolism characterized lymphocytes of MS patients. Keywords: Cardiolipin, CD4+ T lymphocyte, Lipidomics, MALDI-TOF, Multiple sclerosis, 9-aminoacridine
© 2015 Vergara et al. This article is distributed under the terms of the Creative Commons Attribution 4.0 International License (http://creativecommons.org/licenses/by/4.0/), which permits unrestricted use, distribution, and reproduction in any medium, provided you give appropriate credit to the original author(s) and the source, provide a link to the Creative Commons license, and indicate if changes were made. The Creative Commons Public Domain Dedication waiver (http://creativecommons.org/ publicdomain/zero/1.0/) applies to the data made available in this article, unless otherwise stated.
Background
Multiple sclerosis (MS) is a demyelinating inflammatory disease of the central nervous system (CNS) with hetero-geneous clinical outcomes [1]. The causes of MS are not well understood but there is compelling evidence that a combination of factors such as environment, viruses and dietary conditions, in conjunction with genetic suscepti-bility might drive an autoimmune response against struc-ture of CNS. Autoimmune mechanisms of CNS damage are primarily mediated by auto-reactive CD4+ T cells,
which are specific for encephalitogenic epitopes of mye-lin peptides [2].
Migration of autoimmune T cells from the periphery into CNS parenchyma leads to inflammation, demyeli-zation and damage of axons, oligodendrocytes and neu-rons [1]. This autoimmune T cell mediated tissue damage results in an impairment of motor function leading to paralysis. Disease is progressive and often takes a relaps-ing-remitting course. Progression and severity of the disease as well as types of CNS lesions are highly hetero-geneous among patients with MS [2].
T lymphocytes play a central role in the pathogenesis of MS [2] and many successfully therapies in MS have been used T cell target approaches [3]. T cells are found in all four of the described histopathologic subtypes of MS [4]. Both CD4+ T and CD8+ T cells have been demonstrated
in MS lesions, with CD4+ T cells predominating in acute
lesions and CD8+ T cells being observed more frequently in
chronic lesions [4]. It has been reported that CD4+ T
lym-phocytes MHC class II-restricted, mainly polarized as Th1
Open Access
*Correspondence: [email protected]; [email protected]
†Michele Maffia and Anna M Giudetti are joint senior authors 1 Department of Biological and Environmental Sciences
and Technologies, University of Salento, via Monteroni, Lecce, Italy Full list of author information is available at the end of the article
cells induced CNS inflammation by producing inflamma-tory cytokines such as IFN-γ, IL-2, TNF-α and lymphotoxin [5]. Activated myelin-reactive CD4+ T cells are present in
the blood and cerebrospinal fluid of MS patients [4]. A main feature of MS is the change in the trafficking prop-erties of immune cells throughout the blood–brain barrier [6]. CD4+ cells, positive for PSGL-1 surface antigen, were
found to transmigrate throughout the blood–brain barrier to levels significantly higher than the equivalent popula-tion isolated from healthy subjects [7]. Moreover, inhibiting leukocyte adhesion to blood–brain barrier by antibodies against α4-integrin reduced the number of lesion in CNS of MS patients [8]. Regardless of the complexities associ-ated with MS pathogenesis, the infiltration of immune cells and their activities likely contribute to the loss of myelin and axonal degradation that accompanies progression of the dis-ease. Therefore, it is critical to understand the mechanisms involved in the transmigration of leukocytes into regions of the CNS where they are normally excluded.
Membrane lipid composition plays an important role in the dynamic of cells. In particular, changes in mem-brane lipid composition that alter memmem-brane fluidity may induce modifications in the functions of proteins and receptors involved in signaling pathways. Immune cell membrane lipids are involved in many functions and fatty acid abnormalities have been reported in immune cells from patients with MS [9]. Studies have provided that a specific lipid modification by peroxidative mecha-nisms could be a significant pathogenic factor in MS [10]. Moreover changes in lipid composition of cerebral fluid and plasma, in MS, have been demonstrated [11].
Recently, developments in lipid mass spectrometry provided the ability to describe changes in lipid com-positions that occur with disease progression or after a specific treatment, giving also the opportunity to identify lipid biomarkers and clarify cellular metabolism of indi-vidual lipid species [12].
In the present study, we applied a mass spectrometry-based lipidomics profiling to identify molecular lipid species associated with MS. To perform this, the lipid composition of human CD4+ T cells isolated from a
cohort of MS patients and normal subjects was screened by Matrix-Assisted Laser Desorption Ionization Time-of-Flight/Time-of-Flight (MALDI-TOF/TOF) analysis. Multivariate statistical analysis revealed that significant differences of specific lipid species characterize MS patients compared with normal subjects.
Methods
Ethical permission
The study was approved by the Vito Fazzi Hospital Eth-ics Committee (ASL_LE-General Manager Resolution n 228, February 11, 2014). Informed consent was obtained
from each patient prior to entry into the study, according to the declaration of Helsinki.
Participants/study population
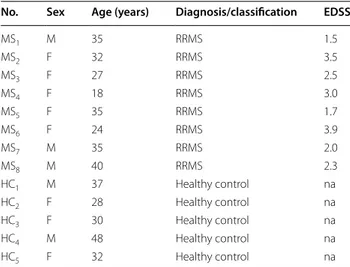
Height consenting patients suffering from defined relaps-ing-remitting type of MS (RR-MS) with an age range of 18–40 years, were clinically diagnosed at the Vito Fazzi Hospital in Lecce, and included into the study. Patients had a definite diagnosis of MS, as defined by the revised McDonald Criteria [13], and were classified as having relapsing remitting MS (RRMS) according to the Lublin-Rheingold classification [14]. For the evaluation of dis-ease severity the Expanded Disability Status Scale (EDSS) was used [15]. The characteristics of both MS and healthy donors are reported in the Table 1. None of the patients was on treatment with interferon, steroids or other immunosuppressive drugs for at least 3 months prior to entering the study. For each patient, blood samples were obtained at baseline; samples were also collected from a number of 5 healthy controls with an age range of 28–48 years and used for the following analysis.
Chemicals
Solvents were reagent grade and purchased from Baker. 9-aminoacridine (9-AA) matrix and cardiolipin stand-ard (from bovine heart) were purchased from Sigma. Ficoll-Paque PLUS was GE healthcare life sciences. CD4+
T Cell Isolation Kit was from Miltenyi Biotec (Bergisch Gladbach, Germany).
Cell isolation
Venous blood from consenting participants was collected into anti-coagulant EDTA tubes (Beckman Coulter,
Table 1 Clinical characteristics for the multiple sclerosis (MS) and healthy control (HC) groups
RRMS relapsing remitting MS, EDSS Expanded Disability Status Scale, na not
applicable.
No. Sex Age (years) Diagnosis/classification EDSS
MS1 M 35 RRMS 1.5 MS2 F 32 RRMS 3.5 MS3 F 27 RRMS 2.5 MS4 F 18 RRMS 3.0 MS5 F 35 RRMS 1.7 MS6 F 24 RRMS 3.9 MS7 M 35 RRMS 2.0 MS8 M 40 RRMS 2.3 HC1 M 37 Healthy control na HC2 F 28 Healthy control na HC3 F 30 Healthy control na HC4 M 48 Healthy control na HC5 F 32 Healthy control na
South Africa). Plasma samples were obtained from patients with MS and from healthy controls (HC). PBMC fractions were isolated from whole blood using Ficoll-Paque density-gradient centrifugation as described [16]. CD4+ T cells were purified by negative selection using an
indirect magnetic cell sorting kit.
Lipid extraction from CD4+ T lymphocytes
The extraction of lipids from CD4+ T lymphocytes was
performed using the method of Bligh and Dyer [17]. Briefly, to 20 μl (about 30 μg of protein) of cell suspen-sion was added a solution of chloroform/methanol (1:2, v/v) and, after vigorous stirring, the final mixture was kept at 4°C and then centrifuged at 19,800×g for 5 min. To the supernatant obtained after centrifugation was added chloroform and a 5% (w/v) solution of NaCl. The mixture was stirred and placed at 4 °C for a time suffi-cient to obtain the formation of two phases, the lower phase (chloroform) containing lipids and the upper aque-ous phase (water and methanol). The chloroform phase was then collected, filtered through nylon filters, brought to dryness under a stream of nitrogen and then resus-pended in an appropriate volume of chloroform for the subsequent analyses.
Fatty acid analysis
Fatty acid composition of CD4+ T cells was determined
processing the samples as in [18]. Briefly, 20 μl of cell suspension (about 30 μg protein) was subjected to saponification for 90 min at 85–90°C using an alcoholic solution of KOH. After acidification of the mixture, the fatty acids were extracted with petroleum ether. The methyl esters of fatty acids (FAME) were prepared by heating the extract at 65°C for 30 min with a solution of boron trifluoride in methanol (17% BF3) and then ana-lyzed by gas-chromatography. The helium carrier gas was used at a flow rate of 1 ml min−1. FAME were
sepa-rated on a 30 m × 0.32 mm HP5 (Hewlett Packard) capil-lary column. The injector and detector temperature was maintained at 250°C. The column was operated isother-mally at 150°C for 4 min, and then programmed to 250°C at 4°C/min. Peak identification was performed by using known standards and relative quantitation was automati-cally carried out by peak integration.
MALDI‑TOF/TOF analysis
Lipids mass spectra were acquired in positive and nega-tive ion reflector mode (detection range: 500–2,000 mass/charge, m/z), using a Bruker Daltonics Ultraflex Extreme MALDI-TOF/TOF mass spectrometer. Sam-ples were analyzed using 9-aminoacridine (9-AA) as a MALDI matrix. Matrix solution was prepared by dis-solving 10 mg 9-AA in 2-propanol:acetonitrile (60:40
v/v) (10 mg/mL) as reported [19]. Lipids, dissolved in the same matrix solvent, were mixed 1:1 with matrix and spotted on a MTP AnchorChip 384 target plate for mass analysis. Samples were allowed to air dry before inser-tion into the MALDI-TOF analyzer. Before each data acquisition, an external calibration was conducted using the peptide standard calibration kit mixture (Bruker Dal-tonics). For MALDI-MS and MS/MS analysis, ions from 2000 consecutive laser shots were collected under reflec-tron mode and summed into one spectrum. The col-lected spectra were then processed with FlexAnalysis 3.4 (Bruker Daltonics). A specific lipid database (Lipid Maps Database, http://www.lipidmaps.org) was used to facili-tate and confirm the assignment of phospholipid species.
Statistical analysis
The data matrix was exported for partial least squares discriminant analysis (PLS-DA) using Simca-P+ 11.0 software (Umetrics AB, Umeå, Sweden). Raw data were prepared to PLS-DA analysis through unit variance scaling (UV-scaling) and mean centering as default pre-processing operations. To searching for the variables that have the greatest influence in class discrimination we used the Variable Importance Analysis in SIMCA-P+. The software indicates that terms with large Vari-able Importance in the Projection (VIP) value, larger than 1, are the most relevant for group’s discrimination. The major discriminant variables were selected and the possibly outlier values were searched by the online tool: outlier calculator (GraphPad Software) that per-forms Grubbs’ test and setting a significance level of 95% (alpha equal to 0.05). Subsequently, D’Agostino and Pearson omnibus normality test was performed in order to determine the normality of each variable measured in each group. When normality was accepted the Student’s t-test was employed, otherwise the Mann–Whitney U-test was used for comparing the groups. GraphPad Prism was used to perform all these univariate analyses (GraphPad software, Inc. USA). Finally, the differential significant variables were identified using Lipidmaps Database.
Results
MALDI‑TOF analysis and identification of lipids
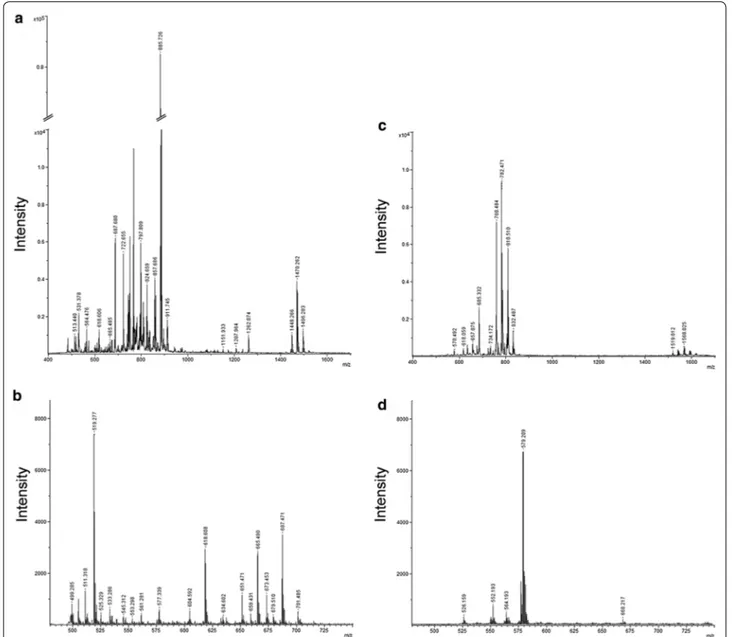
Figure 1 shows the representative mass spectrum of total lipid extracts prepared from CD4+ T lymphocytes using
9-AA as matrix. Lipids are charged molecules and due to presence of different charged groups, mass spectrom-etry analysis of these molecules can be performed in both positive and negative ion mode. However, the process of ionization is not only dependent on lipid charge but also influenced by different factors including the matrix used for MALDI analysis [20, 21]. For this reason, lipids
extracts were analyzed in both negative and positive mode and results are shown in Figure 1a, b, respectively.
In the lower panel (Figure 1c, d) peaks corresponding to 9-AA alone, in positive and negative mode, are also showed. Their identification allowed excluding matrix peaks from the analysis of our lipid samples.
Although the number of matrix peaks detected was higher for 9-AA observed in negative mode, this ioni-zation was found to be more efficient for the analysis of CD4+ lipids. In fact, if we compare the intensity of signals
of the two spectra reported in Figure 1a, b, ionization in
negative mode provided higher quality spectrum com-pared to the positive one. The signal intensity and the number of peaks detected were both higher. These results correlate with previous studies reporting an increase in signal intensity in negative ion mode when using 9-AA matrix [20].
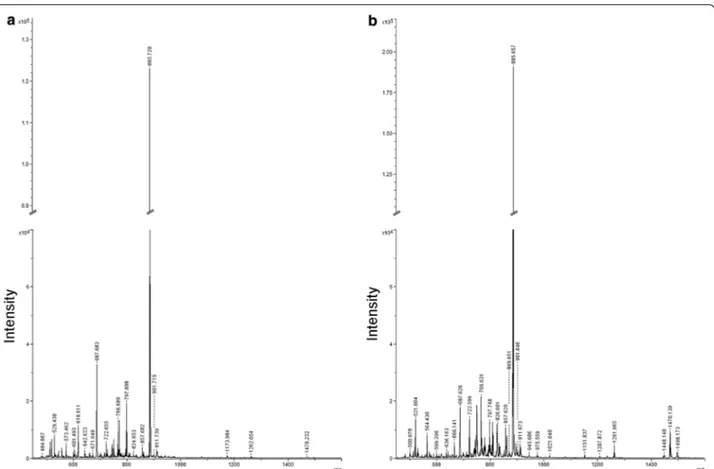
These observations demonstrated that better results were obtained using 9-AA in negative mode, and these experimental conditions were preferred for the analy-sis of our samples. In Figure 2, spectra from healthy (Figure 2a) and MS (Figure 2b) subjects obtained with
Figure 1 MALDI-TOF mass spectra of lipids from CD4+ T lymphocytes obtained in positive and negative mode. Representative MALDI-TOF mass
spectra of lipids extracted from CD4+ T lymphocytes (upper panels) prepared by the Bligh and Dyer procedure. Spectra were acquired in both
negative (a) and positive (b) mode, using the 9-AA matrix by averaging 2.000 consecutive laser shots. MALDI-TOF spectra of 9-AA matrix detected in negative (c) and positive mode (d) is reported. Spectra were acquired using a Ultraflex Extreme MALDI-TOF/TOF (Bruker).
9-AA in negative mode are reported. As showed, overall lipid pattern appears very similar, dominated by signals in the range of 600–1,500 m/z compatible with phospho-lipid species [21] as also identified by post-spectral pro-cessing (Table 2).
Multivariate analysis of lipid species
The signals of the MALDI spectra were exported in a final matrix in a compatible format for the multivariate analysis with Simca-P+ software. In this matrix all mol-ecules were reported as variables identified by its own m/z value related to each observation (patient). To obtain the maximum separation between the two clinical groups, all variables were processed by Partial Last Squares Dis-criminant Analysis (PLS-DA). Figure 3a shows the PLS-DA score plot of the first two principal components. The graph highlights the separation tendency between the MS (in red) and healthy (in black) groups based on their lipid profile. One MS sample (MS1) was dispersed among
con-trol subjects probably due to its low EDSS score (Table 1). Interpreting a PLS-DA model with a lot of components and a multitude of response factors can be a complex
task. In this model the most influential molecules respon-sible for the separation between classes are variables that have the greatest influence in PLS-DA. Simca-P+ soft-ware generates a list of all metabolite analyzed, sorted by a score number named VIP. The VIP score reflects the variable’s contribution on the classification, and so can be used to discover the most relevant differential metabolites for the group separation. Lipid molecules with a VIP score greater than 1 were taken in consid-eration to evaluate their significance in the univariate statistical analysis by comparing the relative intensity of each lipid molecules through a t-test or Mann–Whitney test between the two clinical groups in order to confirm their ability to discriminate MS patients from healthy controls. Four metabolites showed a significant p-value (p-value <0.05) between MS patients and healthy con-trols: m/z 861,640 that, on the basis of our assignment (Table 2), corresponded to two possible molecular spe-cies namely phosphatidylglycerol or phosphatidylinositol (respectively PG 42:0 or PI 36:2); m/z 911,618 identified as phosphatidylinositol (PI 40:6); m/z 1,448,140 and m/z 1,472,170 identified as cardiolipins (respectively as CL
Figure 2 MALDI-TOF mass spectra of CD4+ lipids from MS and control subjects obtained in negative mode. Representative negative ion
MALDI-TOF spectrum of total lipid extracts from healthy controls (a) and multiple sclerosis patients (b) CD4+ T lymphocytes, using the 9-AA matrix by
72:8 and CL 74:10). Due to the presence of various iso-mers, some identified molecular species were classified only on the basis of their class, the total number of the carbons in lateral chains and the total number of dou-ble bonds (unsaturation). These results are summarized in the Table 3 while the histogram in the Figure 3 shows the intensity of each differential expressed metabolite between the two clinical groups.
MS/MS spectra of cardiolipin
To confirm the identities of cardiolipin species, samples spectra were compared to those of a cardiolipin stand-ard. As reported in the Figure 4, mass spectra of sample in the range of cardiolipin species (Figure 4a) were almost
overlapping with those of the standard (Figure 4b). In addition, the MS/MS spectra of the ion m/z 1.448,140, was selected for fragmentation to further support the pro-posed assignment of cardiolipin. According to [22] the MS/MS spectra of cardiolipin [M-H]− (Figure 4c)
gener-ated the following ions: two fragments at m/z 78,911 and 96,971 corresponding to phosphate and dihydrogen phos-phate ions respectively; the peak at m/z 153,117 which corresponds to the neutral loss of glycerol-3-phosphate; the peak at m/z 279,496 identified as linoleic acid (C18:2), the m/z 415,515 assigned to the lyso-form of phosphatidic acid and the m/z 695,750 that corresponds to the phos-phatidic acid with 18:2/18:2 fatty acyl groups.
Fatty acid profile of CD4+ T cells by gas‑chromatographic
analysis
As a complement to MALDI-TOF analysis of phospho-lipids, we decided to perform a gas-chromatographic fatty acid comparative profiling of CD4+ T cells from
MS patients and healthy subjects. Phospholipids consist of fatty acids and a significant correlation between the fatty acid composition of lymphocytes and the capacity of these cells to produce eicosanoids involved in immu-noregulation has been established [23]. However, very lit-tle is known about the fatty acid composition of CD4+ T
cells from MS patients.
As shown in Table 4, the total amount of saturated fatty acids was decreased in MS with respect to control subjects whereas both monounsaturated and polyunsat-urated fatty acids were increased in MS. Among polyun-saturated fatty acids those of n-6 series were responsible for the augmented value. These findings well correlate with data obtained by MALDI-TOF demonstrating that MS-induced lipid compositional changes occur at the molecular-specie level.
Discussion
There is growing evidence that MALDI-TOF is an excel-lent analytical technique for a rapid screening of lipids in biological matrices due to its high sensitivity and rapid sample preparation [20, 24]. Thus, by using this approach, individual molecular species including low-abundance phospholipid classes could be easily analyzed even in total lipid extracts [20] and directly on tissue slices without any prior step of extraction [12]. Despite all these potentialities, some limitations exist. Due to their compositional complexity, the identification of individual species at high-resolution appear to be fundamental for the unambiguous mass assignment of lipids in complex samples [25]. For this reason, high-resolution mass spec-trometers have become the preferred approach for the identification and quantification of total lipid extracts in top-down lipidomic experiments [25].
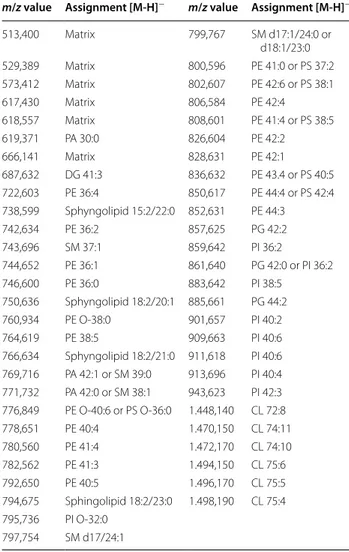
Table 2 Assignment based on m/z measurements of peaks detected in the negative ion mass spectra of lipids from CD4+ T lymphocytes using 9-AA as matrix
For the identification, mass tolerance was set to ±0.1.
CL cardiolipin, DG diacylglycerol, PA phosphatic acid, PE
phosphatidylethanolamine, PS phosphatidylserine, PI phosphatidylinositol, PG phosphatidylglycerol, SM sphingomyelin.
m/z value Assignment [M‑H]− m/z value Assignment [M‑H]−
513,400 Matrix 799,767 SM d17:1/24:0 or d18:1/23:0 529,389 Matrix 800,596 PE 41:0 or PS 37:2 573,412 Matrix 802,607 PE 42:6 or PS 38:1 617,430 Matrix 806,584 PE 42:4 618,557 Matrix 808,601 PE 41:4 or PS 38:5 619,371 PA 30:0 826,604 PE 42:2 666,141 Matrix 828,631 PE 42:1 687,632 DG 41:3 836,632 PE 43.4 or PS 40:5 722,603 PE 36:4 850,617 PE 44:4 or PS 42:4 738,599 Sphyngolipid 15:2/22:0 852,631 PE 44:3 742,634 PE 36:2 857,625 PG 42:2 743,696 SM 37:1 859,642 PI 36:2 744,652 PE 36:1 861,640 PG 42:0 or PI 36:2 746,600 PE 36:0 883,642 PI 38:5 750,636 Sphyngolipid 18:2/20:1 885,661 PG 44:2 760,934 PE O-38:0 901,657 PI 40:2 764,619 PE 38:5 909,663 PI 40:6 766,634 Sphyngolipid 18:2/21:0 911,618 PI 40:6 769,716 PA 42:1 or SM 39:0 913,696 PI 40:4 771,732 PA 42:0 or SM 38:1 943,623 PI 42:3 776,849 PE O-40:6 or PS O-36:0 1.448,140 CL 72:8 778,651 PE 40:4 1.470,150 CL 74:11 780,560 PE 41:4 1.472,170 CL 74:10 782,562 PE 41:3 1.494,150 CL 75:6 792,650 PE 40:5 1.496,170 CL 75:5 794,675 Sphingolipid 18:2/23:0 1.498,190 CL 75:4 795,736 PI O-32:0 797,754 SM d17/24:1
In this study, we reported a direct MALDI-TOF analy-sis of total lipid extracts from CD4+ T lymphocytes using
9-AA as a matrix in negative mode. Compared to positive ion spectra, negative spectra displayed a higher amount of signals allowing the identification of several lipid spe-cies mostly phospholipids (DG, PA, PG, PE, PS, PI, CL
and sphingomyelin). Moreover, the analysis of spectrum in the negative mode is facilitated by the exclusive pres-ence of deprotonated [M-H]− ion signals [26].
The interest in lipids and their analysis in the field of MS were already demonstrated by Del Boccio and col-leagues [27] that showed and altered lipid pattern in the serum of MS patients. Here, for the first time, a mass-spectrometry approach was applied for the characteriza-tion of lipids from CD4+ T lymphocytes.
Lipids play a critical role in the structure of the cen-tral and peripheral nervous systems in particular at the cell membrane level [28]. Alterations in the phospholipid as well as in plasma membrane fatty acid composition, modifying the membrane fluidity, can affect a wide range of cellular functions such as ligand-receptor signal trans-duction and membrane trafficking with consequences on cell functions and survival [29]. In red blood cells from
Figure 3 Partial least squares discriminat analysis. Partial least squares discriminat analysis (PLS-DA) score plot from lipidomics data derived from
control (black triangle) and MS (red circle) patients. Below, histograms show peaks that were significantly different (P < 0.05) among groups. Data reported as mean ± SD.
Table 3 Metabolites whcich allowed the separation between healthy and multiple sclerosis patients selected on the the basis of VIP
A P value <0.05 was set as the threshold to define significant differences.
m/z Regulation in MS P value Ion Lipid species
861,640 Up-regulated 0.037 [M-H]− PG 42:0 or PI 36:2
911,618 Up-regulated 0.042 [M-H]− PI 40:5
1.448,140 Up-regulated 0.042 [M-H]− CL 72:8
MS patients, alterations in the membrane fluidity closely correlated with inflammation and disease outcome [29]. Moreover, modifications in membrane fluidity have been reported in the central nervous system of patients with
motor neuron disease [28] as well as in the brain cortex and spinal cord of patients affected by amyotrophic lat-eral sclerosis [30]. Despite the importance of lympho-cytes in the context of MS, the lipid metabolism of these cells has received less attention. A large body of evidence indicate that CD4+ T cells play a role in MS pathogenesis
[4], as these cells have the ability to damage and cross the blood–brain barrier, inducing axonal damage and neu-ronal death [6]. Lymphocytes are then important players in the onset and evolution of the disease and the main target of the current immunological therapies including interferon β reagents, glatiramer acetate, natalizumab, rituximab and Copaxone. Understanding which biologi-cal and biochemibiologi-cal alterations characterize lymphocytes of MS patients may be important for the identification of new biomarkers of disease and for the development of future therapies.
Our analysis by MALDI-TOF of lipid extracted from CD4+ T cells highlights a characteristic phospholipid
pattern in MS and HC patients (Table 2). Through a mul-tivariate statistical analysis we found several discrimi-nant signals between the two groups (Figure 2). Among these, phospholipids in the range of 1,200–1,500 m/z were unambiguous identified as cardiolipins. How-ever since the small sample size the potentiality of these lipids, to serve as prospective biomarkers, should be further confirmed and validated in a targeted and more extensive clinical study. In mammalian cells, cardiolipin
Figure 4 MS/MS based characterization of the cardiolipin m/z
1,448,14 ion. Representative MS spectra of cardiolipin species obtained from a MS sample (a), and from cardiolipin standard (b). Following MS/MS of the 1,448,14 cardiolipin generated fragment ions were illustrated (c); cardiolipin structure is reported in the insert.
Table 4 Fatty acid composition of CD4+ T lymphocytes
Fatty acids were obtained from whole CD4+ T lymphocytes as reported in the
“Methods” section. Values are expressed as percentage of total fatty acids.
MUFA monounsaturated fatty acids, PUFA polyunsaturated fatty acids, SFA
saturated fatty acids, UI Unsaturation index. Values are given as mean ± SD.
* P < 0.05; ** P < 0.01; *** P < 0.001. Fatty acids HC MS 14:0 1.5 ± 0.6 1.9 ± 0.7 16:0 34.3 ± 1.2 31.8 ± 2.0 16:1 0.2 ± 0.08 0.3 ± 0.09 18:0 57.2 ± 1.2 54.2 ± 4.0 18:1n-9 3.1 ± 0.5 5.6 ± 1.7* 18:1n-11 0.7 ± 0.06 0.9 ± 0.08** 18:2n-6 1.4 ± 0.2 2.0 ± 0.7 18:3n-3 0.5 ± 0.03 0.3 ± 0.01** 20:4n-6 1.5 ± 0.1 4.4 ± 0.2** Σ SFA 92.9 ± 0.6 86.9 ± 4.3*** Σ MUFA 3.3 ± 0.2 5.8 ± 1.7*** Σ PUFA 3.3 ± 0.4 6.7 ± 0.9** Total n-6 2.8 ± 0.9 6.4 ± 0.3** SFA/PUFA 14.4 ± 1.7 7.9 ± 3.8*** UI 13.7 ± 3.2 29.1 ± 11.6***
is located almost exclusively in the inner mitochondrial membrane where it accounts for 10–20% of total mito-chondrial lipids. Cardiolipin is essential for the optimal function of numerous enzymes that are involved in the mitochondrial energy metabolism [31]. Moreover, cardi-olipin molecules could be also expressed on the surface of apoptotic cells and thus recognized by antiphospho-lipid antibodies [32]. Regarding this aspect, it has been reported that during mitochondrial stress or damage, the asymmetric cardiolipin distribution collapses resulting in its externalization to the outer mitochondrial membrane, leading to signalling events essential for mitophagy and apoptosis [33]. Interestingly, anti-cardiolipin antibodies were detected and measured in the plasma of some MS patients [34].
Several hypotheses can be considered to explain the alteration of cardiolipin observed by MALDI in MS patients. Mitochondrial dysfunction has been impli-cated in the development and progression of MS [35], so closely to propose mitochondrial-targeted approaches for the treatment of the disease [36]. In particular, Witte and collaborators [35] described how an enhanced density of mitochondria in MS lesions might contribute to the for-mation of free radicals and subsequent tissue damage. In light of our results, higher intensity of cardiolipin signal in MS patients may indicate a possible higher amount of mitochondria in these cells. The increase in the number of mitochondria may be also a strategy to prevent the decline of mitochondrial efficiency [37], as we recently observed for damaged mitochondria in cirrhotic rat liv-ers [38].
It is well known that in most mammalian tissues car-diolipin acyl composition is predominantly comprised of 18-carbon unsaturated acyl chains, the vast major-ity of which is linoleic acid (C18:2, n-6) [33]. In our study
an increased amount of cardiolipin rich in PUFA were described. PUFA are important molecules not only as structural constituent of plasma membrane, but also as mediators of inflammation. To this end, n-6 PUFA are substrates of cyclooxygenase (COX) and lipoxygenase (LOX) [39] enzymes which can convert PUFA in pro-inflammatory molecules such as prostaglandins (PG) of series 2 and leukotrinene (LT) of the series 4. An increased amount of PGE2 in the serum and
cerebrospi-nal fluid of patients affected by amyotrophic lateral scle-rosis was observed [40]. Moreover, LTC4, D4, E4, F4 are potent chemotactic agents contributing to neuroinflam-mation by enhancing vascular permeability [41]. Our gas-chromatographic analysis of CD4+ T cells revealed
an increase in PUFA of the n-6 series as well as in the unsaturation index (UI) in MS with respect to HC. These data well correlate with the results of MALDI-TOF.
Many studies have associated the progression of patho-logical conditions with changes in the fatty acyl moieties of cardiolipin [22]. Shifting of fatty acids in myocardial cardiolipin from saturated fatty acids to highly unsatu-rated species was linked to the onset of heart failure in spontaneous hypertensive rats [42]. Moreover, we should also consider that phospholipids with saturated fatty acid side chains have been indicated as natural anti-inflamma-tory class of compounds that ameliorated experimental autoimmune encephalomyelitis by suppressing activation and inducing apoptosis of autoreactive T cells [43]. Conclusion
Taken together, our data obtained by a lipidomic approach can suggest an altered mitochondrial lipid metabolism in CD4+ T cells from MS patients. The small
number of patients represents a weakness of this prelimi-nary study and may limit a rapid clinical application of our results. Further studies enrolling a larger cohort of patients are needed to confirm our finding and to propose a functional link about the possible role of mitochondria on the regulation of lymphocyte lipid metabolism in MS. In this context, the feasibility of MALDI-TOF/TOF in the rapid screening and characterization of lipid samples makes these results useful for potential scale-up to larger patient populations.
Authors’ contributions
AMG, AR and DV conceptualized and designed the study, analyzed the data, and wrote the manuscript. MD and PDB analyzed the spectrometric data. LDR and PL conceptualized and collected the data. FDR, GT and MM analyzed the clinical data. AMG and MM conceptualized the study from a biochemi-cal and physiologibiochemi-cal point of view. All authors read and approved the final manuscript.
Author details
1 Department of Biological and Environmental Sciences and Technologies,
University of Salento, via Monteroni, Lecce, Italy. 2 Laboratory of Clinical
Proteomic, “Giovanni Paolo II” Hospital, ASL-Lecce, Piazzetta F. Muratore, Lecce, Italy. 3 Department of Medical, Oral and Biotechnological Sciences, Research
Centre on Aging (Ce.S.I), “G. d’Annunzio” University Foundation, Chieti-Pescara, Italy. 4 Department of Neurology, “Vito Fazzi” Hospital, ASL-Lecce, Piazzetta F.
Muratore, Lecce, Italy. Acknowledgements
This work was supported by the following projects: i. PONa3_00334254/Ric “Implementation of Human and Environment Health Research Center”; ii. PON02_00563_34847 “RINOVATIS”; iii. PRIN 2010FPTBSH “NANO Molecular Technologies for Drug delivery-NANOMED” and by the pharmaceutical com-pany TEVA. We wish to thank also the ASL-Le for the financial support to the laboratory of clinical proteomics. MD and PDB were supported by the Italian Ministry of Health, Grant number: GR-2010-2307655. We thank Dr. Antonio Danieli, Dr. Elena Pitotti and Mrs. Caputo Sabina for their technical support. Compliance with ethical guidelines
Competing interests
Received: 31 January 2015 Accepted: 13 July 2015
References
1. Cottrell DA, Kremenchutzky M, Rice GP, Koopman WJ, Hader W, Baskerville J et al (1999) The natural history of multiple sclerosis: a geographically based study. 5. The clinical features and natural history of primary pro-gressive multiple sclerosis. Brain 122:625–639
2. Tse HY, Skundric DS, Cruikshank WW, Montgomery PC, Lisak RP (2013) Immunopathology of CD4+ T cell-mediated autoimmune responses to
central nervous system antigens: role of IL-16. J Immunol Clin Res. 1:1006 3. Zozulya AL, Wiendl H (2008) The role of regulatory T cells in multiple
sclerosis. Nat Clin Pract Neurol. 4:384–398
4. Chitnis T (2007) The role of CD4 T cells in the pathogenesis of multiple sclerosis. Int Rev Neurobiol 79:43–72
5. Lassmann H, Ransohoff RM (2004) The CD4-Th1 model for multiple sclerosis: a critical re-appraisal. Trends Immunol 25:132–137 6. Alvarez JI, Cayrol R, Prat A (2011) Disruption of central nervous system
barriers in multiple sclerosis. Biochim Biophys Acta 1812:252–264 7. Bahbouhi B, Berthelot L, Pettré S, Michel L, Wiertlewski S, Weksler B et al
(2009) Peripheral blood CD4+ T lymphocytes from multiple sclerosis
patients are characterized by higher PSGL-1 expression and transmigra-tion capacity across a human blood-brain barrier-derived endothelial cell line. J Leukoc Biol 86:1049–1063
8. Kawamoto E, Nakahashi S, Okamoto T, Imai H, Shimaoka M (2012) Anti-integrin therapy for multiple sclerosis. Autoimmune Dis. doi:10.1155/2012/357101
9. Hon GM, Hassan MS, van Rensburg SJ, Abel S, Erasmus RT, Matsha T (2012) Peripheral blood mononuclear cell membrane fluidity and disease outcome in patients with multiple sclerosis. Indian J Hematol Blood Transfus 28(1):1–6
10. Gonzalo H, Brieva L, Tatzber F, Jové M, Cacabelos D, Cassanyé A et al (2012) Lipidome analysis in multiple sclerosis reveals protein lipoxida-tive damage as a potential pathogenic mechanism. J Neurochem 123(4):622–634
11. Weinstock-Guttman B, Zivadinov R, Mahfooz N, Carl E, Drake A, Schneider J et al (2011) Serum lipid profiles are associated with dis-ability and MRI outcomes in multiple sclerosis. Neuroinflammation. doi:10.1186/1742-2094-8-127
12. Blanksby SJ, Mitchell TW (2010) Advances in mass spectrometry for lipidomics. Annu Rev Anal Chem (Palo Alto Calif ) 3:433–465 13. Polman CH, Reingold SC, Edan G, Filippi M, Hartung HP, Kappos L et al
(2005) Diagnostic criteria for multiple sclerosis: 2005 revisions to the “McDonald Criteria”. Ann Neurol 58:840–846
14. Lublin FD, Reingold SC (1996) Defining the clinical course of multiple sclerosis: results of an international survey–National Multiple Sclerosis Society (USA) Advisory Committee on Clinical Trials of New Agents in Multiple Sclerosis. Neurology 46:907–911
15. Kurtzke JF (1983) Rating neurologic impairment in multiple sclerosis: an Expanded Disability Status Scale (EDSS). Neurology 33:1444–1452 16. De Masi R, Vergara D, Pasca S, Acierno R, Greco M, Spagnolo L et al (2009)
PBMCs protein expression profile in relapsing IFN-treated multiple sclerosis: a pilot study on relation to clinical findings and brain atrophy. J Neuroimmunol 210(1–2):80–86
17. Bligh EG, Dyer WJ (1959) A rapid method of total lipid extraction and purification. Can J Med Sci 37:911–917
18. Bellanti F, Romano AD, Giudetti AM, Rollo T, Blonda M, Tamborra R et al (2013) Many faces of mitochondrial uncoupling during age: damage or defense? J Gerontol A Biol Sci Med Sci 68(8):892–902
19. Angelini R, Vitale R, Patil VA, Cocco T, Ludwig B, Greenberg ML et al (2012) Lipidomics of intact mitochondria by MALDI-TOF/MS[S]. J Lipid Res 53(7):1417–1425
20. Fuchs B, Süss R, Schiller J (2010) An update of MALDI-TOF mass spectrom-etry in lipid research. Prog Lipid Res 49(4):450–475
21. Al-Saad KA, Zabrouskov V, Siems WF, Knowles NR, Hannan RM, Hill HH Jr (2003) Matrix-assisted laser desorption/ionization time-of-flight mass spectrometry of lipids: ionization and prompt fragmentation patterns. Rapid Commun Mass Spectrom 17(1):87–96
22. Wang HY, Jackson SN, Woods AS (2007) Direct MALDI-MS analysis of cardiolipin from rat organs sections. J Am Soc Mass Spectrom 18:567–577 23. Calder PC, Yaqoob P, Thies F, Wallace FA, Miles EA (2002) Fatty acids and
lymphocyte functions. Br J Nutr 87(Suppl 1):S31–S48
24. Köfeler HC, Fauland A, Rechberger GN, Trötzmüller M (2012) Mass spectrometry based lipidomics: an overview of technological platforms. Metabolites 2:19–38
25. Schwudke D, Schuhmann K, Herzog R, Bornstein SR, Shevchenko A (2011) Shotgun lipidomics on high resolution mass spectrometers. Cold Spring Harb Perspect Biol 3(9):a004614
26. Cerruti CD, Benabdellah F, Laprévote O, Touboul D, Brunelle A (2012) MALDI imaging and structural analysis of rat brain lipid negative ions with 9-aminoacridine matrix. Anal Chem 84(5):2164–2171
27. Del Boccio P, Pieragostino D, Di Ioia M, Petrucci F, Lugaresi A, De Luca G et al (2011) Lipidomic investigations for the characterization of circulating serum lipids in multiple sclerosis. J Proteomics 74(12):2826–2836 28. Schmitt F, Hussain G, Dupuis L, Loeffler JP, Henriques A (2014) A plural
role for lipids in motor neuron diseases: energy, signaling and structure. Front Cell Neurosci. doi:10.3389/fncel.2014.00025
29. Hon GM, Hassan MS, van Rensburg SJ, Abel S, van Jaarsveld P, Erasmus RT et al (2009) Red blood cell membrane fluidity in the etiology of multiple sclerosis. J Membr Biol 232(1–3):25–34
30. Miana-Mena FJ, Piedrafita E, Gonzalez-Mingot C, Larrode P, Munoz MJ, Martinez-Ballarin E et al (2011) Levels of membrane fluidity in the spinal cord and the brain in an animal model of amyotrophic lateral sclerosis. J Bioenerg Biomembr 43:181–186
31. Chicco AJ, Sparagna GC (2007) Role of cardiolipin alterations in mito-chondrial dysfunction and disease. Am J Physiol Cell Physiol 292:C33–C44 32. Sorice M, Circella A, Misasi R, Pittoni V, Garofalo T, Cirelli A et al (2000)
Cardiolipin on the surface of apoptotic cells as a possible trigger for anti-phospholipid antibodies. Clin Exp Immunol 122(2):277–284
33. Amoscato AA, Sparvero LJ, He RR, Watkins S, Bayir H, Kagan VE (2014) Imaging mass spectrometry of diversified cardiolipin molecular species in the brain. Anal Chem 86(13):6587–6595
34. Karussis D, Leker RR, Ashkenazi A, Abramsky O (1998) A subgroup of mul-tiple sclerosis patients with anticardiolipin antibodies and unusual clinical manifestations: do they represent a new nosological entity? Ann Neurol 44(4):629–634
35. Witte ME, Bø L, Rodenburg RJ, Belien JA, Musters R, Hazes T et al (2009) Enhanced number and activity of mitochondria in multiple sclerosis lesions. J Pathol 219(2):193–204
36. Mao P, Reddy PH (2010) Is multiple sclerosis a mitochondrial disease? Biochim Biophys Acta 1802(1):66–79
37. Wredenberg A, Wibom R, Wilhelmsson H, Graff C, Wiener HH, Burden SJ et al (2002) Increased mitochondrial mass in mitochondrial myopathy mice. Proc Natl Acad Sci USA 99(23):15066–15071
38. Serviddio G, Bellanti F, Stanca E, Lunetti P, Blonda M, Tamborra R et al (2014) Silybin exerts antioxidant effects and induces mitochondrial bio-genesis in liver of rat with secondary biliary cirrhosis. Free Radic Biol Med 73:117–126
39. Giudetti AM, Cagnazzo R (2012) Beneficial effects of n-3 PUFA on chronic airway inflammatory diseases. Prostaglandins Other Lipid Mediat 99(3–4):57–67
40. Ilzecka J (2003) Prostaglandin E2 is increased in amyotrophic lateral sclerosis patients. Acta Neurol Scand 108:125–129
41. Pace-Asciak CR (1989) Mass spectra of prostaglandins and related prod-ucts. Adv Prostaglandin Thromboxane Leukot Res 18:1–565
42. Sparagna GC, Johnson CA, McCune SA, Moore RL, Murphy RC (2005) Quantitation of cardiolipin molecular species in spontaneously hyperten-sive heart failure rats using Electrospray Ionization Mass Spectrometry. J Lipid Res 46(6):1196–1204
43. Ho PP, Kanter JL, Johnson AM, Srinagesh HK, Chang EJ, Purdy TM et al (2012) Identification of naturally occurring fatty acids of the myelin sheath that resolve neuroinflammation. Sci Transl Med. doi:10.1126/ scitranslmed.3003831