Ilaria Palumbo
UNIVERSITÀ DEGLI STUDI DELLA TUSCIA DI VITERBO Dipartimento di Scienze dell'Ambiente Forestale e delle sue Risorse
The emissions of greenhouse gases from forest fires
in the Mediterranean Region
2007 Tesi di Dottorato
UNIVERSITÀ DEGLI STUDI DELLA TUSCIA DI VITERBO
Dipartimento di Scienze dell'Ambiente Forestale e delle sue Risorse
CORSO DI DOTTORATO DI RICERCA ECOLOGIA FORESTALE XIX CICLO
The emissions of greenhouse gases from forest fires in the Mediterranean Region AGR/05
Coordinatore: Prof. Paolo de Angelis Firma
Tutori: Prof. Riccardo Valentini e Dott. Paulo Barbosa Firma
Dottoranda: Ilaria Palumbo Firma
Table of Contents
Table of Contents...I Abstract...III Riassunto... V List of Figures ... VII List of Tables ...IX List of Acronyms ... X
Introduction...1
1. Context of research ...6
1.1. Biomass Burning in the Biosphere ...6
1.1.1. Effects of fire on ecosystems and atmosphere...6
1.1.2. The burning process...8
1.1.3. Current estimates of fire emissions...10
1.1.4. Fire in the Mediterranean Basin...12
1.2. Remote Sensing of forest fires ...17
1.2.1. Active fires...17
1.2.2. Fire Radiative Energy ...20
1.2.3. Burned areas...25 2. Datasets ...26 2.1. Case studies ...26 2.2. Field data ...34 2.3. SEVIRI Sensor ...37 2.4. Satellite Imagery...40 3. Methodology ...41
3.1. Fire Detection Algorithm ...41
3.2. Retrieval of Fire Radiative Energy...46
3.3. Burned biomass estimation...48
3.4. Emissions estimation ...50
4. Results ...51
4.1. Active fire maps ...51
4.2. Fire Radiative Power ...57
4.3. Results from the field campaign...62
4.3.1. Biomass estimation ...65
4.4. Comparisons of burned biomass estimates...67
4.5. Emissions estimation ...70 5. Conclusions ...73 Outlook ...76 Acknowledgements...77 Bibliography ...78
Abstract
Forest fires occur regularly in the Mediterranean Basin affecting several hundred thousands hectares every year. Most of fires, about 90% of the total, are human-induced.
A relevant effect of this burning activity is the emission of greenhouse gases which has been recognised as an important issue by the United Nations Framework Convention on Climate Change (UNFCCC) and the Kyoto Protocol. Although it is crucial to have reliable information about the fire emissions, current estimates are still affected by high uncertainties mostly due to the inaccuracy of the data used in the analysis.
The major contribution to the level of uncertainty is given by the information about the burned biomass. Therefore in this study a recent method for the estimation of the burned biomass is applied by using satellite remote sensing.
The original approach has been developed in the tropical region and is based on the radiant energy emitted during the burning of vegetation (Fire Radiative Power, FRP). It has been shown that the FRP is linearly related to the amount of burned biomass. This research activity provides for the first time provides an assessment of the FRP in the forest fires of a Mediterranean ecosystem. The original method is therefore implemented to become applicable in this specific environment. The analysis has been carried out on three case studies by using the satellite imagery from the SEVIRI (Spinning Enhanced Visible and Infra-Red Imager) geostationary sensor on board the Meteosat Second Generation platform.
A fire detection algorithm has been developed by applying a multispectral approach which uses the mid (3-5 µm) and thermal (10-12 µm) infrared bands. The identification of actve fires is essential for the application of the FRP method. The emitted energy is derived for each active fire during its whole duration so that the total radiant energy emitted is quantified (Fire Radiative Energy, FRE). The amount of burned biomass is estimated from the FRE by using the relation derived from previous studies carried out in the tropical area. It is assumed that the equation is also valid for the Mediterranean ecosystems since it is independent of the vegetation type. In addition to the satellite analysis the assessment has been integrated with field data collected from the study sites. The information from the field has been used to evaluate the accuracy of the estimates of burned biomass derived from the FRE.
The results showed the feasibility of using the SEVIRI sensor for fire monitoring despite its low spatial resolution. The comparison of the FRE estimates with those derived from the field showed good agreement. Differences vary between 36% and 3% indicating a lower uncertainty when compared to that of the current methods used
to estimate burned biomass. This result demonstrates that the FRP approach is applicable in the Mediterranean region and thus providing significant improvements in the estimates of fire emissions in its ecosystems.
The GHG emissions have been quantified by using the burned biomass estimates derived from the FRE and from the field data. Their amounts can influence substantially the effects of air pollution on human health at local scale and can also contribute to climate change on a broader scale.
Riassunto
Nel bacino del Mediterraneo centinaia di migliaia di ettari vengono bruciati ogni anno con cause diverse, ma nel 90% dei casi come conseguenza dell’azione dell’uomo. Tra gli effetti del fuoco le emissioni gassose rivestono un ruolo fondamentale come già riconosciuto dalla Convenzione sui Cambiamenti Climatici (UNFCCC) e dal Protocollo di Kyoto. Pertanto è diventato fondamentale poter quantificare in modo accurato le emissioni di gas serra rilasciate negli incendi boschivi. Tuttavia le attuali stime sulle emissioni presentano un’ampia incertezza dovuta principalmente alla scarsa accuratezza dei dati impiegati nell’analisi.
La variabile che apporta il maggior contributo di incertezza alle stime sulle emissioni è la biomassa vegetale bruciata. Pertanto in questo lavoro di ricerca si propone l’applicazione di un metodo di recente sviluppo per derivare le informazioni sulla biomassa bruciata utilizzando il telerilevamento satellitare.
Il metodo originale è stato sviluppato in ambiente tropicale e si basa sulla misura dell’energia radiante emessa durante l’incendio (Fire Radiative Power, FRP), poiché è stato dimostrato che questa energia è legata in modo lineare alla quantità di biomassa bruciata.
L’attività di ricerca qui presentata studia per la prima volta l’FRP in incendi boschivi dell’ecosistema mediterraneo e pertanto la metodologia originaria è stata implementata per renderla applicabile a questo specifico ambiente. L’analisi è stata svolta su tre casi studio utilizzando le immagini acquisite dal sensore geostazionario SEVIRI (Spinning Enhanced Visible and Infra-Red Imager) a bordo del satellite Meteosat Second Generation.
Prima di tutto è stato sviluppato un algoritmo per il riconoscimento degli incendi attivi utilizzando diverse bande spettrali tra cui l’infrarosso medio (3-5 µm) e termico (10-12 µm). L’identificazione degli incendi attivi è essenziale ai fini dell’applicazione della metodologia FRP. L’energia emessa è derivata su ciascun incendio attivo e per l’intera durata dell’incendio. In questo modo l’energia radiante emessa complessivamente (Fire Radiative Energy, FRE) viene determinata. La quantità di biomassa combusta viene stimata a partire dall’FRE utilizzando una relazione derivata da precedenti lavori svolti in area tropicale. L’equazione per la conversione dell’FRE in biomassa bruciata è considerata valida anche per la vegetazione mediterranea in quanto la relazione risulta essere indipendente dal tipo di vegetazione considerata. Oltre all’analisi satellitare sono anche state svolte delle campagne di misure a terra finalizzate alla raccolta di dati sulla biomassa bruciata nei casi studio analizzati. Questi dati sono stati impiegati per valutare l’accuratezza delle stime di biomassa bruciata derivate dall’FRE.
I risultati dello studio dimostrano la funzionalità del sensore SEVIRI ai fini del monitoraggio degli incendi boschivi, pur avendo una bassa risoluzione spaziale. Nel confronto tra le stime della biomassa bruciata derivata dall’energia emessa (FRE) con quelle ottenute dai rilievi di campo si osserva un buon accordo: le differenze variano tra il 36% ed il 3%. Tali differenze indicano un livello di incertezza di molto inferiore a quello che attualmente caratterizza le stime di biomassa bruciata e dimostrano come il metodo FRP sia applicabile all’ambiente mediterraneo e come questo approccio possa significativamente migliorare le attuali stime delle emissioni rilasciate dagli incendi boschivi.
Le emissioni di gas serra sono state quantificate a partire dai valori di biomassa bruciata derivati dall’FRE e dai dati di campo. Le quantità emesse risultano significative sia per gli effetti che hanno sull’inquinamento atmosferico, e quindi sulla salute delle persone, sia per il contributo che possono apportare ai cambiamenti climatici.
List of Figures
Figure 1.1. The impact of gaseous and aerosols emissions from vegetation fires on
atmosphere and climate...7
Figure 1.2. Phases of a fire...9
Figure 1.3. The Mediterranean Basin. ...13
Figure 1.4. Daily fire risk level estimated with the Fire Weather Index (FWI). ...15
Figure1.5. Burned area in five Member States (Portugal, Spain, France, Italy and Greece)...16
Figure 1.6. Number of fires in five Member States (Portugal, Spain, France, Italy and Greece)...16
Figure 1.7. Emitted energy distribution for a blackbody at different temperatures...18
Figure 2.1. Case studies location. ...27
Figure 2.2. Photo from helicopter of the area burned in Pegli...27
Figure 2.3. Photo in the final phase of fire in Pegli. ...27
Figure 2.4. Panoramic view of the Pegli site. ...28
Figure 2.5. Snapped pine trees over the Pegli site. ...28
Figure 2.6. A view of the slope in the Pegli site...29
Figure 2.7. Views of the burned area in Sestri Levante...30
Figure 2.8. In some case the fire affected even the roots of the pine trees in Sestri Levante...31
Figure 2.9. Digital Elevation Model over the three case studies. ...32
Figure 2.10. Soil type on the case studies...33
Figure 2.11. Corine Land Cover map for the case studies...34
Figure 2.12. The sampled pine trees over the area burned in Pegli. ...35
Figure 2.13. Measurement of the understorey basal diameter. ...36
Figure 2.14. Meteosat-8 launched in August 2002. ...37
Figure 2.15. Observed area from Meteosat at 0 degree longitude. ...38
Figure 2.16. A color image from the Meteosat System. ...40
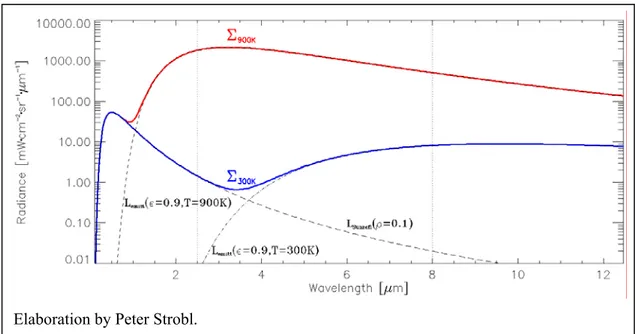
Figure 3.1. The reflectance and emittance components of two objects at T= 300K (blue line) and 900K. The combination of these components provides the radiance spectrum shown in blue (T=300K) and red (900K)...43
Figure 4.1. False Color Composite of SEVIRI image (15th February 2005, 13.12 UTC
time. ...51
Figure 4.2. Fires on a SEVIRI image (date: 15th February 2005, 23.27 UTC; MIR: 3.9 µm)...52
Figure 4.3. Spectral profiles in the MIR and the TIR moving west-east over the active fires. ...52
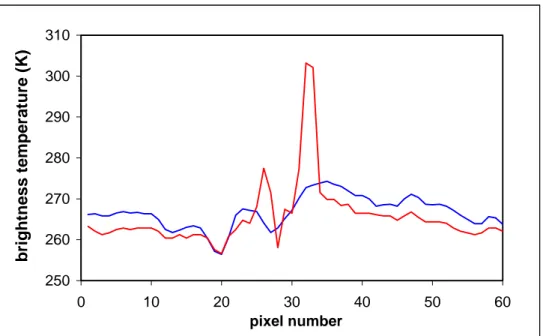
Figure 4.4. Profile of brightness temperatures in the MIR and TIR channels, moving west-east over the active fires. ...53
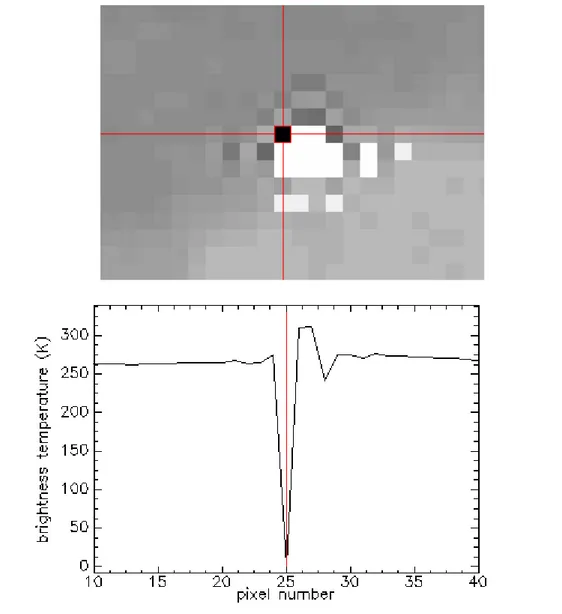
Figure 4.5. The saturation effect over an active fire in the MIR band (Pegli, 14 February 23.42 UTC)...54
Figure 4.6. Active fire detection using the algorithm (a) without the condition on BRF and (b) with a constraint on BRF (0.6µm)...57
Figure 4.7. The FRP time serie in the Pegli site. ...58
Figure 4.8. The FRP time serie in the Savona site...59
Figure 4.9. The FRP time serie in the site of Sestri Levante. ...59
Figure 4.10. Cloud percentage over the fire in Pegli. ...60
Figure 4.11. Cloud percentage over the fire in Savona...61
Figure 4.12. Tree heights versus DBH for the six plots in Pegli. ...63
Figure 4.13. Tree height versus DBH for the four plots in Sestri Levante. ...64
Figure 4.14. Comparison of burned biomass estimates using the field data and the FRE (with and without interpolation). Values are reported with a range of variability due to uncertainty...69
List of Tables
Table 1.1. The contribution of biomass burning to global emissions from all sources. 8 Table 1.2. Global burned biomass estimates and carbon released in different
ecosystems from different authors...12
Table 2.1. MSG instrument details. ...37
Table 2.2. Spectral bands characteristics of SEVIRI...39
Table 3.1. Emission factors of the main chemical species released. Values are gram of species per kilogram of dry matter burned. ...50
Table 4.1. Thresholds applied for cloud masking...53
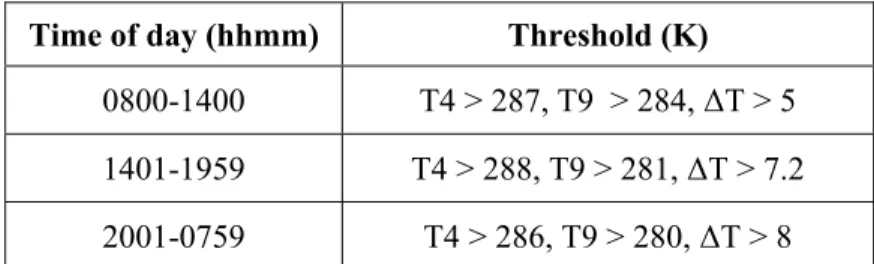
Table 4.2. Set of thresholds applied to SEVIRI images during the 24-hour acquisition. ...55
Table 4.3. The conditions applied in the contextual test. PF4 is the brightness temperature in band 4 of the potential fire pixel; PF9 is the brightness temperature in band 9 of the potential fire pixel; bg4-9 is the mean value of (T4- T9) in the background; sd4-9 is the standard deviation of (T4- T9) in the background; bg4 is the mean value of T4 in the background; sd4 is the standard deviation of T4 in the background...56
Table 4.4. FRE and burned biomass estimates of the case studies. ...62
Table 4.5. Forestry data derived for the two case studies...64
Table 4.6. Trees volumes and dry weights in the two case studies. ...65
Table 4.7. Data used to compute the burned biomass of the understorey in Pegli and Sestri L. sites...66
Table 4.8. Burned biomass estimates for Savona study area...67
Table 4.9. Totals of burned biomass on the three case studies. ...67
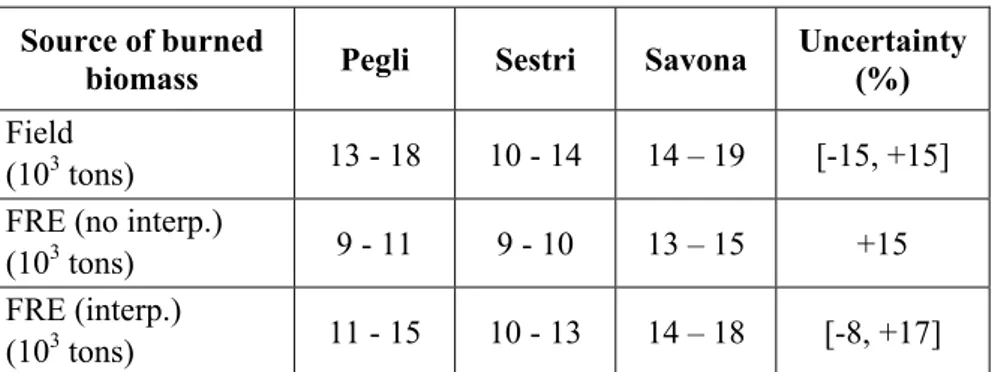
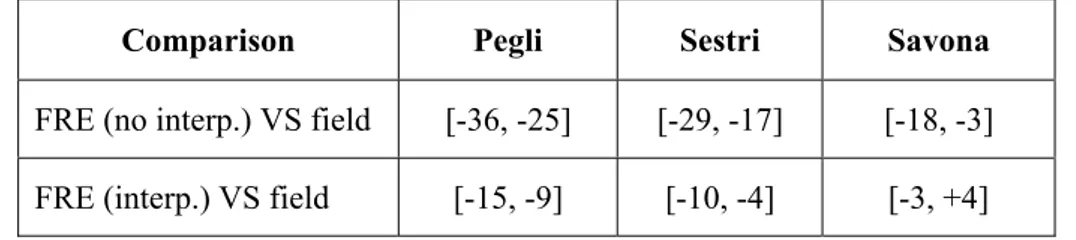
Table 4.10. Biomass burned derived from the FRE (with and without interpolation) and from the field measurements. The uncertainties associated to each estimate are shown. ...69
Table 4.11. Differences between the estimates of burned biomass derived from the FRE (with and without interpolation) and the field reference. ...70
List of Acronyms
ATSR Along Track Scanning RadiometerAVHRR Advanced Very High Resolution Radiometer BRF Bidirectional Reflectance Factor
CFS Corpo Forestale dello Stato
SRTM Shuttle Radar Topography Mission
EFFIS European Forest Fires Information System EOS Earth Observing System
ESDB European Soil Database
EXPRESSO Experiment for Regional Sources and Sinks Of Oxidants FAO Food and Agriculture Organization of the United Nations
FIRESCAN Fire Research Campaign Asia-North FRE Fire Radiative Energy
FRP Fire Radiative Power HRV High Resolution Visible
ISAFA Istituto Sperimentale per l'Assestamento Forestale e per l'Alpicoltura LULUCF Land Use, Land-use Change and Forestry
MAS MODIS Airborne Simulator MIR Mid-Infrared
MODIS Moderate Resolution Imaging Spectro-radiometer MSG Meteosat Second Generation
NOAA National Oceanic and Atmospheric Administration PAH polycyclic aromatic hydrocarbons
SAFARI-92 (Southern African Fire-Atmosphere Research Initiative SCAR-B Smoke, Clouds and Radiation in Brazil
SCAR-C Smoke, Clouds and Radiation in California SEVIRI Spinning Enhanced Visible and Infra-Red Imager TIR Thermal-Infrared
TRACE-A Transport and Atmospheric Chemistry near the Equator-Atlantic UNFCCC United Nations Framework Convention on Climate Change VOC volatile organic compounds
WRB World Reference Base for Soil Resources
Introduction
Research context
Biomass burning is a relevant phenomenon which impacts every component of the biosphere. It affects the world's vegetation including forests, savannas and agricultural areas. According to the inventories from the FAO several millions hectares of forests are burned every year affecting an area covering 0.9 percent of the global forested areas (FAO, 2001). In addition to such an amount, fire burns large areas of other wooded lands.
If we consider the Mediterranean Basin fire activity regularly affects several hundred thousands hectares (European Commission, 2006) with consequences on ecosystems and local air pollution. Although fire has serious impacts on human health and the environment, the information about the amount of vegetation affected and the related fire emissions is still very poor.
Burning is used for clearing of lands, land conversion, agriculture and domestic use. Fire has an important ecological role: it shapes and maintains natural ecosystems, it has several positive impacts on vegetation renovation and, as a disturbance, it can even favour biodiversity (Goudsblom, 1992).
Besides its benefits fire is also a destructive factor for the environment. It can accelerate erosion processes and land degradation, it destroys vegetation communities and, in many cases, it is a danger for human life. Biomass burning releases a significant amount of gases and particulates which have a relevant impact on the atmospheric chemistry and air pollution, radiation budget and climate (Levine et al., 1995). Since the 1980s emissions from vegetation fires have been recognized as an important issue to assess because the amount of some atmospheric pollutants turned to be comparable to that from the fossil fuel combustion. Compared to annual global emissions from anthropogenic sources biomass burning contributes up to 40% and 38% of gross carbon dioxide and tropospheric ozone respectively (Seiler and Crutzen, 1980; Crutzen and Andreae, 1990, Levine, 1991). The assessment of the amounts of trace gases and particulates emitted from fires is therefore an important environmental issue. It also has political implications in the context of the UNFCCC (United Nations Framework Convention on Climate Change) and the Kyoto Protocol. This was also stated at the International Wildland Fire Summit in 2003 where the need for more
accurate information about fire activity was pointed out: “Informed policy and decision-making clearly requires timely quantification of fire activity and its impacts nationally, regionally and globally. Such information is currently largely unavailable” (International Forest Fire News, IFFN No. 29).
In the last two decades many studies have been carried out to improve the understanding of the fire contribution to global gaseous emissions. Several international experiments (ground based, airborne and spaceborne observations) have been organized in order to collect data on fires such as the burned area, the smoke and trace gases emissions. These experiments mainly focused on tropical and boreal regions some of the more relevant are: SAFARI-92 (Southern African Fire-Atmosphere Research Initiative; Andreae et al., 1996, Lindesay et al., 1996), TRACE-A (Transport and TRACE-Atmospheric Chemistry near the Equator-TRACE-Atlantic; Fishman et al., 1996), over Brazil and the south Atlantic; SCAR-B (Smoke, Clouds and Radiation; Kaufman et al., 1998a, 1998b) over Brazil; EXPRESSO (Experiment for Regional Sources and Sinks Of Oxidants; Delmas et al., 1999) in central Africa; FIRESCAN (Fire Research Campaign Asia-North; FIRESCAN Science Team, 1996) in central Siberia, SAFARI 2000 (Queface et al, 2003; Elias et al. 2003; Anyamba et al., 2003; Swap et al., 2003; Manson et al., 2003; Drouin et al., 2003; Buermann et al., 2003). According to Levine (1991) carbon released from fire activity can vary, globally, between 2000-5000 Tg every year. Such variability is not only due to natural reasons, but it is mostly related to the uncertainty in current emission estimates.
Current models combine information on the emission factors with the amount of burned biomass to provide this measure (Seiler and Crutzen, 1980). Emission factors are the amount of the chemical species released per mass of burned biomass; they have been determined in laboratories and field experiments and are now available for most of the gas species with an uncertainty of 20-30%,. On the other hand, burned biomass estimates show an uncertainty level of around 50% (Andreae and Merlet, 2001). Because of this, global emissions inventories are still affected by very high uncertainties (more than 50%) and improvements are needed.
Burned biomass has usually been determined considering the amount of fuel load available to burn and the related burning efficiency. These factors vary in time and space and therefore a real time assessment would be required. However, measuring the amount of fuel load and the related burning efficiency in real time is particularly difficult. Remote sensing is a powerful tool for such an objective and has been
recently used to implement a new method. It is based on the radiant energy released by fires, the Fire Radiative Energy (FRE), that has been shown to be related to the amount of burned biomass (Kaufman et al., 1996, 1998a, 1998b). The relation between the radiant energy measured by spaceborne sensors and the amount of biomass consumed during burning has been assessed in several field experiments carried out in the tropical regions (Wooster et al., 2005; Roberts et al., 2005). Although the relation with burned biomass seems to be independent of the vegetation type, the application of the FRE is still relatively new and further work is necessary to implement the current method and assess its validity in non-tropical ecosystems.
Objectives of research work
The objectives of the present work aim at the implementation of the actual estimates of forest fire emissions in the Mediterranean Basin. They are described in details in the list below.
• The assessment of active fires.
This objective is carried out using the SEVIRI imagery (Spinning Enhanced Visible and Infra-Red Imager) onboard the Meteosat-8 platform. Although the SEVIRI instrument is not designed for fire monitoring purpose, its high temporal resolution (an image every 15 minutes) is of key importance for studying active fires during their life span. Moreover, the new spectral bands provide information in the mid and thermal infrared which is required for fire identification.
In order to monitor the fire events in an automatic way an algorithm for the detection of active fires is developed. This part of the research also contributes with new insights to the use of the SEVIRI imagery for fire monitoring application. The assessment of active fires is presented in Chapters 3 and 4 (Sections 3.1. and 4.1. respectively).
• The estimation of the amount of burned biomass using satellite remote sensing.
In order to fulfil this objective the FRE method is applied. The existing approach developed by Wooster et al. (2005) is used for the first time in a Mediterranean ecosystem, therefore the FRE method is implemented to adapt it to this specific environment. The assessment of the burned biomass with the satellite application is described in Chapters 3 and 4 (Sections 3.2. and 4.2. respectively). The analysis of
active fires and FRE is carried out on selected wildfires which are considered as case studies.
• The preliminary validation of the FRE method using field data.
Besides the satellite applications, the study areas have been sampled in several field campaigns which were carried out to collect ground data of burned biomass. The availability of these measurements allows the first comparison between the amounts of burned biomass derived from the FRE with those provided by the field campaign. The results of the comparison are shown in Chapter 4 (Section 4.4.). This preliminary validation offers an important contribution to present understandings about the FRE application in the context of the fire emissions research.
• The estimation of gaseous emissions.
The emissions are estimated by using the burned biomass derived by the FRE. Results are also compared with emission estimates computed by using the burned biomass derived from the field data. This final objective is described in Chapters 3 and 4 (Section 3.4. and 4.5. respectively).
Structure of the thesis
The first chapter presents the forest fire dynamics and the remote sensing techniques used to assess them. Fire phenomenon is introduced as a global issue, but specific attention is dedicated to the Mediterranean ecosystem. In addition this section contains a review of past and present remote sensing methods used for the analysis of fires.
The second chapter describes the datasets and the satellite sensors used in the analysis; it also presents the case studies and the information collected during the field campaigns.
The third chapter presents the methods applied in the analysis: the fire detection algorithm, the FRE approach and the implementations made to adapt them to the Mediterranean ecosystem. Moreover it reports the methods used for the estimation of the burned biomass from the field measures and the emission factors used to derive the emissions released during the fire events.
In the fourth chapter the results about the fire detection and the FRE are reported and discussed. The burned biomass estimates derived from the FRE are compared with the field data in order to present a preliminary evaluation of the accuracy of the FRE
application. The gaseous and the particulates species emitted during the combustion are also shown.
The conclusions of the study are outlined in the fifth chapter and finally the outlooks of the research activity are presented.
Chapter 1
1. Context of research
1.1. Biomass Burning in the Biosphere
1.1.1. Effects of fire on ecosystems and atmosphere
Fire is a common phenomenon occurring worldwide, from tropical to boreal regions. About 90% of all fires are human-induced; natural causes are lightning and self-combustion. Fire can be used as a land management tool in agricultural practices, land conversion and land clearing.
It affects different ecological processes: biotic and abiotic. It shapes landscape diversity and influences biogeochemical cycles, particularly the global carbon cycle. It can have many positive effects on ecosystems: it controls insect pests and has an important ecological role in the nutrient cycles. After burning many nutrients become available in the ash layer which is rich in phosphorus, potassium, calcium, and magnesium. In addition fire contributes to seed dispersal and high temperatures can stimulate seed germination.
On the other hand fire has detrimental effects if vegetation is not adapted to it. It can cause significant loss of biodiversity and it damages soil if combustion of the litter layer is intense. Once organic material is removed, soil becomes prone to the erosion process. Another relevant effect of biomass burning is the emission of gaseous compounds into the atmosphere. According to the International Forest Fire News (IFFN No. 29) several hundred million hectares of forest and other vegetation types are burned every year. Such activity can contribute up to one-fifth of the total global emissions of carbon dioxide (Levine and Cofer, 2000; Schimel, 1995).
The main chemical species released during fire activity are: carbon monoxide, methane, non-methane hydrocarbons, nitric oxide and methyl chloride with CO2 and
CO accounting for about 87% of the whole C-based emissions (Lobert et al., 1991). The species mentioned above have a greenhouse effect and contribute to global warming. The volatile organic compounds (VOCs), and the polycyclic aromatic hydrocarbons (PAHs) participate to photochemical reactions which lead to the production of tropospheric ozone. Aerosols (e.g. black carbon, particulate organic
carbon) have an impact on the radiation budget since they can scatter or absorb the incoming solar radiation and hence impact the global climate.
Due to long-range transport in the atmosphere, fire emissions have impacts from local to global scale. Besides the direct release of trace gases, the burning of forests destroys important sinks for carbon dioxide and has a long-term effect with implications for the climate (Levine, 1991). Effects of fire on atmosphere and climate are shown in figure 1.1.
Figure 1.1. The impact of gaseous and aerosols emissions from vegetation fires on atmosphere and climate
After the work by Seiler and Crutzen in 1980 biomass burning was finally recognized as a significant contributor to atmospheric greenhouse gases emissions. After their first assessment, many other studies followed confirming its relevance at global level (Crutzen and Andreae, 1990; Andreae, 1991; Levine, 1996).
According to Levine (1995) 8700 Tg of CO2 are emitted every year with about 3500
Tg from biomass burning activity. Compared to all other sources of trace gases emissions biomass burning shows a significant contribution as reported in table 1.1.
Table 1.1. The contribution of biomass burning to global emissions from all sources.
1.1.2. The burning process
Vegetation biomass is made of cellulose and hemicelluloses (50–70% of dry matter), lignin (15–35%), proteins and amino acids. It also contains minerals (up to 10%) and water (up to 60%) and volatile substances such as alcohols, aldehydes, terpenes (Lobert and Warnatz, 1993). Although vegetation has a variability of compounds the carbon content is quite stable across different vegetation types. It is comprises between 45 and 50% of dry biomass weight (Schlesinger, 1991). Therefore, if the combustion of vegetation is complete, the result is carbon dioxide and water and can be simplified as follows:
(C6H12O6)n Æ CO2 + H2O+ 1.28*106 KJ (1)
However, in a real fire many other chemical species are produced, also depending on the chemical-physical phase which is occurring. Most of the chemical compounds released are carbon-based species like CO2, CO, CH4, NMHCs, CH3Cl and NOx, NH3.
During the first phase, called preignition, fuel is dehydrated and pyrolysis occurs. Once fire is ignited pyrolysis continues as a first thermal process followed by combustion. These two processes can however be concurrent. Combustion includes flaming, smoldering and glowing (figure 1.2.). The final phase of a fire is extinction. Each phase has different chemical processes that result in different type of emissions.
Species Biomass burning (Tg element/year) All sources (Tg element/year) Biomass burning (%) CO2 (gross) 3500 8700 40 CO2 (net) 1800 7000 26 CO 350 1100 32 CH4 38 380 10 NMHC 24 100 24 NO 8.5 40 21 NH3 5.3 44 12 S 2.8 150 2 aO 3 (tropospheric) 420 1100 38 Total particulate matter 104 1530 7 Particulate organic carbon 69 180 39 Elementar carbon 19 <22 >86 aO
3 is not a direct product of biomass burning but results from photochemical reactions
Figure 1.2. Phases of a fire
In order to ignite a fire, temperature has to be above 100°C, then water vapor and volatile organic extractives are distilled from the fuel into the air. Pyrolysis starts during this stage. Pyrolysis is an endothermic reaction which elevates fuel temperatures and degrades organic molecules of plant cells. Cellulose and hemicelluloses are the first compounds to be thermally decomposed. Their breakdown results in the production of tars, polymers, char, CO2, CO, water vapour and highly
flammable (high-molecular-weight) hydrocarbon vapours and gases. When temperature rises to 300-400°C fire becomes self-sustaining: the heat released during the reaction supplies the thermal energy needed to maintain pyrolysis and ignites more fuel. This second thermal process is exothermic. It determines the rapid oxidation of hydrocarbon vapors released from the fuel surface. Gas products mixed with air form a flammable combination which initiates the flaming combustion. In this phase the mixture of substances emitted during pyrolysis is converted into simple molecules like CO2, H2O, NO, N2O, N2 and SO2, in addition intermediate products are
also released: CO, CH4, H2, C2H4, C2H2, PAH and particles. During the flaming phase
temperature can reach 1400°C and the oxidation reaction occurs in the gas phase. The heat produced accelerates the rate of pyrolysis and as a consequence releases a greater amount of flammable gases. When charcoal formation reduces the thermal conductivity of the fuel and the flux of heat decreases, smoldering combustion becomes dominant. The oxidation reaction occurs in the solid phase between oxygen
PRE-IGNITION FLAMING SMOLDERING EXTINCTION PRE-IGNITION FLAMING SMOLDERING EXTINCTION
and carbon from the char layer. The rate of fire spread is reduced because the fuel does not provide enough combustible gases. Atmospheric emissions (especially particulate products) are significantly greater than those from the flaming phase. Temperature is usually lower than 600°C during smoldering combustion. The final part of the smoldering process is named glowing. During this phase burning continues at the surface of the charred fuel. Little smoke is present and the main products released are CO, CO2 and ash. This phase of burning shows high efficiency since it
has a slow rate of combustion, with higher O2 concentration. Maximum temperatures
do not exceed 300-600°C. Finally fire gets to the extinction phase when all the available fuel is consumed or when the temperature is insufficient for fuel heating (DeBano et al., 1998).
1.1.3. Current estimates of fire emissions
In order to quantify the amount of trace gases released, current methods use the amount of burned biomass and the emission factor associated with the specific chemical species. The equation used has been first proposed by Seiler and Crutzen (1980). It is the following:
E(x) = M x EF (2) where
E(x) is the total amount of X-species released (grams), M is the total amount of biomass burned (kg),
EF is the emission factor of the X-species (grams of X-species per kg of dry matter burned).
The amount of burned biomass and the emission factor depend on ecosystem, fire type and burning conditions.
Emission factors have been measured in many laboratory and field experiments now available for a large variety of species emitted in different ecosystems. The uncertainty associated to emission factors is around 20-30% (Andreae and Merlet 2001).
Burned biomass is usually derived combining information on burned areas, fuel load and combustion efficiency.
M = A x B x α x β (3) where
A is the total land area burned,
B is the average biomass material per unit area (grams of dry material per m2), α is the fraction of the aboveground biomass relative to the total average biomass B, β is the burning efficiency of the aboveground biomass.
The level of uncertainty attached to burned biomass is around 50% (Andreae and Merlet 2001). Whereas estimates of the burned area (A) are now available with improved accuracy from satellite remote sensing products. The main contribution to the final uncertainty comes from factors B, α and β.
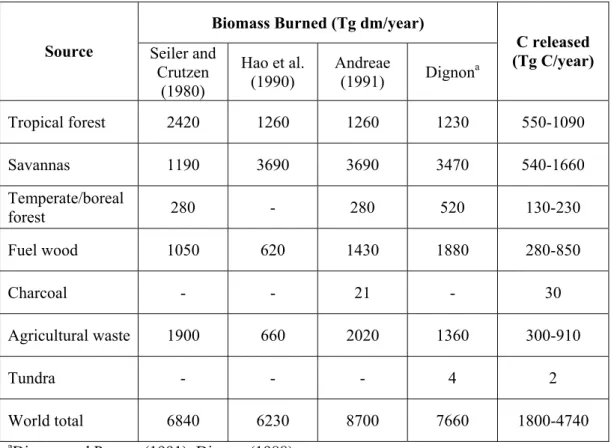
Combustion efficiency (β) and fuel load (B) have been measured in some experimental fires all over the world, but there is still a lack of information especially on non tropical ecosystems (e.g. Mediterranean). Furthermore, due to their high variability in time and space, these variables require frequent updates which would be possible only using a remote sensing approach. Unfortunately it has been demonstrated that it is difficult to assess them through the current satellite remote sensing systems (French et al., 2004). Consequently burned biomass estimates are affected by large uncertainty which leading to wide error margins (more than 50%) in fire emissions inventories. Global burned biomass estimates for different ecosystems, from different authors, are reported in table 1.2. with the corresponding amount of carbon released. The data show a high level of variability among each ecosystem type and at global level. Moreover it can be noticed that there is no specific information for the Mediterranean ecosystem which is included in the general class termed Temperate and Boreal forest.
Table 1.2. Global burned biomass estimates and carbon released in different ecosystems from different authors.
Due to the limitations in the current approaches another methodology has been proposed to determine burned biomass. It uses the energy radiated during the burning process (Fire Radiative Energy, FRE), because this is related to the rate of combustion of vegetation and to the amount of chemical species released (Kaufman et al., 1996; Kaufman et al., 1998b). FRE can be measured from satellite sensors using the infrared spectral bands.
Once the fire energy is determined, burned biomass is derived using the empirical relation suggested by Wooster et al. 2005. In the present study the FRE methodology is implemented to be applied in the Mediterranean ecosystem.
1.1.4. Fire in the Mediterranean Basin
Fire is a recurrent phenomenon in the Mediterranean basin. The number of fire events and the total area affected have important consequences in terms of land degradation and air pollution. As with the global level, the main cause of fire is anthropogenic (around 95% of total), mostly due to deliberate lighting of forest fires and negligence. Agricultural practices are often responsible for unwanted wildfires. In addition the
Biomass Burned (Tg dm/year) Source Seiler and
Crutzen (1980) Hao et al. (1990) Andreae (1991) Dignona C released (Tg C/year) Tropical forest 2420 1260 1260 1230 550-1090 Savannas 1190 3690 3690 3470 540-1660 Temperate/boreal forest 280 - 280 520 130-230 Fuel wood 1050 620 1430 1880 280-850 Charcoal - - 21 - 30 Agricultural waste 1900 660 2020 1360 300-910 Tundra - - - 4 2 World total 6840 6230 8700 7660 1800-4740
abandonment of countryside, caused by the migration of population to urban areas, has facilitated vegetation regrowth increasing the flammable fuel layer and the susceptibility to fire. Another factor contributing to fire risk is the rural mismanagement.
Fire is a characterizing feature of vegetation and landscape in the Mediterranean Basin. In this region vegetation is dominated by evergreen shrubs, woodlands with sclerophyllous and coniferous trees, and forests with evergreen trees. The more common species and plant genera are: Quercus ilex, Quercus suber, Pinus pinaster, Pinus pinea, Pinus halepensis, Pinus nigra, Calluna sp., Arbutus unedo, Ceratonia sp., Larus sp., Erica sp., Cistus sp., Lavandula sp., Rosmarinus sp., Salvia sp., Olea sp., Phillyrea sp., Cedrus libani spp., Chamaerops sp., Buxus sempervirens.
Usually we refer to Mediterranean shrubs as Maquis in case of dense shrub formations or Garrigue if vegetation is more open. Vegetation in the Mediterranean region is extremely rich, more than four times the number of floral species found in all the rest of Europe (IUCN and WWF).
Many types of vegetation have evolved with fire they are adaptated to it or even fire-dependent. Some examples of adaptation are the thick barks of trees (e.g. Quercus suber), the possibility of new shoots from the base roots (e.g. Pistacia lentiscus, Arbutus unedo) and the production of serotinous cones which can spread their seeds after a fire event (e.g. Pinus halepensis).
Figure 1.3. The Mediterranean Basin.
The Mediterranean climate is dominated by hot and dry summer with mild and wet winter. Because of favourable weather conditions most fires usually occur during
summer with a typical peak in August. However some fires are also registered during the winter season when dry conditions and strong wind occur. This is especially the case for northern Italy. On average the fire return interval in the Mediterranean region is around 10-40 years (Mouillot et al., 2003). This period is valid for different types of vegetation with longer intervals typical of the forest ecosystems.
In order to deal effectively with the forest fire issue, the European Union has supported those Member States that undertook programmes for prevention, suppression of fires and restoration of fire affected areas since the Eighties. In addition in 1999 the European Commission, through its Directorate General Joint Research Centre (JRC), set up a research group with the specific objective of monitoring forest fire risk and mapping burned areas at European scale. Within this context in 2003 the European Forest Fires Information System (EFFIS, web page: http://effis.jrc.it/Home/) has been established at the Institute for Environment and Sustainability (IES) of the JRC. At present, EFFIS provides fire danger forecast and an implemented rapid damage assessment; it also includes an EU Fire Database with forest fire information from some of the Member States. At present 18 Member States of the Union are contributing to the Database the period of available data is indicated in brackets: Portugal (1985-2004), Spain (1985-2004), France (1985-2004), Greece (1985-2004), Italy (1994-2004), Germany (1994-2005), Poland (1993-2005), Sweden (1996-2004), Croatia (1996-2005), Cyprus (2000-2005), Hungary (2002-2005), Czech Republic (2004-2005), Latvia (2004-2005), Lithuania (2004), Slovakia (2004-2005), Romania (2004-2005), Finland (2005), Turkey (2005) (http://effis.jrc.it/EU_Fire_Database/). An example of fire risk map provided by EFFIS is shown in figure 1.4.
According to EFFIS several hundred thousands hectares are burned throughout European forests every year ( http://effis.jrc.it/documents/2006/EFFIS_Newsletter-2006_02.pdf). The longer time series of data are available for Portugal, Spain, France, Italy and Greece which are also the more affected countries in Europe. Trends of fire activity in these Member States are reported in figures 1.5. and 1.6.
Figure 1.4. Daily fire risk level estimated with the Fire Weather Index (FWI).
Figure1.5. Burned area in five Member States (Portugal, Spain, France, Italy and Greece)
Figure 1.6. Number of fires in five Member States (Portugal, Spain, France, Italy and Greece) A recent study observes an increase of fire risk in Spain during the period 1941-1994 concluding that global warming might cause an increase in the number of wildfires in this region (Piñol et al., 1998). Similar conclusions are drawn by a study on Portuguese forest fires (Miranda, 1994). Moreover the impact of fire activity is not negligible in terms of greenhouse gases emissions as showed in a recent UN report about Portuguese GHG inventories (FCCC/ARR/2005/PRT). Emissions from wildfires are accounted as part of LULUCF (Land Use, Land-use Change and Forestry) and become relevant for Kyoto Protocol commitments.
0 10 20 30 40 50 60 70 80 90 1 980 1 981 1 982 1 983 1 984 1 985 1 986 1 987 1 988 1 989 1 990 1 991 1 992 1 993 1 994 1 995 1 996 1 997 1 998 1 999 2 000 2 001 2 002 2 003 2 004 2 005 year number of fi res ( 10^ 3) 0 100 200 300 400 500 600 700 800 900 1000 1980 1981 1982 1983 1984 1985 1986 1987 1988 1989 1990 1991 1992 1993 1994 1995 1996 1997 1998 1999 2000 2001 2002 2003 2004 2005 year burne d area (10^ 3 ha)
1.2. Remote Sensing of forest fires
Fire affects ecosystems worldwide and can impact large areas of landscape often located in remote regions. Due to these conditions ground monitoring of fire activity can be very time consuming and expensive in terms of resources involved. Therefore satellite remote sensing offers a unique opportunity for fire observation providing information at different spatial and temporal scales. The application of remote sensing techniques to study fire activity started in the 1990s (Robinson, 1991) using sensors which were not specifically designed for fire monitoring. One of the first applications used the AVHRR (Advanced Very High Resolution Radiometer) instrument, on-board NOAA (National Oceanic and Atmospheric Administration) platform, to identify active fires (Levine, 1996; Malingreau, 1990). Lately many other satellite sensors have been developed and our capability of fire characterization at global and regional level has been improved.
Vegetation fires show several spectral characteristics which are detectable by RS sensors. Fires can be identified while occurring by the presence of smoke and heat, whereas, once the active phase is over, fire occurrence is recognized by the burned scar left on the ground which contrasts with the non-affected vegetated landscape.
1.2.1.
Active fires
Active fires are detectable because they show a typical thermal anomaly in the spectral signal which contrasts with that of the surrounding landscape. The spectral radiation of a body changes with its temperature and its emitted energy can be retrieved as a function of wavelength using the Plank function [B(λ, T)]. As shown in figure 1.7., objects at different temperatures have a peak of emitted energy at different wavelengths: the higher the temperature the shorter the wavelength where the maximum is reached.
Active fires have temperatures in the range 500-1000 K with a peak of energy emission in the region of 3-5 µm which corresponds to the often so-called mid-infrared domain (MIR). This spectral range is therefore very useful to identify active fires. Another spectral region with an important role for fire detection is the thermal infrared (TIR, 8-14 µm). Therefore the two channels are often used together for a more accurate assessment.
Figure 1.7. Emitted energy distribution for a blackbody at different temperatures.
One of the first sensors used for fire monitoring was the AVHRR of the NOAA satellite series (Flannigan and Vonder Haar, 1986). The AVHRR is a polar orbiting system with five channels in the visible and infrared domain; the spectral settings determine its capability to detect hot spots as fire. It has a spatial resolution of 1km and provides an image of the same area every 12 hours. Another sensor with similar characteristics is the ATSR (Along Track Scanning Radiometer) from which a global active fire product (World Fire Atlas) was derived for the period 1995-2006 (Arino et al., 2001). A more recent instrument with specific bands for fire detection is MODIS (Moderate Resolution Imaging Spectro-radiometer) on board the NASA Earth Observing System (EOS). Polar orbiting systems provide one or two images per day of the Earth surface. The temporal coverage of this type of sensors is not high enough for fire monitoring: all the fires occurring between the sensors overpasses are missed; in addition the presence of clouds, which can obscure fires, makes fire detection even more difficult, reducing the number of available observations. High temporal frequency is therefore essential if an effective assessment of fire activity has to be
provided. Geostationary satellites, such as the Meteosat series, provide high temporal resolution imagery and have proved to be suitable for fire monitoring (Roberts et al., 2005).
Fire detection can be performed using automated algorithms and numerous methods have been developed (Flasse and Ceccato, 1996; Justice et al., 1993; Pozo et al., 1997; Li et al., 2000; Giglio, 2003). These algorithms can be classified into three categories:
- Single wavelength threshold, - Multiple wavelength threshold, - Contextual approach.
The first approach is based on the mid-infrared channel only. It uses the brightness temperature recorded in this spectral region because of its high sensitivity to fire. However, the MIR channel can be influenced by solar reflectance during daytime acquisition and highly reflective objects, like bare soil or clouds, can induce a strong spectral response which can lead to misclassification and commission errors. In addition, if problems of saturation occur they are more difficult to handle using this single-channel method.
The multiple wavelength method uses the brightness temperatures and the reflectance values recorded in the infrared and in the visible channels. Fixed thresholds are applied to the bands or to their differences (e.g. MIR and TIR). The use of more bands is useful to overcome some of the typical problems of fire detection. For example the bands in the visible region are used to mask clouds and the bright surfaces, whereas the mid- and thermal infrared channels are useful to reduce the number of false alarms: the difference between the two bands allows discriminating warm surfaces from the active fires since the MIR channel is usually more sensitive to high temperatures than the TIR and therefore a big difference between the two channels is indicative of a thermal anomaly. The combination of visible and infrared bands considerably improves fire detection.
The contextual approach is an additional improvement to fire detection algorithms; this method has been used for global and regional fire monitoring (Justice and Dowty, 1994; Justice and Malingreau, 1996; Eva and Flasse, 1996; Flasse and Ceccato, 1996; Dwyer et al., 1998). Fire is identified using the high contrast it shows when compared to the neighbouring non-fire pixels. The initial fire identification is made using fixed thresholds similar to those applied in the multiple wavelength method. This first part allows identification of potential fires. In the second step the potential fire pixels are
compared to their immediate surroundings to test if their contrast is sufficiently high. In the positive case potential fires are confirmed, otherwise they are rejected. The surrounding pixels of a potential fire are identified using a window with varying size: the dimensions of the window depend on the sensor and the study area. Some statistical parameters (mean and standard deviation) are computed from this ‘contextual window’ and used for the comparison. This method shows more flexibility than the threshold-based approaches and therefore is suitable for different environmental conditions and ecosystems.
In order to improve fire algorithm performance, satellite data are usually previously masked to exclude some problematic features from the analysis. The most common masked-out classes are: water, reflective objects like clouds, bare soil and deserts.
1.2.2. Fire Radiative Energy
Besides active fires identification, fire activity can be further characterised considering its intensity that is the fire energy.
Energy is emitted in several forms: part of it is released as heat for convection, conduction and vaporization of water and gases, another important fraction of energy is released as radiation (Fire Radiative Energy, FRE).
FRE is the total amount of radiative energy released during the burning process; it is derived from the temporal integration of the instantaneous energy released which is termed Fire Radiative Power (FRP):
=
∫
t
FRPdt
FRE [MJ] (4)
Fire Radiative Energy provides important information on the amount of biomass burned and has been proposed as an alternative method for burned biomass estimations in the context of fire emissions research (Wooster et al., 2003).
A relation between FRE and the rate of emissions released was first suggested by Kaufman et al. (1996) in the SCAR-C experiment, more insights were provided during the SCAR-B (Kaufman, 1998a, 1998b). The SCAR-C focused on fires in Northwest US (California) whereas the SCAR-B analysed fires in the Amazon forest and the cerrado of Brazil. The projects considered several aspects of fire activity, the most important of which are: smoke aerosols and trace gases emissions, burned areas and Fire Radiative Energy. Measurements of these parameters were carried out on the ground and using aircraft instruments and the fire spectral signature was recorded in
the thermal and mid-infrared using the MODIS Airborne Simulator (MAS) which has proved to be particularly useful for fire observation (Kaufman et al., 1998c).
One of the most important findings of these experiments is the possibility of measuring the Fire Radiative Energy using spectral channels in the infrared domain. The MIR channel (centred at 3.9 µm) was recognized as particularly suitable because it is very sensitive to fire temperatures. In addition it was pointed out that Fire Radiative Energy and the rate of vegetation consumption are closely related. These conclusions gave ground to the use of satellite remote sensing for studies on vegetation fires and the related emissions.
There are several approaches which can be used for FRE estimation using satellite imagery. One of these is the Bi-Spectral method (Dozier, 1981) which uses fire signal recorded in the MIR and TIR bands. Fire is considered to have multi-thermal components with different temperatures and dimensions. FRP over all wavelengths is derived using the Stefan-Boltzman Law with the following equation:
4 1 k n k k f p T FRP
∑
= =ε σ [W] (5) whereεf is the fire emissivity (grey body),
σ is the Stefan-Boltzman constant (5.67 · 10-8 J s-1m-2K-4),
n is the number of thermal components of the fire,
pk is the fractional area of the kth thermal component,
T is the kinetic temperature of the kth thermal component.
However, this method has some disadvantages since it requires information from two separate channels which can cover different areas. In addition fire temperature estimation, using the TIR channel, can be problematic because this spectral band is quite sensitive to the non-fire contribution of the background (Wooster et al, 2003). This method is applicable to satellite sensors only if the instrument resolution is detailed enough to distinguish among different fire components. Usually an active fire detected from low spatial resolution imagery occupies only a fraction of a pixel. In order to overcome these limitations other methods were developed to derive FRP from a single channel.
The first method to be introduced uses brightness temperature of the fire pixel in the MIR, which is particularly sensitive to the fire signal. This method has been developed by Kaufman (1996, 1998b, 1998c) to be applied on MODIS sensor.
Another approach has been proposed by Wooster et al. (2003, 2005) to derive FRP from low spatial resolution sensors, such as the geostationary systems. This approach has been implemented in small scale experiments and continental applications (Wooster, 2005; Roberts, 2005).
As with the previous method it requires information in the MIR channel only, but it uses the fire spectral radiance instead of the brightness temperature.
The approach applies the Planck Function [B(λ, T)] to show that the fire spectral radiance emitted in the MIR (Lf,MIR) can be approximated by:
Lf,MIR ≈
ε
f,MIRaT4 (6) whereMIR f
L , is expressed in W m-2 sr-1 µm-1,
εf is the fire emissivity (grey body),
a is a constant empirically derived dependent on the wavelength and the temperature range chosen (W m-2 sr-1µm-1 K-4),
T is the kinetic temperature of the fire (K).
Equation 6 is valid for a range of temperatures which is typical of vegetation fires (500-1500K) and can also be written as:
4 1 , , k n k k MIR f MIR f a p T L
∑
= = ε (7) wherea is a constant empirically derived dependent on the wavelength and the temperature range chosen (W m-2sr-1µm-1k-4),
εf,MIR is the fire emissivity in the MIR (grey body),
n is the number of thermal components of the fire,
pk is the fractional area of the kth thermal component,
T is the kinetic temperature of the kth thermal component.
Equation 7 is formally identical to equation 5 which expresses the energy emitted over all the wavelengths. If we equate these two relations, the FRP becomes
independent of fire temperature and fire fractional area (T, pk). Therefore the FRP over all wavelengths can be derived directly from the MIR radiance as is shown in the following expression: f MIR MIR f f L a FRP , , ε σ ε = (8)
Since the emissivity of fire is approximated to that of a grey body, its value is considered stable at all wavelengths (εf = εf,MIR). In order to derive the fire radiance,
MIR f
L , , the contribution from the non-fire fraction in the fire pixel (that is the background) has to be removed from the signal on the active fire pixel. This is possible using the spectral radiance from the surrounding ‘non-fire’ pixels so that the fire spectral radiance, in the MIR, is expressed as:
Lf,MIR =(Lp,MIR−Lbg,MIR) (9)
where
MIR p
L , is the spectral radiance on the active fire pixel,
MIR bg
L , is the spectral radiance of the background,
By taking into account these additional modifications and the pixel size (Asamp), the final expression of FRP as derived from the MIR radiance method becomes the following:
samp (Lp,MIR Lbg,MIR) a
A
FRP= σ − (10)
where
samp
A is the pixel sampling area,
σ is the Stefan-Boltzman constant (5.67 · 10-8 J s-1m-2K-4),
a is a constant empirically derived from the Planck Function (as in equation 6),
MIR p
L , is the spectral radiance on the active fire pixel,
MIR bg
L , is the spectral radiance of the background,
Equation 10 shows many advantages when compared to the formula used in the Bi-Spectral Method. Since it does not require information of sub-thermal fire components, it can be used for low resolution satellite sensors, where most fires have a sub-pixel size. Moreover, using only information from the MIR channel avoids
channels misregistration and uncertainties in fire temperature estimations due to TIR channel. When compared to the single band method developed by Kaufman it has advantages because it can be applied to small and large fires, whereas the method developed for MODIS is more specific for small fires.
There are however some limitations in the MIR radiance approach. The method should be used only when fire temperature is greater than 600 K: for lower temperatures, or small fires, FRP can be underestimated. Underestimation is a common limitation which also affects the other methods described above. Although this is a disadvantage, small fires have a small contribution in terms of biomass burned and gaseous emissions which make this underestimation less crucial. Other factors which reduce the applicability of this method are the conditions that typically limit active fire detection from satellite imagery: clouds and the sun-glint effect. As such these disadvantages are also relevant to the other techniques used for FRP estimation.
Since the FRP value is an instantaneous value of radiant energy, it is necessary to integrate it over time if the whole amount of energy has to be derived (Fire Radiative Energy, FRE). This is possible considering the fire duration and the sampling frequency.
Once the FRE is determined, the biomass burned can be quantified using the empirical relation provided by Wooster (2005). This relation has been derived during a field experiment carried out in the African savannas. The vegetation burned is typical of savannas ecosystem (different types of grass) and was quantified measuring pre and post-fire biomass. FRP was measured using a field spectro-radiometer in different IR regions (range: 0.4-2.5 µm) and a MIR camera (3.6-5.0 µm). The burned biomass was compared with the FRE time series (derived using the MIR radiance approach). As a result the following linear relation could be derived:
Biomass burned = 0.368 · FRE (11) Since the spectral range available on the instruments is identical to that used by satellite sensors (e.g. MODIS, SEVIRI), the conclusions of the field analysis are also valid for satellite applications.
1.2.3. Burned areas
Although only active fire detection is performed in this work, the detection of burned areas is described in this paragraph to complete the review of available remote sensing approaches used for fire monitoring. Burned area mapping is also fundamental for the estimation of fire emissions because it provides the term A (burned area surface) used in the equation 3 (Section 1.1.3.).
Burned area left after fire occurrence shows a deposit of ash and charcoal formations. If the burned area is quite recent (usually few weeks) these features are usually detectable from satellite in the visible domain because the burned area appears darker than its surroundings (Pereira et al. 2003). Another effect of fire is the alteration of the vegetation status. This usually results in a more persistent signal which can be detected in the near-infrared (NIR) and the mid-infrared (MIR). The first shows a decrease in the reflectance values whereas the second registers an increase of the same parameter. Reflectance derived from these channels is used to produce burned area maps. The advantage of this approach, when compared to active fire detection, is the longer availability of the spectral signature. However, rainfall, vegetation regrowth and other environmental factors can affect the spectral signal and make it less contrasting with other land cover types (Justice et al., 1993; Barbosa et al., 1998; Eva and Lambin, 1998)
Several global burned area maps have been released in the last decade: they were derived from ATSR (Simon et al., 2004) and SPOT-Vegetation imagery (Grégoire et al., 2003; Tansey et al., 2004).
Chapter 2
2. Datasets
2.1. Case studies
Three fire events are selected as case studies for the satellite analysis. All of them occurred in Liguria (Italy). Two events happened almost concurrently from 14th to 19th February 2005. One site is located in Pegli (Genova) and the other one affected three communes (Stella, Celle Ligure, Varazze) in the province of Savona. The third case study is a fire from 2004 (6th to 8th September) which occurred in Sestri Levante. The
information about the area burned is provided by the Italian Forest Service (Corpo Forestale dello Stato –Genova, Savona-). The exact location of the burned areas is shown in figure 2.1.
Figure 2.1. Case studies location.
The fire in Pegli was caused by arsonists. It affected an area of 1541 ha covered by Maritime Pine (Pinus pinaster), with an understorey mainly constituted by Erica arborea and Arbutus unedo. A few other species typical of the Mediterranean vegetation can be found in the area: Rhamnus alaternus and Erica spp. The fire was very intense and destructive because of the strong wind and the dry vegetation
conditions. In addition, the dense understorey and the considerable number of pines affected by Matsucoccus feytaudi created ideal conditions for fire spreading. Pine trees with this type of pest usually show abundant quantity of resin along the bark which makes them very flammable. Maritime Pine is a very common conifer in Liguria covering an area of 29 000 ha (APAT, 2000), but the frequent fires and the parasites have significantly reduced its population.
The photos below show the effect of the fire which almost reached the city of Pegli .
Figure 2.2. Photo from helicopter of the area burned in Pegli.
Figure 2.3. Photo in the final phase of fire in Pegli.
Photo: Italian Civil Protection
Figure 2.4. Panoramic view of the Pegli site.
Figure 2.5. Snapped pine trees over the Pegli site.
Photo: Ilaria Palumbo Photo: Ilaria Palumbo
Figure 2.6. A view of the slope in the Pegli site.
The fire occurred in the province of Savona during the same week of February 2005 shows similar conditions of burning (strong wind and dry vegetation) and vegetation type. Fire started because of human negligence affecting an area of 950 ha.
The fire that occurred in Sestri Levante started during the burning of agricultural waste which went out of control. The overall area burned is 505 ha. Vegetation, as in the other cases, is mainly composed of Pinus pinaster with an understorey of Erica arborea and Arbutus unedo. The fire was very intense because the pine forest was particularly flammable being affected by Matsucoccus feytaudi. In addition fire occurred during the summer season (early September) when weather conditions are still particularly favourable to fire spread (high temperatures and dry vegetation). The areas affected by the fire in Sestri L. are shown in the figures below.
Figure 2.7. Views of the burned area in Sestri Levante.
Photo: Ilaria Palumbo
Figure 2.8. In some case the fire affected even the roots of the pine trees in Sestri Levante. All the study sites are located in mountainous areas with steep slopes that typically lead to fast moving crown fires. A Digital Elevation Model is used to characterize the landscape topography over the burned areas. It is derived from the Shuttle Radar Topography Mission (SRTM). The original data has been reprojected into LAEA-ETSR89 and resampled to 100m resolution (Jarvis, 2006). The Digital Elevation Model (DEM) is shown in figure 2.9.
Figure 2.9. Digital Elevation Model over the three case studies.
The study areas have similar geology dominated by metamorphic rocks mainly constituted by serpentine, whereas in terms of soil type they show different classes as
reported in the European Soil Database (http://eusoils.jrc.it/ESDB_Archive/ESDBv2/fr_thema.htm). The soil classes are
based on the World Reference Base for Soil Resources (WRB) (FAO, 1998) and shown in figure 2.10.
The areas of Pegli and Savona are characterized by Dystric Leptosol (LPdy) which is typical of the Mediterranean region. This class is often present in hilly landscapes with steep slopes and shows a limited pedogenic development. Besides this soil type the area in Savona province shows the Eutric Cambisol type (CMeu) which is a young formation very common in the Mediterranean region.
The dominant soil class in Sestri Levante site is the Chromic Cambisol (CMcr) and Calcaric Regosol (RGca) which, as for the other areas, are not very much developed
and typical of mountainous regions. Maritime Pine is well adapted to these soil types since it does not need rich or deep pedogenic formations.
Figure 2.10. Soil type on the case studies.
The land cover type over the case studies is shown in figure 2.11., the classification used is the CORINE Land Cover 2000 ((http://terrestrial.eionet.europa.eu/CLC2000; European Commission, 2005) with a level-2 legend. The map derived from the Image 2000 is reprojected into LAEA-ETSR89 with a 100m spatial resolution. As shown by the map, the study sites are mainly covered by forest.
Figure 2.11. Corine Land Cover map for the case studies.
2.2. Field data
The fires that occurred in Pegli (2005) and Sestri Levante (2004) have been also studied in the field. Several campaigns were organized to collect data over the burned areas. Field work was carried out in August and September 2005. Burned areas were sampled using random circular plots in order to minimize the edge effect. The radius of the plot was defined to be 10m on a planar surface. The declination of the terrain varied between 9º and 38º therefore the radius was adjusted in order to have equivalent plots.
In order to establish the number of representative sampling plots for each study case, some preliminary surveys were carried out in the burned areas to collect information
about the tree cover distribution and the degree of fire intensity (i.e. the level of damage on vegetation). With respect to these aspects both the areas presented little heterogeneity, however the sampled plots were distributed in order to be representative of the variability, in terms of fire intensity, within each site.
The Pegli site was sampled in six plots distributed over the burned area, whereas Sestri Levante, having a smaller burned area, was sampled in 4 different plots. The ‘intensity of sampling’, defined as the total area sampled divided by the total study area, is 1.85% and 3% for Pegli and Sestri Levante sites respectively.
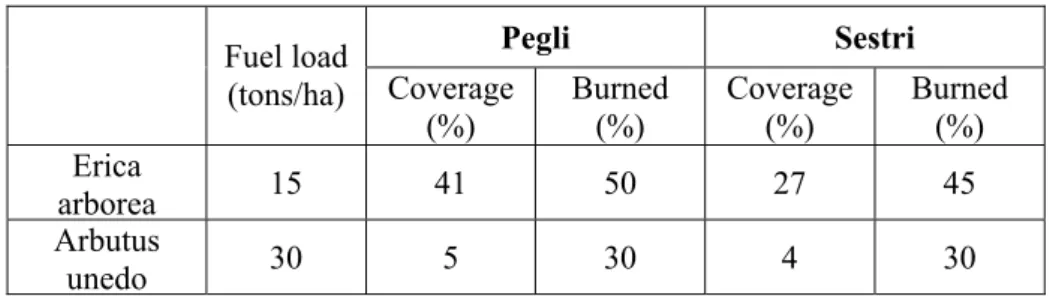
For each sampled area the health status of vegetation and the level of damage were recorded. The main objective of the field measurements was the estimation of the above ground burned biomass. Vegetation volume, and consequently biomass weight, can be determined using information on the tree diameters at breast height (DBH) and tree heights (West, 2004). Although trees were heavily damaged, it was possible to measure these parameters (see figure 2.12.). The understorey layer was sampled as well by counting the number of shrubs on each plot and measuring the basal diameter and the plant major height (see figure 2.13.). The fractional coverage of the main species (Arbutus unedo and Erica arborea) was determined and the percentage of biomass burned was also estimated. All this information is used further in the analysis.
Figure 2.12. The sampled pine trees over the area burned in Pegli.
Figure 2.13. Measurement of the understorey basal diameter.