Università degli Studi della Tuscia di
Viterbo
in convenzione con l’Università degli
Studi del Molise
Corso di Dottorato di Ricerca in
Scienze, Tecnologie e Biotecnologie per la Sostenibilità Ambientale - XXX Ciclo
Monitoring environmental quality with trees - A multiscale
approach towards the implementation of Nature-Based Solution
in urban ecosystems
s.s.d. AGR/05
Tesi di dottorato di: Dott.ssa Annalisa Perone
Coordinatore del corso Tutore
Prof. Mauro Moresi Prof. Bruno Lasserre
Co-tutori Prof. Roberto Tognetti Dott.ssa Claudia Cocozza
A.A. 2016/17
Index
SHORT ABSTRACT ... 6 EXTENDEND ABSTRACT ... 7
2
1.1 Introduction ... 7
1.2 Materials and Methods ... 8
1.3 Results and discussion... 9
I CHAPTER - GENERAL INTRODUCTION & STATE-OF-THE-ART ... 10
(I) 1. Air quality and pollution in urban environment ... 11
(I) 1.1 Mechanisms of pollutants uptake by plants ... 12
(I) 1.2 Tree-rings to biomonitor environmental pollution ... 13
(I) 2. Managing trees and green infrastructure in urban environment ... 14
(I) 2.1 Implementation of the ecological knowledge with NBS in urban planning ... 15
(I) 3. Hypotheses and objectives ... 16
II CHAPTER - MATERIALS and METHODS & RESULTS and DISCUSSION ... 17
II.1 Chapter - FOLLOWING SILVER NANOPARTICLES IN WOODY SPECIES THROUGH FOLIAR AND ROOT UPTAKE ... 17
(II.1) 1. Introduction ... 18
(II.1) 2. Materials and methods ... 20
(II.1) 3. Results ... 25
(II.1) 4. Discussion ... 36
(II.1) 5. Conclusions ... 41
II.2 Chapter - OAK TREE-RINGS RECORD SPATIAL-TEMPORAL POLLUTION TRENDS FROM DIFFERENT SOURCES IN TERNI (CENTRAL ITALY) ... 43
Abstract ... 43
(II.2) 1. Introduction ... 44
(II.2) 2. Materials and methods ... 46
(II.2) 3. Results ... 53
(II.2) 4. Discussion ... 62
(II.2) 5. Conclusion ... 66
II.3 Chapter - NEW APPROACHES TO ENVIRONMENTAL RESEARCH ... 67
(II.3) a - Particulate matter in tree-rings of Quercus pubescens (Willd): micro-tomography synchrothrone analysis ... 67
(II.3) b - Comparing pollutants in epiphytic lichens and tree-rings to detect pollution in urban forestry ... 69
II.4 Chapter- THE GREEN SIDE OF THE GREY: ASSESSING GREENSPACES IN BUILT-UP AREAS OF ITALY ... 72
Abstract ... 72
(II.4) 1. Introduction ... 73
(II.4) 2. Materials and methods ... 76
3
(II.4) 4. Discussion and conclusions ... 83
III Chapter- CONCLUSION & FUTURE PROSPECTIVE ... 88
New tools to address future environmental challenges in urban areas ... 89
Acknowledgements ... 90
References ... 91
List of papers ... 113
Poster and oral communication ... 113
List of Figures and Tables
Chapter II.1: List of Figures
Figure 1: (A) Silver concentration (μg kg-1) and (B) content (μg) in root, stem and leaf of oak, pine and poplar plants supplied with Ag-NPs for 11 weeks: “control”, “leaf supply” and “root supply”. The values are the mean ± SD (n = 5). Different letters correspond to statistical difference between treatments within tissues (lowercase letter for stem; underlined letter for root) (Tukey-HSD, p < 0.05 level).
Figure 2: Scanning electron micrographs of oak (A), pine (C) and poplar (E) leaves, and the corresponding energy-dispersive X-ray spectroscopy in oak (B), pine (D) and poplar (F).
Figure 3: Leaf, stem and root biomass (dy weight, g) (A) and stem and root length (cm) (B) of oak, pine and poplar plants exposed to “control”, “leaf supply” and “root supply” conditions. The values are the mean ± SD (n = 5). Different letters represent statistical differences between treatments within tissues (capital letter for leaf; lowercase letter for stem; underlined letter for root) (Tukey-HSD multiple comparisons at p < 0.05 level).
Figure 4: Stomatal density (A) and length (B) of adaxial and abaxial leaf surfaces in oak, pine and poplar; trichrome density (C) and length (D) in oak leaves exposed to “control”, “leaf supply” and “root supply” conditions. The values are the mean ± SD (n = 5). Different letters represent statistical differences between treatments within tissues (lowercase letter for abaxial leaf surface; capital letter for adaxial leaf surface) (Tukey-HSD multiple comparisons at p < 0.05 level).
Figure 5: Antioxidant compounds (AOX: ascorbic acid, AsA; glutathione, GSH) and reactive oxygen species (ROS: hydrogen peroxide, H2O2; superoxide anion, O2-) in leaves
of oak, (A, B) pine (C) and poplar (D, E) plants, exposed to “control”, “leaf supply” and “root supply” conditions. The values are the mean ± SD (n = 5). Different letters represent statistical differences between treatments for each compound (lowercase letter for AsA and H2O2; capital letter for GSH and O2-) (Tukey-HSD multiple comparisons at p < 0.05 level).
4 Chapter II.2: List of Figures
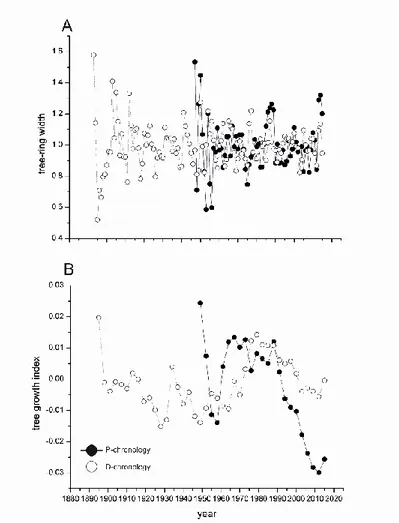
Figure 1: A) Location map of the study area in Central Italy. B) Orographic map of the Terni area. C) Reconstruction of the temporal trends of industrial activity. The arrows indicate the start of specific activities in the area. D) Location map of sampling sites (p1, p2, p3, p4, d5, d6, d7 and d8), factories, landfills and monitoring stations (star symbols). Figure 2: A) Tree-ring width of P-chronology (black circles) and D-chronology (white circles). The tree-ring index is produced through the ARSTAN programme applying a conservative method of detrending with negative exponential curves and/or linear
regressions with negative or zero slopes; B) Tree growth indices (TGI) of Q. pubescens in D and P-chronologies were calculated as the ratio between the mean of the values
measured on 3 consecutive annual rings and the mean of the series for a specific time interval (n). The index is useful to interpret the growth variations in terms of climate or other environmental factors.
Figure 3: Running means of bootstrapped statistically significant correlation coefficients between climate data and tree-ring indexed chronologies (MCF) in P- and D-chronologies. Correlations were calculated separately for each month for the period from March of the previous year to October of the current year. Each rectangle represents a correlation calculated over a 20-yr period plotted in the last year of each 20-yr period. Colour scale corresponds to the sign and strength of the correlations, asterisks refer to significant correlation.
Figure 4: Tendency of elements distribution (mean normalized data) in tree-rings of P-chronology (black circles) and D-P-chronology (white circles)
Chapter II.4: List of Figures
Figure 1: The hierarchical approach used to discriminate and characterize GSB. Figure 2: Built-up areas classified according to the High-Resolution Layers land cover classification.
Figure 3: Distribution of the crown coverages’ classes of forested GSB according to the population density classes.
Chapter II.1: List of Tables
Table 1: Ratio of dry weight (“C/F”) of non-photosynthetic (the sum of stem and root tissues) and photosynthetic organs (leaf tissues) in oak, pine and poplar plants exposed to “control”, “leaf supply” and “root supply”. The values are the mean ± SD (n = 5). One-way ANOVA was applied to determine significant differences between treatments within each species (p-level values are given; ns: not significant).
Table 2: Maximum carboxylation rate (Vcmax), electron transport rate (Jmax), triose
phosphate use (TPU), day respiration (Rday) and mesophyll conductance (gm) in oak, pine
5 (n = 5). One-way ANOVA was applied to determine significant differences between treatments within each species (p-level values are given; ***, p < 0.001; ns, not significant).
Table 3: Total fungal and bacterial populations in leaves and roots of oak, pine and poplar plants supplied with Ag-NPs; leaf of “leaf supply” and root of “root supply” treatments were considered. Data are reported in logarithmic scale. Significant differences between treatments (ANOVA test) are indicated: *, P<0.05; **, P<0.01.
Chapter II.2: List of Tables
Table 1: Laser Ablation ICP-MS parameters.
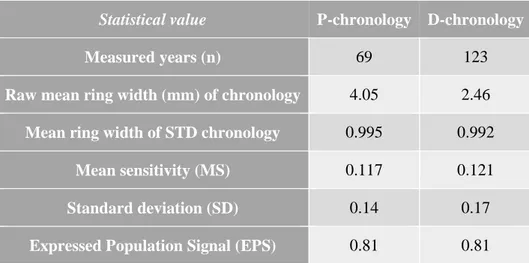
Table 2: Descriptive statistics of two chronologies (P- and D-chronologies): mean tree-ring width calculated on the raw chronology and the STD chronology; tree-ring standard deviation (SD), which estimates the variability of measurements for the whole series; mean sensitivity (MS), which is an indicator of the mean relative change between consecutive ring widths; and EPS, the expressed population signal to indicate the level of coherence of the constructed chronology (ARSTAN analysis).
Table 3: Mann–Kendall rank correlation test of trace elements in P- and D-chronologies. Values of Tau of Kendall, S (Kendall score, expressed as negative or positive value indicating decreasing or increasing trend, respectively), p-value and trend function, defined by arrows, are reported. Significant elements were marked in grey.
Table 4: Levene’s t-test of element patterns in P- and D-chronologies. The test evaluates the significant differences between the means for each element index in P- and D-chronologies (p-value ≤ 0.05). Significant elements were marked in grey.
Chapter II.4: List of Tables Table 1: Classification system adopted.
Table 2: Estimates of abundance ( Nˆ ), coverage ( Aˆ ) and average size ( aˆ ) of GSB, and their estimated relative standard errors (expressed in percent), distinguished by their type (forested GSB and non-forested GSB) and patch size (F-GSB and SW).
Table 3: Estimates ofabundance ( Nˆ ), coverage ( Aˆ ) and average size ( aˆ ) offorested GSB, and their estimated relative standard errors (expressed in percent), distinguished by population density and patch size (F-GSB and SW)
6
SHORT ABSTRACT
In Anthropocene, an era characterized by heavy human pressures on earth, biological assets are increasingly exposed to environmental changes. In particular, plants are required to detect and respond to environmental drivers, modify their functionality, and ultimately provide important goods and services. In this complex framework, there is a rising need towards the implementation of Nature-Based solutions, based on multidisciplinary and multiscale approaches, to effectively support decision-making processes. With this in mind, it was implemented a multi-scale experimental approach to study risks, opportunities and challenges related to the role of greenspaces in urban contexts, with the final aim to enhance human health and wellbeing. In this case, the multi-scale approach consists in studying the impact of environmental pollution through space and time from single-cell to landscape scale.
On one hand, the investigation in controlled conditions enables localization and quantification of particulate matter (PM) accumulation in plant tissues of target tree species, as well as highlighting related changes in physiological processes. On the other hand, the biomonitoring approach allows the spatial detection of pollutant signals and, combined with dendrochemistry, the retrospective analysis of the effect of pollutants in trees exposed to anthropogenic disturbances. The potentiality of plants to accumulate pollutants and the possibility to reconstruct pollution events provide support to assess the effectiveness of greenspaces in urban contexts. At the same time, the prompt assessment of the extension, structure and function of greenspaces at broad scale (e.g., national), through innovative approaches, further enhances the possibility of including these outcomes in real policy and planning processes.
Comprehensive studies offer an opportunity to include a deeper understanding of functional strategies and structural traits of trees within multi-scale planning processes, thus strengthening the implementation of Nature-Based Solutions towards more resilient and sustainable urban environments.
Keywords: urban areas, environmental pollution, trees, biomonitoring, particulate
7
EXTENDEND ABSTRACT
This PhD thesis deals with a multi-scale study approach that considers the role of trees in the urban context. The multi-scale approach consists in studying the impact of environmental pollution through space and time, from single-cell of plant to landscape scale, and implement this results in policy and planning processes towards the assessment of the extent and spatial distribution of trees and green areas at broad scale. The results provided useful information to support the implementation of Nature-Based Solution in the urban environment.
Monitoraggio della qualità ambientale attraverso gli alberi - Un approccio multi-scala attraverso l’implementazione di soluzioni Nature-Based in ambiente urbano.
Questa tesi di dottorato ha considerato un approccio sperimentale multi-scala per studiare il ruolo degli alberi nel contesto urbano. L’approccio multi-scala vuole studiare l’impatto degli inquinanti, nello spazio e nel tempo, dalla singola cellula a scala di paesaggio, e implementare questi risultati ottenuti con politiche di pianificazione attraverso la valutazione dell’estensione, struttura e funzione degli spazi verdi ad ampia scala. I risultati hanno fornito utili indicazioni per l’implementazione di soluzioni Nature-Based in ambiente urbano.
1.1 Introduction
In the last decades, the interest in the benefits delivered as Ecosystem Services by the forest and trees in and around the cities has been constantly increasing.Trees can detect signals of air pollution recorded in tree tissues (Nabais et al. 2001a; Robitaille, 1981; Rolfe, 1974), in order to obtain indication of environmental pollution in space and time (Cocozza et al. 2016; Danek et al. 2015; Odabasi et al. 2015). Trees can be considered a “natural capital” for human well-being due to their capacity to biomonitor and maintain the environmental quality. Therefore, the extent and spatial distribution of greenspaces facilitate the possibility to include trees into future decision on urban planning and management towards the implementation of Nature-Based Solutions (NBS) (Nesshöver et
8 In this work, the first chapter presents a general framework of the whole study.
The chapter II.1 focuses on the detection of pollution signals in oak (Quercus
pubescens Willd.), pine (Pinus sylvestris L.) and poplar (Populus deltoides Bartram)
exposed to nanoparticles (NP) supplied in controlled conditions, in order to assess the potential of three different woody species to accumulate and remove NP from environment.
The chapter II.2 emphasizes the detection of pollutants in tree growth rings, useful as bioindicators to provide spatio-temporal information of environmental pollution in an urban area near a large steel plant. The chapter II.3 presents new aspects and new possible researches approach to the biomonitoring and pollutants detection in tree rings, applied for two different case studies.
The chapter II.4 aims to develop and test an innovative and cost/time-saving approach to achieve large-scale statistically-sound estimates of greenspaces with particular regards to their structure (i.e., abundance, coverage, average size and tree cover density) and ecological functions (i.e., number of people living in the proximity and related ecosystem services provision).
Finally, this thesis reports the main results of the following three activities and includes a general conclusion, chapter III, on how the ecological studies can be effectively utilized in a multi-scale planning process.
1.2 Materials and Methods
The first study was carried out through an experiment approach, using plants grown in controlled conditions and envisaging the supply of nanoparticles in a greenhouse in Switzerland. The investigation was aimed to define particles accumulation in plants and to identify the effects of pollutants accumulation on physiological and biological processes.
The second study adopted a dendrochemical approach through sophisticated scientific analysis (e.g., combining laser ablation and synchrotron radiation). Tree cores of 32 downy oaks were sampled at different distances from several pollutant sources, including a large steel factory. Trace element concentrations in tree-ring wood were determined using high-resolution laser ablation inductively coupled plasma mass spectrometry (LA-ICP-MS). Then a synchrotron analysis was performed to visualize the trace elements in tree-rings in 3D.
9 The third study tested a methodology at national scale (Italy), based on the integration of inventory (the Italian Land Use Inventory- IUTI- Marchetti et al. 2012) and cartographic (the Italian Land Cover High Resolution Map, Congedo et al. 2016) approaches to detect urban forest and the contribution of very small greenspaces, dominated by trees or grasses.
1.3 Results and discussion
The experimental approach (chapter II) evidenced that the pollutants accumulation depends on the species-specific affinity between nanoparticles and plant tissue, the exposure condition, the effective type of contamination and translocation, involving specific physiological and morphological plant modification. These results could be applied in environmental biomonitoring, especially in industrial or urban areas.
The second study (chapter III) revealed that the pollutants in the environment are detected in tree-rings providing information on the type of anthropogenic activities insisting in a defined area with annual resolution. Moreover, tree growth was negatively affected by the industrial plant defining a relevant role of tree monitoring in the assessment of environmental health in urban context.
The third study case (chapter IV) evidenced that in Italy a considerable portion of built-up areas (43.5%) is unsealed and filled by greenspaces (more than 18%), mainly dominated by urban forest. Results revealed that the number of forested greenspaces decreases with the increase of the population density, as well as their coverage and average patch size. The proposed approach provided reliable greenspaces estimates to better understand interactions between humans and nature along an urban-rural gradient, representing a valuable support towards the implementation of Nature-Based Solutions in urban planning.
10
I CHAPTER - GENERAL INTRODUCTION &
STATE-OF-THE-ART
11
(I)
1. Air quality and pollution in urban environment
“Love is in the air, but air is highly polluted” (cit. environmental researcher Amit Abraham)
Industrialization provided humanity with materials and social benefits, though altering the environment and human behaviour (Sharma et al. 2016). Cities comprise less than 3% of the Earth's surface, where there is an extraordinary concentration of population, industry and energy use, leading to a massive local pollution and environmental degradation (Ksenija, 2016), that adversely affect ecological integrity and diversity and human health and well-being (EEA, 2017).
Air pollution is one of the most important problems related with industrialization and urbanization, and is of major concern to societies for its effects on the environment and human health. In the past two decades, the attention of science and society was particularly focused on the effects of air pollution particulate matter (PM, particles with aerodynamic diameter of less than 10 µm) and nanometer-sized particles or “nanoparticles” (NP; particulate matter with aerodynamic diameters ≤2.5 μm) (Wesselinova 2011).
These particles show a heavy toxicity, when accumulated in the environment and when are inhaled, causing diseases to humans and adverse physiological effects (Qian and Wang, 2013). The chemical composition of particles is defined by their composition, which is affected by the pollutant sources (Mazzei et al. 2008), and the size of particles. In the urban context, motor vehicles (emitting Pb and Cd) and industry (emitting Cd, Cr, Cu, Hg, Ni, V, Zn) exert the greatest influence on environmental health (Davydova, 2004). The composition, the size and the origin of atmospheric particles define the toxicity of a pollutant, as well as the processes of dispersion in the environment and the methods for the detection (Schauer et al. 1996).
One of the possible strategies for mitigating air pollution is the promotion of the remediation role of vegetation, that through the ad/absorption of pollutants and particulate matter (Varshney 1985) maintains the ecological balance in the urban environment.
12
(I)
1.1 Mechanisms of pollutants uptake by plants
“A tree can save the world” (cit. forester researcher Davis Nowak, 2014)
The biogeochemical behaviour of pollutants and particulate matter in environment-plant system is still not well investigated, although highly newsworthy (Shahid et al. 2017). Plants can uptake and translocate contaminants through the root tissues and the aboveground organs (e.g., cuticles, trichomes, stomata, stigma and hydathodes) (Wang et al. 2016) (Fig. 1). The interaction between plant and contaminants depends upon the intrinsic properties of contaminants and plant species (Máthé and Anton, 2002).
Figure 1: Different pathways of uptake and transport of nanoparticles in plants (Perez-de-Luque, 2017).
Several researches identified the root uptake of metals as the major pathway by which pollutants (heavy metals and particles) enter the plants, even if only few studies compared the influence of the two ways (roots and leaf) of pollutants uptake by plants (Schreck et al. 2013) and any of those give information on tree species. The role of foliar and root uptake of particles and heavy metals requires investigations for the understanding of speciation, toxicity, compartmentation and detoxification in plants (Schreck et al. 2014; Shahid et al. 2017). It is very difficult to differentiate that contaminants within plant tissues either is taken up by root from the soil or by leaf from atmosphere, because the two kinds
13 of uptake pathways can occur simultaneously in urban and industrial areas. For root metal uptake, generally, the metal in the soil is adsorbed onto the root surfaces, then passively penetrates the roots and diffuses through translocating water streams (Seregin et al. 2001). In the case of foliar transfer, PM may be adsorbed on the leaf surface of plants due to wax cover and leaf hairs (Saebo et al. 2012), depending on their size (Schreck et al. 2012; Eichert et al. 2008). Based on the phobicity of pollutants, two pathways of foliar metal uptake have been hypothesized: the diffusion through the cuticle especially for lipophilic elements and the uptake via aqueous pores of the stomata and cuticle (Larue et al. 2014) (Fig. 1).
Even if remains still difficult to determine exactly the contribution of root uptake or leaf uptake during the contamination, plants can translocate contaminants into tree growth rings.
(I)
1.2 Tree-rings to biomonitor environmental pollution
Plants, as sink of pollutants, can be used to monitor environmental pollution (Lin, 2015). The responses of plants can be useful in order to detect or predict changes in the environment and to follow their evolution in space and time (Lin, 2015).These because plants give qualitative information on the status of environment, acting as bioindicator and provides quantitative information on the environment, acting as biomonitoring surces.
Using plants is interesting in recent time as it is cost effective, sustainable and environmentally friendly compared to traditional physico-chemical methods. Some plant species are highly sensitive to particular pollutants and show specific responses to these elements by presenting specific effects and symptoms.
To study the role of plants as bioindicator and biomonitoring of environmental pollution it is possible to use tree-rings analysis. Annual growth rings of trees have the potential to store pollutants permitting to record of environmental pollution and analysis of wood chemistry of precisely dated tree-rings, a technique known as dendrochemistry (Watmough, 1999, McLaughlin et al. 2002). After entering the trees, heavy metals will deposit in the tree-rings during cambium development. The potential of tree-ring analysis in environmental pollution diagnosis is sill need to improve. The use of dendrochemical techniques to biomonitor environmental for a retrospective analysis of pollution is still on debate (Cheng et al. 2007; Garbe-Schonberg et al. 1997; Nabais et. al., 2001b, 1996). For example, the radial translocation of elements across tree-rings can compromise the
14 temporal resolution of the technique (Cutter and Guyette, 1993). In fact a fundamental assumption of dendrochemical signals is that heavy metals are incorporated in wood of the recently developing, outermost annual growth increments, and then become immobile.
Even so, several investigation have shown successful ability of trees to store particles and heavy metals at the time of tree-ring formation (Watmough, 1999; de Vives et
al. 2006; Odabasi et al. 2011), showing a correlation between environmental pollution and
the concentration of heavy metals in the growth rings. Moreover, they may help also in reconstructing past pollution episodes and levels; however, in many situations this assumption appears tenuous at best (Kennedy, 1992, Poulson et al. 1995, Brabander et al. 1999). Tree-rings represent a widely available source of long-term data, and, therefore, offer considerable potential for identifying quality and changes in the environment (e.g., Cook, Innes 1989, Stolte et al. 1992).
(I)
2. Managing trees and green infrastructure in urban
environment
"In this urban century when there are going to be an extra two billion people in cities, smart cities should be thinking about how nature and trees can be part of the solution to keep air healthy" (cit. Kinver from BBC, 2016).
Trees, with their capacity to biomonitor and maintain the environmental quality, can be considered a “natural capital” for human well-being. The term natural capital refers to elements of nature that, directly or indirectly, produce values for people (Bajer, 2017). Determining the location and quality of natural capital assets, is now underway especially across cities, as being the best tools for tackling and studying the human pressing problems (Bajer, 2017). Forest and green areas within urbanized landscapes were proved to be key components that significantly improve human health and wellbeing (Konijnendijk et el., 2006) and thus support the city-nature bond (Beatley, 2009). Green in cities provide different ecosystem services: can take up CO2, cause local cooling thereby ameliorating the
urban heat island effect, and can reduce pollution.
To benefit functions of greenspaces, it is important to make sufficient provision of quality and quantity of these areas within urban context (Tang and Zang, 2017). Attributes associated to greenspaces, such as size, shape, accessibility, extend, spatial distribution within a city are directly related to their ecosystem services
(Pietrzyk-15 Kaszynska et al. 2017). Integrating these indicators into a framework could also be used to monitor the effects or urbanization and to foster environmental benefits in land and urban planning. Monitoring changes in extent and spatial distribution of green areas is important also to the implementation of “new greenspaces” or the modification of existing ones according to social and economic conditions (Lin et al. 2017, 2015). Nowadays, reliable large-scale information on this topic are usually limited and confused, depending on different terms used, that mean different things in different counties and socio-economic condition, and can be described and assessed in many different ways. For example the term “urban and peri-urban forest”, as specified by many studies (e.g., Konijnendijk et al. 2000), usually refers to all trees within and close to urban areas, thus covering a quite generic and wide meaning (Konijnendijk et al. 2000).
The recently introduced concept of Nature-Based Solutions (NBS) (Nesshöver et
al. 2016) has highlighted the general need of adopting clear, standardized and
unambiguous definitions and methods to facilitate the effective implementation of a multidisciplinary and integrated approach in analyzing the hybrid and complex urban environment (Taylor and Hochuli, 2017).
(I) 2.1 Implementation of the ecological knowledge with NBS in urban planning
Nature-Based Solutions (NBS) aim to address a variety of environmental, social and economic challenges in a sustainable society (EU Green Infrastructure (GI) – Enhancing Europe’s Natural Capital; COM (2013) 249 final). Several actions are inspired by, supported or copied from nature, using and enhancing existing solutions, as well as exploring more novel solutions, as green roofs, open green spaces, urban trees (European Commission, 2015). Nature-based solutions use the features and complex system processes of nature, such as its ability to store carbon and the ability of plants to reduce air pollution, in order to achieve desired outcomes that improves human well-being through an inclusive green growth (Nilsson et al. 2014). This implies that maintaining, assessing and enhancing natural capital (such as, green areas and urban forestry) are important as the basis for urban solutions. In addition, NBS safeguard urban biodiversity and increase the attractiveness and quality of life experienced in urban areas. Interpreting NBS is useful to define the resilience and adaptive processes that do not refer to stabilizing current
16 conditions, but rather to the ability of a complex system to continuously adjust or adapt to changes in society, the economy and the environment (Nilsson et al. 2014).
(I)
3. Hypotheses and objectives
The development of a multi-scale investigation approach is essential to study the effects and the signals of pollutants in plant systems, allowing to evaluate risks, opportunities and challenges related to the role of trees in urban contexts and to enhance human health and wellbeing.
The main objectives of the thesis were to assess: a) whether signals recorded in trees, if any within the wood and other tissues, were caused by direct exposure to the high level of particles and heavy metals, if trees can be used as indicators of environmental pollution in space and time, to be useful to monitor environmental pollution; c) how environmental pollution influences tree-ring growth; d) if the biological and functional aspects of trees can be linked to the planning of sustainable urban forestry and e) in which way the monitoring and assessment of greenspaces in cities can be related to the ecological features.
The study on the mechanisms of pollutants uptake by plants was carried out through an experiment, using plants grown in controlled conditions, and envisaging the supply of NP in a greenhouse in Switzerland. The investigation was aimed to define particles accumulation in plants and to identify the effects of pollutants accumulation on physiological and biological processes in different tree species.
The investigation on the capacity of plants to act as a biomonitoring tool and record environmental pollution was carried out through a dendrochemical approach. The study tested the capacity of trees grown in sites exposed to anthropic disturbance in Terni (Central Italy) to uptake target pollutants and translocate them into growth rings, where they can be stored.
The study on the structure of green areas derived from the development of a new methodology at national scale (Italy). The approach is based on the integration of inventory (the Italian Land Use Inventory- IUTI- Marchetti et al. 2012) and cartographic (the Italian Land Cover High Resolution Map, Congedo et al. 2016) dataset. The main aim was to develope spatial metrics to characterize greenspaces and to provide the need-to-know information to foster environmental benefits in urban planning and management.
17
II CHAPTER - MATERIALS and
METHODS & RESULTS and DISCUSSION
II.1 Chapter - FOLLOWING SILVER NANOPARTICLES IN WOODY
SPECIES THROUGH FOLIAR AND ROOT UPTAKE
Abstract
Particulate matter is one of the key global air pollutants. Nowadays the anthropogenic release of nanoparticles (NPs) in the environment poses a potential hazard to human, animal and plant health. NPs may enter in plants by active or passive uptake. Plants may transport and storage pollutants in tissues. An experiment was performed in greenhouse to assess uptake of NPs and to follow their transport in the leaves, stems and roots of three different tree species: oak (Quercus pubescens Willd.), pine (Pinus sylvestris L.) and poplar (Populus nigra L.). Soluble NPs of silver (Ag-NPs) were supplied to plants through leaf and soil application, separately, and they were not subjected in plants as reference treatment. The Ag uptake, transport and accumulation were investigated using a combination of spectrometry and microscopic techniques. The results show that Ag
18 accumulation were strongly influenced by the type of exposure (root or leaf level) and the plant species. Leaf exposure to Ag-NPs evidenced through ESEM analysis the adsorption of NPs on leaf surface of three plant species. Leaf application of Ag-NPs showed effects on plant growth, aboveground biomass and stem length in poplar plants, whereas it did not affect leaf traits of oak and pine. The photosynthetic potential was not clearly affected by Ag-NPs, although species-specific changes in oxidative stress and antioxidant system were observed. Soil application of Ag-NPs showed a lower NPs transfer than leaf treatment. Moreover, Ag treatment induced some significant variations in the concentration of leaf and root cultivable bacteria and/or fungi. The results highlighted species-specific mechanisms of interaction, transport, allocation and storage of NPs in woody species.
Keywords: Ag-NPs, pathway of uptake, Quercus pubescens Willd., Pinus sylvestris L.,
Populus deltoids Bartram
(II.1)
1. Introduction
The plentiful release of particulate matter, namely nanoparticles (NPs), from natural and anthropogenic sources into the environment causes air pollution with heavy hazards to human, animal and plant health and life, particularly in urban areas (Dietz and Herth, 2011; Tripathi et al. 2017).
Plants can uptake and translocate NPs through the root tissues (Wang et al. 2016). After adsorption on root surface, pollutants passively penetrate the roots and diffuse through translocation water system (Shahid et al. 2014). Indeed, deep-rooted vegetation is a compelling hydraulic lift for the transport and storage pollutants in plant tissues (Lintern
et al. 2013). However, the pollutants availability at root level identifies a minor pathway of
particles transfer compared to foliar uptake (Schreck et al. 2014). Indeed, an important role in airborne NPs adsorption is assigned to the aboveground plant tissues (Schreck et al. 2014; Wang et al. 2016), where canopy represents a relevant NPs capture system (Birbaum
et al. 2010; Nair et al. 2010; Turan et al. 2011; Larue et al. 2014; Sgrigna et al. 2015).
Pollutant may be bound on the leaf surface through cuticular wax, as well as diffused through the lipophilic elements of cuticle and leaf hairs (Sæbø et al. 2012), and via
19 aqueous pores of the stomata (Larue et al. 2014). Once inside the cells, NPs may be transported apoplastically or symplastically through plasmodesmata (Rico et al. 2011).
Foliar uptake of NPs is affected by several factors, as size (e.g., compatible to stomata aperture; Raliya et al. 2016) and form of nanoparticles (e.g., spheres, truncated cubes, rhombic dodecahedra, and rods; Raliya et al. 2016), environmental conditions (e.g., light, wind and moisture; Wang et al. 2013a), plant species (e.g., phloem translocation of NPs was not efficient in maize, Birbaum et al. (2010) in comparison to watermelon, Wang
et al. 2013a), and mode of application (e.g., in powder or suspension treatment, Hong et al.
2014). The NPs-plant tissue affinity is species-specific, though the mechanisms of uptake, translocation, storage, and toxicity of NPs remain largely unknown (Máthé and Anton, 2002; Zhai et al. 2014). Indeed, NPs damage plant functionality and, consequently, plant growth (Tripathi et al. 2017).
Most of these studies were carried out on annual crops (e.g., Yang et al. 2006; Lin and Xing 2007), whereas only few researches were focussed on woody plants (e.g., Nowack and Bucheli, 2007; Navarro et al. 2008; Zhai et al. 2014). Although NPs may accumulate in woody tissues once transported through the vascular system (Seeger et al. 2009; Schreck et al. 2014; Shahid et al. 2017), the role of foliar and/or root uptake in element speciation, toxicity, compartmentation and detoxification in woody plants has been rarely explored (Schwab et al. 2016). In the present study, a new research framework is presented in order to explore the complex process of NPs fate in woody plants, mainly considering the plant exposure to NPs (leaf and root exposure) and the species-specific tissue affinity to NPs. The research was performed supplying silver NPs (Ag-NPs) at leaf and root level, separately, in three different woody species, common in urban and peri-urban environment: downy oak, black poplar and Scots pine, showing different growth habits, leaf traits and stress tolerance. Silver is rarely represented in the Earth’s crust, is predominantly concentrated in basalt (0.1 mg/kg) and igneous rocks (0.07 mg/kg), and it tends to be naturally concentrated in crude oil and in water from hot springs and steam wells (Howe and Dobson 2002). Whereas, anthropogenic sources of silver are smelting, hazardous waste sites, cloud seeding with silver iodide, metal mining, sewage outfalls, and especially the photoprocessing industry (Eisler, 1997). The industrial revolution provides numerous applications of silver, such as medicine, consumer products (cosmetics and sporting equipment), environmental remediation and information technology (Maillard and Hartemann 2012). In this context, the study is aimed to identify risks for the environment,
20 in terms of silver NPs uptake by trees, that can be assessed to: a) quantify Ag within leaves, stem and roots, considering the NPs supply at top-down (leaf spray) and bottom-up (pot watering) level, in order to define the Ag-NPs translocation pathway and its efficiency in different woody species; b) localize NPs in plant tissues using microscopic analysis, in order to detect apoplastic or symplastic NPs transport pathway; c) assess the effects of NPs on plant traits, growth and functionality.
(II.1)
2. Materials and methods
(II.1) 2.1 Plant material and experimental setup
A pot experiment was performed supplying NPs at leaf and root level of Quercus
pubescens Willd. (downy oak), Populus nigra L. (black poplar) and Pinus sylvestris L.
(Scots pine). The experiment was carried out in controlled conditions of the greenhouse of the Swiss Federal Institute of Forest, Snow and Landscape Research (WSL) at Birmensdorf, in Switzerland. In winter 2015, 24 three-year-old trees of downy oak, Scots pine and woody cuttings of black poplar were planted into 15L plastic pots filled with soil fertilizer mixture and grown in the greenhouse under well-watered conditions. After 4 months of growth, in May 2016, plants of similar height and one main branch were selected for the experiment. Temperature and humidity were kept constant (20 °C at night and 25 °C during day-time with 40–60% relative humidity). The experimental layout was a randomized block design with eight replicates per species and treatment.
The experimental treatment comprised the supply of NPs using nanopowder, amorphous-carbon-coated with Ag nanoparticles (Ag-NPs) (Novacentrix, Austin, TX). The Ag-NPs were 98% pure, with an average particle size of 25 nm, specific surface area of 23 m2/gm. The Ag-NPs were directly dispersed in water through surfactant substance to reduce the surface tension of water.
Three different treatments (8 trees for each treatment) were set up: “control”, plants were pot irrigated with tap water; “leaf supply” of Ag-NPs, plants were treated with leaf spray solution of 1 mg Ag-NPs L-1 of water. A plastic membrane was placed on the top of the pot to avoid NPs availability in the soil. The leaf spray treatment was performed in a separate room to avoid contamination of other plants. “Root supply” of Ag-NPs, plants were pot watered with a solution of 1 mg Ag-NPs L-1. The NPs concentration was chosen
21 according to literature (Wang et al. 2013b; Antisari et al. 2014). Fertilizer was not used during the experiment. The Ag-NPs treatments were performed in 10 weeks from May 19 to July 28 (4 weeks with single supply followed by 6 weeks with twice supply), in 16 events of Ag-NPs supply to simulate a chronic exposure to NPs. The final exposure of plants to Ag-NPs was 16 mg L-1 in both leaf and root treatments.
(II.1) 2.2 Determination of Ag
(II.1) 2.2.1 Inductively Coupled Plasma - Mass Spectroscopy (ICP-MS)
Root, leaf, stem and soil (n = 5) were sampled at the end of experiment and dried at 80 °C until constant weight, then ground in a metal-free mill (Retsch GmbH, Haan, Germany). Leaf tissues of “leaf supply” plants were washed in distilled water (according to Ugolini et al. 2013), for the detection of Ag adsorbed on tissue surface and absorbed in tissue. To determine the concentration of NPs in samples, 0.5 g was digested in aqua regia (Nitric acid: hydrochloric acid, 3: 1). Digested samples were diluted with 4.5 mL 1% nitric acid. Silver concentration (μg kg-1), in each sample was measured with ICP-MS (PerkinElmer, Inc., USA). Silver content (μg) in tissue was calculated as:
Ag content = [Ag] x M;
where [Ag] is the amount of Ag per unit of weight (μg kg-1), and M is the dry plant weight (kg).
(II.1) 2.2.2 Environment scanning electron microscopy (ESEM)
The leaves were analysed using FEI Quanta 200 environment scanning electron microscope (ESEM, FEI Corporation, The Netherlands), operating in low-vacuum mode (the chamber pressure was kept at 1 Torr) at 25 kV, without preparation of the samples. The chemical composition of the tissue was determined by energy-dispersive X-ray spectroscopy (EDX) determined by back scattered electron detection. Each leaf area analysed by EDX in our experimental conditions corresponded to a spot of approximately 50 nm in diameter. The ESEM images (300x magnification) of upper and lower surface leaves were analyzed using the ImageJ analysis software. Stomatal size and density (n°/mm2), trichrome typology, density and length per unit area (µm2) were measured.
22 (II.1) 2.2.3 Transmission electron microscopy (TEM)
Electron microscopy was performed on the middle sections of leaves. The samples were fixed with 2.5% glutaraldehyde in 0.2 M phosphate buffer (pH 7.2) for 1 h and then washed twice with the same buffer, prior to a post-fixing procedure with 2% osmium tetroxide in phosphate buffer (pH 7.2). The specimens were dehydrated in a graded ethanol series (25, 50, 75, 90 and 100%); finally, the ethanol was replaced by propylene oxide. The samples were gradually embedded in Spurr resin (Spurr, 1969) and polymerised at 70 °C for 24 h. Ultrathin sections (70-90 nm in thickness) were obtained using an LKB IV ultramicrotome (Rankin Biomedical, USA), collected on Formvar-coated copper grids, stained with uranyl acetate and lead citrate and finally examined with a Philips CM12 transmission electron microscope (Philips, The Netherlands) operating at 80 kV.
Leaf and root tissues were analysed by TEM (PHILIPS CM 12, FEI, Eindhoven, The Netherlands) equipped with an EDS-X-ray microanalysis system (EDAX, software EDAX Genesis, AMETEK, Mahwah, NJ, USA) for the detection of Ag-NPs. The images were recorded by a Megaview G2 CCD camera (software iTEM FEI, AnalySIS Image Processing, Olympus, Shinjuku-ku, Japan).
(II.1) 2.3 Plant traits analysis
(II.1) 2.3.1 Plant growth
Stem and root length was measured at the end of experiment. Biomass allocation in the different organs (roots, leaves, and stems) of control, leaf- and root-treated plants were determined as dry weight (DW) after 24 h of drying in the oven at 80 °C. The ratio between the biomass of non-photosynthetic and photosynthetic organs (“C/F”) was calculated by dividing the sum of stem and root DW and leaf DW (Monsi and Saeki, 2005).
(II.1) 2.3.2 Photosynthetic response curves
Photosynthetic response curves (A/Ci curves), derived from the response of net photosynthesis (A) to intercellular CO2 concentration (Ci), were measured on LPI 5 leaves
of three plants of each species × treatment after 4 weeks of single Ag-NPs supply (June 13) and at the end of treatment (July 28) with a portable photosynthesis system (LI-6400,
23 Lincoln, NE, USA). The leaf area clipped by the chamber was 6 cm2. Leaf chamber temperature and humidity were adjusted to maintain a leaf-to-air vapor pressure difference of 1.1 kPa. The CO2 response curves were obtained by changing the [CO2] entering the
cuvette from 50 to 800 μmol mol–1 with an external CO2 cartridge mounted on the LI-6400
console and automatically controlled by a CO2 injector. The CO2 assimilation rate was first
measured by setting the reference [CO2] near ambient (400 μmol mol–1) and then at 300,
200, 100, 50, 400, 400, 600 and 800 μmol mol–1. Gas exchange was determined at each step after exposure of the leaf to the new [CO2] for 60–120 s; saturating light (Q) was
maintained at 1500 μmol m–2 s–1, 28°C block temperature, and relative humidity of 60%. The maximum rate of ribulose-1,5-bisphosphate carboxylation (Vcmax), the
maximum rate of electron transport used in the regeneration of RuBP (Jmax), triose
phosphate use (TPU), mesophyll conductance (gm) and day respiration (Rday) were
computed from the A/Ci curves using the A/Ci curve fitting model developed by Sharkey
et al. (2008). TPU was determined as the highest A, regardless of whether symptoms of
TPU were present, which makes TPU similar to the parameter Amax reported by other
investigators. Gas-exchange in Scots pine is reported on a unit surface area basis calculated using a geometric approximation of the needle surface.
(II.1) 2.3.3 Determination of ROS and antioxidant compounds
Hydrogen peroxide (H2O2) was measured spectrophotometrically after reaction
with KI, in according to a modified method of Alexieva et al. (2001). A sample (0.25g of fresh leaves) was homogenised with liquid nitrogen and then transferred in 13 ml tube with 2ml of 0.1% tricholoacetic acid (TCA); the extract was centrifuged at 10000 rpm for 10 minutes at 4°C. The reaction consisted 0.5ml 0.1% TCA leaf extract supernatant, 0.2 ml of 100 mM K-phosphate buffer pH 7.8 and 2ml 1M KI. The blank probe consisted of 0.1% TCA in absence of leave extract. The reaction was developed for 1h in darkness and absorbance measured at 390 nm. The amount of H2O2 was calculated using a standard
curve prepared with known concentrations of hydrogen peroxide. The results were expressed as µg/g leaf FW.
Superoxide anion (O2-) was measured as described by Elstner and Heupel (1976) by
monitoring the nitrite formation from hydroxylamine in the presence of O2-, with some
modifications (Jiang and Zhang 2001). Frozen sample (1g of leaf) was homogenised with liquid nitrogen and then put in 13 ml tube with 3 ml of 65 mM potassium phosphate buffer,
24 pH 7.8, and centrifuged at 10000 rpm for 10 minutes at 4 °C. The incubation mixture contained 0.9 ml of 65 mM potassium phosphate buffer, 0.1 ml of 10 mM hydroxylamine hydrochloride, and 1 ml of supernatant. After incubation at room temperature for 1 hour, 17 mM sulphanilamide and 7 mM α-naphthylamine were added to the incubation mixture. After 5 minutes 10000 rpm centrifuged and 15 minutes at room temperature. The sample is ready to be read at 530nm. A calibration curve was established using sodium nitrite. The results were expressed as µg/g leaf FW.
Ascorbic acid (AsA) was determined through the modified method of the Okamura (1980) by Law et al. (1983). The assay is based on the reduction of Fe3+ to Fe2+ by AsA in acidic solution. The Fe2+ then forms complexes with bipyridyl, giving a pink colour that absorbs at 525 nm. Total ascorbate (AsA + DAsA) is determined through a reduction of DAsA to AsA by dithiothreitol. For the concentration quoted, half sample was assayed for total ascorbate content, and the other half was assayed for AsA only. DAsA concentration was then deduced from the difference.
A sample (0.5 g of fresh leaves) was homogenised with liquid nitrogen and then transferred in 13 ml tube with 2 ml of 10% tricholoacetid acid (TCA), the extract was centrifuged at 12000 rpm for 20 minutes; after that supernatant was allowed to stand in ice for 5 minutes. NaOH 5M (10 µl) was added, mixed and centrifuged for 2 minutes. To a sample (200 µl) was added 200 µl of 150 mM NaH2PO4 buffer, pH 7.4, and 200µl of
water. To another 200 µl of sample was added 200 µl of buffer, 100 µl of 10 mM dithiothreitol and, after through mixing and being left room temperature for 15 minutes, 100 µl of 0.5% (w/v) N-ethylmaleimide. Both samples were vortex-mixed and incubated at room temperature for > 30s. To each was then added 400 µl of 10% (w/v) trochloroacetic acid, 400 µl of 44% (v/v) H3PO4, 400 µl of 4% (w/v) bipyridyl in 70% (v/v) ethanol and
200 µl of 3% (w/v) FeCl3. After vortex-mixing, samples were incubated at 37 °C for 60
minutes and the A525 was recorded. A standard curve of ascorbate (AsA) was used for
calibration. The results were expressed as µg/g leaf FW.
Glutathione (GSH) was determined using the modification of the Sedlak and Lindsay (1968) method. A sample (0.5 g of fresh leaves) was homogenised with liquid nitrogen and then transferred in 13 ml tube with 1.5 ml of 5% tricholoacetid acid (TCA), the extract was centrifuged at 12000 rpm for 20 minutes; after that 0.5 ml of supernatant was mixed in 13 ml tube with 1.5 ml of 0.2 M tris buffer, pH 8.2, and 0.1 ml of 0.01M DTNB [ 5,5l-dithiobis-(2-nitrobenzoic acid)] or Ellman’s reagent, and then centrifuged at
25 3000 rpm for 15 minutes. The absorbance was read at 412 nm; standard curve was made with glutathione. The results were expressed as µg/g leaf FW.
(II.1) 2.3.4. Determination of cultivable bacteria and fungi
Cultivable bacteria and fungi concentration was determined in leaves and roots of oak, poplar and pine trees. Leaves and roots were collected from the plants of each plot, packed into plastic bags and immediately brought to the lab to perform microbiological analyses. Roots were vigorously shaken to eliminate the coarse soil particles. Five grams of leaves (or capillary roots) were suspended in 90 ml of saline buffer (0,8 % NaCl) and shaken for 1 hour at room temperature. Suspensions were serially diluted and aliquots of 100 μl of each dilution were spread on agar media specific for the two different microbial groups: tryptic soy agar (TSA) medium amended with 200 ppm cycloheximide for bacteria; potato dextrose agar (PDA), acidified with a solution of 25% lactic acid (200μl/lt) and amended with 100 ppm streptomycin for fungi (Schaad et al. 2001). Plates were incubated at 27°C and monitored for one week. Colonies were counted and the number of colony forming units per gram of leaves or roots was calculated (cfu gr-1).
(II.1) 2.4 Statistical measurement
All data were presented as mean ± SE (standard error), based on at least five replicates per treatment. Data were analysed by one-way ANOVA to assess the difference between treatments for the measured parameters. A post hoc comparison of means was performed using the least significant difference (Tukey-HSD) test at the 0.05 significance level. Statistical analysis was performed with the OriginPro 9.1 (OriginLab), scientific data analysis and graphing software.
(II.1)
3. Results
(II.1) 3.1 Ag content in plants
Silver concentration (µg kg-1 ) (Fig. 1A) and content (µg) (Fig. 1B) varied among plant tissues (root, stem and leaf) and treatments (“control”, “leaf supply” and “root supply”) within each species. The Ag concentration (µg kg-1) in “leaf supply” treated
26 plants was higher in stem than root tissues; whereas, the difference between leaf concentrations between treatments was not detectable because below detection threshold for Ag in leaf of “root supply” treated plants (Fig. 1A). “Leaf supply” treatment in poplar showed the highest allocation in stem, with 21808.99 (± 1714.72) µg kg-1, which represents 84.3% of the total Ag concentration detected, then leaf (15.5%) and finally roots (0.1%). Pine showed Ag distribution of 73.8%, 25.8% and 0.23% in stem, leaf and root, respectively. In oak, Ag distribution was of 68.7%, 30.8% and 0.4% in stem, leaf and roots, respectively.
The Ag concentration in soil samples of Ag-NPs “root supply” was 7.47 ± 0.1 μg kg-1, 25.0 ± 0.3 μg kg-1, 12.99 ± 0.2 μg kg-1, in oak, pine and poplar, respectively; whereas, in Ag-NPs “leaf supply”, it was 2.88 ± 0.1 μg kg-1, 7.24 ± 0.2 μg kg-1, 1.01 ± 0.1 μg kg-1, in oak, pine and poplar, respectively (data not shown).
High values of Ag content were found in Ag-NPs “leaf supply” than “root supply” plants; whereas, Ag was not found in “control” plants (Fig. 1B). Higher values of Ag content were found in pine than oak and poplar. In Ag-NPs “leaf supply” plants, the Ag content was higher in stem than leaf and root tissues in the three species (Fig. 1B). In detail, in Ag-NPs “leaf supply” treatment, in pine 70.7% of the Ag content was allocated in the stem, 28.9% in leaf and 0.4% in root tissues. In oak, Ag was higher in stem (255 ± 93.23 μg) than leaf (22.94 ± 8.59 μg); the same Ag distribution was detected in poplar with higher content in stem (94.50 ± 7.14 μg) than leaf (25.82 ± 4.51 μg), whereas it was not detected in root. Ag was not found in leaf of NPs “root supply” plants in the three species (Fig. 1A, 1B). In root, Ag was preferentially accumulated in “root supply” in comparison with “leaf supply”; whereas, higher Ag content was found in the stem of “leaf supply” than “root supply”, in the three species.
27
Figure 3: (A) Silver concentration (μg/ kg) and (B) content (μg) in root, stem and leaf of oak, pine and poplar plants differently treated: “control”, “leaf supply” and “root supply” with Ag-NPs for 11 weeks. The values are mean ± SE (n = 5) for each species and each treatment. Different letters correspond to statistical difference between treatments within tissues (lowercase letter for stem; underlined letter for root) (Tukey-HSD, p < 0.05 level).
28 Leaf analysis at ESEM detected NPs on the leaf surface of “leaf supply” plants, chemically validated by EDX; whereas, Ag was not detected on leaf surface of “root supply” and “control” plants (Fig. 2).
Figure 4: Environment scanning electron micrographs of oak (A), pine (C) and poplar (E) leaves, and the corresponding energy-dispersive X-ray spectroscopy in oak (B), pine (D) and poplar (F). In squares are indicated the particles detected by back scattered electrons on leaf surface.
Analysis at TEM did not detected nanoparticles in the leaf structure of “leaf supply” plants, though EDS-X-ray did not reveal Ag-NPs.
29 Biometric traits showed significant differences between treatments in poplar (p < 0.05), which were more marked than in oak and pine (Fig. 3A, 3B). Poplar showed a significant reduction in biomass of leaf and stem tissues when exposed to Ag-NPs “leaf supply”; whereas, no significant differences in oak and pine biomass were found in relation to Ag-NPs supply (Fig. 3A). The stem length was reduced by Ag-NPs “leaf supply” in poplar; whereas, Ag-NPs supply did not affect stem and root length in pine and oak (Fig. 3B).
30
Figure 3: Leaf, stem and root biomass (dry weight, g) (A) and stem and root length (cm) (B) of oak, pine and poplar plants exposed to “control”, Ag-NPs “leaf supply” and “root supply”. The values are mean ± SE (n = 5). Different letters represent statistical differences between treatment within tissues (capital letter for leaf; lowercase letter for stem; underlined letter for root) (Tukey-HSD multiple comparisons at p < 0.05 level).
The “C/F” was significant (p < 0.05) in poplar, decreasing when exposed to Ag-NPs supply, “control” > “leaf supply” > “root supply”, while pine and oak did not show significant differences (Table 1).
31
Table 1: Ratio of dry weight (“C/F”) of non-photosynthetic (the sum of stem and root) and photosynthetic organs (leaf) in oak, pine and poplar plants exposed to “control”, “leaf supply” and “root supply”. The values are mean ± SE (n = 5). One-way ANOVA was applied to measure significant differences between treatments within each species (p-level values are given; ns: not significant).
Species Treament C/F (g g-1) p-level Oak control 1.40 ± 0.08 ns leaf supply 1.50 ± 0.05 root supply 1.36 ± 0.07 Pine control 3.07 ± 0.08 ns leaf supply 3.65 ± 0.05 root supply 2.96 ± 0.07 Poplar control 2.24* ± 0.41 0.05 leaf supply 1.66* ± 0.14 root supply 1.32* ± 0.05
Values of photosynthetic capacity (Vcmax, TPU, Rday) and internal CO2 diffusion
(gm) did not change between treatments. Jmax significantly changed in the three species,
resulting lower in “root supply” in pine (13 June) and oak (18 July), in “leaf supply” in pine (18 July), whereas, it was higher in “leaf supply” in poplar (13 June); Vcmax was
significantly lower in “leaf supply” (13 June) in poplar than in the other two species (Table 2).
Table 2: Maximum carboxylation rate (Vcmax), electron transport rate (Jmax), triose phosphate use (TPU), day respiration (Rday) and mesophyll conductance (gm) of oak, pine and poplar plants differently treated with Ag-NPs for 11 weeks. The values are mean ± SD (n = 3) of each species within each treatment. The values are mean ± SE (n = 5). One-way ANOVA was applied to measure significant differences between treatments within each species (p-level values are given; ***, p < 0.001; ns, not significant).
species treatment Vcmax (μmol m-2 s-1) Jmax (μmol m-2 s-1) TPU (μmol m-2 s -1 ) Rday (μmol m-2 s-1) gm (mmol m-2 s-1) 13 Jun e mean st.er mean st.er mean st.er mean st.er mean st.er oak control 35.4 ± 2.9 411.1 ± 18.0 6.1 ± 0.6 1.6 ± 0.2 25.4 ± 0.6 leaf supply 34.7 ± 0.9 430.9 ± 2.0 6.5 ± 0.3 2.6 ± 1.6 23.4 ± 2.5 root supply 37.8 ± 1.9 430.9 ± 0.1 7.0 ± 0.3 2.2 ± 1.0 26.2 ± 0.6 ns ns ns ns ns pine control 21.2 ± 1.9 406.4 ± 19.8 5.7 ± 0.9 2.3 ± 0.5 26.2 ± 0.2 leaf supply 24.2 ± 1.9 401.3 ± 30.0 5.8 ± 0.8 1.6 ± 0.2 26.4 ± 0.3 root supply 28.8 ± 1.5 69.7 ± 7.1 6.6 ± 0.5 1.6 ± 0.1 26.2 ± 0.6 ns *** ns ns ns
32 poplar control 155.1 ± 6.8 83.4 ± 10.6 6.5 ± 0.9 2.3 ± 0.9 22.0 ± 2.5 leaf supply 38.5 ± 6.5 429.0 ± 0.9 5.9 ± 0.4 1.5 ± 0.2 26.5 ± 1.3 root supply 148.6 ± 13.1 84.9 ± 2.5 6.8 ± 0.4 2.0 ± 0.7 20.7 ± 3.0 *** *** ns ns ns 18 July oak control 37.8 ± 9.4 428.0 ± 1.8 7.0 ± 1.2 1.6 ± 0.4 26.0 ± 0.9 leaf supply 29.5 ± 14.0 411.7 ± 15.1 4.3 ± 2.2 1.0 ± 0.7 27.6 ± 1.3 root supply 60.9 ± 5.8 298.2 ± 5.4 9.3 ± 0.7 1.9 ± 0.7 22.8 ± 4.1 ns *** ns ns ns pine control 25.7 ± 12.7 412.9 ± 8.2 5.9 ± 1.8 4.8 ± 3.2 26.5 ± 1.7 leaf supply 36.1 ± 0.6 111.1 ± 48.7 7.4 ± 0.5 3.3 ± 2.1 25.8 ± 1.0 root supply 25.2 ± 16.9 412.9 ± 6.1 5.9 ± 2.1 3.0 ± 1.8 23.5 ± 3.8 ns *** ns ns ns poplar control 75.0 ± 5.3 411.1 ± 29.1 7.2 ± 0.3 2.8 ± 1.0 24.6 ± 1.2 leaf supply 51.6 ± 1.4 433.2 ± 1.8 7.5 ± 0.7 3.0 ± 0.6 27.3 ± 0.8 root supply 42.8 ± 13.3 434.3 ± 1.9 7.1 ± 1.2 2.0 ± 0.6 27.1 ± 0.8 ns ns ns ns ns
The leaf morphological characterization showed significant differences in stomatal density in poplar; whereas, no differences between treatments were found in stomatal density in oak and pine (Fig. 4A). Stomatal density of poplar was different between treatments in the abaxial leaf surface, showing higher values in “leaf supply” plants (205.2 ± 17.1 stomata mm-2) than “root supply” and “control” plants; no differences in stomatal density were found in the adaxial leaf surface (Fig. 4A).
Stomatal length was affected by Ag-NPs treatment in the three species (Fig. 4B). Stomatal length was higher in “leaf supply” and “root supply” plants in oak and pine in comparison with “control” plants; whereas, it was higher in “control” than Ag-NPs treated poplar (Fig. 4B). In poplar, stomatal length was significantly different between treatments in both leaf surfaces, abaxial and adaxial (Fig. 4B).
The trichome structure in leaves of oak was affected by Ag-NPs treatment (Fig. 4C). Trichome density was significantly lower in the abaxial and adaxial leaf surfaces in “leaf supply” plants and in the adaxial leaf surface of “control” and “leaf supply” plants, in comparison with “root supply” plants. Trichomes length were significantly different in “leaf supply” plants than in other treatments (Fig. 4C).
33
Figure 4: Stomatal density (A) and length (B) of adaxial and abaxial leaf surface of oak, pine and poplar; trichrome density (C) and length (D) in leaf surface of oak plants exposed to “control”, “leaf supply” and “root supply”. The values are mean ± SE (n = 5). Different letters represent statistical differences between treatment within tissue (lowercase letter for abaxial leaf surface; capital letter for adaxial leaf surface) (Tukey-HSD multiple comparisons at p < 0.05 level).
34 Determination of reactive oxygen species (ROS), superoxide anion (O2-) and
hydrogen peroxide (H2O2) was performed to detect oxidative stress. Ag-NPs “leaf supply”
treated plants showed a significant accumulation of H2O2 in oak plants; in poplar, higher
values of O2- were found in leaves of Ag-NPs “leaf supply” and “root supply” plants in
comparison with “control” plants; whereas, in pine, ROS were not found (Fig. 5). The concentration of antioxidant compounds (AOX), ascorbic acid (AsA) and glutathione (GSH), was performed to detect the biochemical antioxidant system. Ascorbic acid was significantly higher in “leaf supply” plants of oak and in “root supply” plants of pine in comparison with “control” plants; whereas, it was not different between treatments in poplar (Fig. 5). In pine and poplar, GSH concentration was higher in “root supply” plants than “leaf supply” and “control” plants (Fig. 5).
35
Figure 5: Antioxidant compounds (AOX: ascorbic acid, AsA; glutathione, GSH) and reactive oxygen species (ROS: hydrogen peroxide, H2O2; superoxide anion, O2-) in leaves of oak, (A, B) pine (C) and poplar (D, E) plants, exposed to
“control”, “leaf supply” and “root supply”. The values are mean ± SE (n = 5). Different letters represent statistical differences between treatments per compound (lowercase letter for AsA and H2O2; capital letter for GSH and O2-)
36 Ag-NPs supply affected bacterial and fungal populations in roots and leaf tissue of plants exposed to “control”, “leaf treatment” and “root treatment”. Ag-NPs “leaf supply” treatment significantly reduced the leaf bacterial population in oak and poplar and fungi population of pine (Table 3). “Root supply” did not affect microbial population of oak and pine roots, whereas the bacterial and fungal population of roots were reduced by Ag-NPs treatment in poplar (Table 3).
Table 3: Total fungal and bacterial population in leaves and roots of oak, pine and poplar plants exposed to related Ag-NPs supply; leaf of “leaf supply” and root of “root supply” treatments were considered. Data are reported in logarithmic scale. Significant differences between treatments (ANOVA test) are indicated: *, P<0.05; **, P<0.01.
OAK (cfu/ml) PINE (cfu/ml) POPLAR (cfu/ml)
Treatmen t Tissues Fungal Bacteria l Fungal Bacteria l Fungal Bacteria l control leaf 7.7x10³ 7.7x104* 1.1x10 4** * 5.9 x10⁴ 5.4x10³ 2.8x10⁵* leaf supply leaf 7.7x10 3 7.7x103* 1.6x10 3** * 5.9 x10 4 2.3x10³ 2.8x10³* control root 1.3x10⁵ 3.0x10⁸ 4.8x10⁵ 4.3x10⁸ 2.3x10 5* * 1.8x10 8* root supply root 1.4x10 5 2.3x10⁸ 5.5x10⁵ 7.3x10⁹ 1.3x10 6* * 8.2x10⁷*
(II.1)
4. Discussion
The importance of woody species and NPs in urban ecosystem is relevant, considering the continuous high anthropogenic impact and the potential of trees to improve environmental quality. To simulate the effects of nanoparticles under natural-like conditions, we supplied Ag-NPs through suspension spray on leaf and watering of root in greenhouse conditions. Although the potential of poplar to adsorb NPs has been documented (Zhai et al. 2014; Wang et al. 2013b), the uptake capacity of oak and pine remains to be explored. Several studies were carried out in hydroponic system (Ma et al. 2010; Shahid et al. 2014), focusing on soil-root transfer and removing the effect of soil in the interaction between plant and NP. We focused on the attitude of downy oak, black poplar and Scots pine to interact with available Ag-NPs in the surrounding environment. The concentration of Ag-NPs in the environment is low, e.g., it ranges between 0.1 ng/L in the USA and 0.8 ng/L in Europe in surface waters (Gottschalk et al. 2009).The photosynthetic potential of trees was variably altered by the treatment with Ag-NPs, which