Cristina Cornaro, Davide Musella Performance analysis of PV modules of various technologies after more than one year of outdoor exposure in Rome pages 3529-3540
Performance analysis of PV modules of various technologies after
more than one year of outdoor exposure in Rome
Cristina CORNARO1,2, Davide MUSELLA1,2
1Department of Enterprise Engineering, 2CHOSE, University of Rome Tor Vergata
Via del Politecnico, 1 00133, Rome, Italy
Abstract
The paper deals with an extensive PV modules monitoring activity carried out at the outdoor station ESTER of the University of Rome Tor Vergata. The purpose of the work was to evaluate and compare the performances of PV silicon modules of polycrystalline and amorphous technologies during a medium term outdoor exposure at optimized tilt angle, facing south. Two PV modules, one polycrystalline by Kyocera and one double junction amorphous by EPV Solar have been exposed since May 2009. A complete characterization of the weather conditions at the site during the test has been performed and the most relevant parameters for the performance comparison of the two technologies have been derived. In order to compare different technologies and power productions, the energy Yield (Y) and Performance Ratio (PR) for the two modules have been evaluated on a monthly and yearly basis. The typical seasonal trend of PR has been observed for the polycrystalline module, essentially due to the temperature influence on the module performances. For the EPV module, instead, a degradation trend has been observed for the first months of operation. Subsequently a significant recovery in the PR and energy production has been registered.
Keywords
PV modules, outdoor monitoring, amorphous silicon. Introduction
Many PV modules manufactures are present on the market claiming high performance and high reliability of their products. The module specifications are restricted to the Standard Test Conditions (STC) that are not very representative of the real conditions in which the PV devices have to operate. It has been proved by various work in the literature that the PV modules performances depend on their technology, on the location, the weather conditions and the mounting configuration [1], [2], [3], [4]. The behaviour of thin film devices as amorphous silicon (ASI), CdTe and CIS are still not very well understood, [5], [6] and require more research. Moreover new emerging technologies like polymeric and organic solar cells, are requesting a wide research activity to better understand their behaviour in the outdoor conditions. Therefore, it is important to evaluate the real behaviour of photovoltaic devices in outdoor conditions through reliable and accurate measurements, that can be useful for the costumer that has to choose the right device for his specific application.
In Europe, there are well established laboratories that are doing research on the performances of PV modules of well consolidated technologies as well as new emerging ones [7], [8], [9].
More recently an outdoor monitoring facility, called ESTER, for testing PV modules of various technologies has been built at the University of Tor Vergata and it is part of the laboratories of the CHOSE (Centre for Hybrid and Organic Solar Energy), a centre born in 2006 and funded by the Lazio Region with the objective of give impulse to the photovoltaic in Italy and especially to develop and industrialize the Dye Sensitized Solar Cells (DSSC) as a new generation of photovoltaic technology. The present paper illustrates the results of a monitoring activity started in May 2009 with the objective of evaluate and compare the performance of a poli-Si PV module of well established technology and a double junction amorphous silicon PV module of the second generation of photovoltaic.
Experimental setup
The research activity has been carried out at the ESTER outdoor station of the University of Rome Tor Vergata. The station, in the configuration shown in Figure 1, is active since 2007, [10] and has been partially funded by the Lazio Region in the framework of the Centre for Hybrid and Organic Solar Energy (CHOSE). It consists of three separate units: a solar-weather unit, a spectral unit and a PV monitoring unit. The solar-weather unit provides measurements of the three separate components of solar irradiance (direct, diffuse, reflected) and the global solar irradiance on a horizontal plane together with the standard weather parameters. The spectral unit, recently added, measures the spectral irradiance on a horizontal plane in the spectral range between 350 nm and 1,700 nm. The PV monitoring part of the facility is provided with two stands that allow to expose approximately 8 modules of medium size.
Figure 1: Overview of the ESTER station.
The stand n. 1 is a south oriented frame with variable tilt while the stand n. 2 is a sun tracker. Both stands are equipped with irradiance sensors (pyranometers and reference cells of various technologies) and have local weather stations installed nearby.
The architecture of the data acquisition system is shown in Figure 2 for the three separate units. At the PV monitoring facility each PV module under test is kept at the maximum power point of operation by a dedicated electronic device (MPPT3000), which provides measurements of
Pmax at a time rate of 1 minute, while every 10 minutes it traces the IV curve of the device.
(EKO pyranometers and IKS – ISET sensors), air and module temperature and wind velocity and direction at the same time rate of 1 minute. Data acquisition is managed by a CR1000 data logger from Campbell Sci. that downloads the data in three dedicated tables of a server database built using MySQL platform. The solar-weather unit data acquisition is managed by a CR10 data logger from Campbell as well, synchronized with the CR1000. The acquisition system downloads the solar-weather data in other two specific tables of the same database. The spectral unit, which consists of two EKO spectroradiometers, is managed separately by a dedicated computer using software provided by the manufacturer. A future upgrading of the system foresees to download also the spectral data in the same database of the other units. A detailed analysis of the uncertainty sources of all the instrumentation of the monitoring unit has been performed, together with the validation of the system, [11].
Figure 2: Layout of the data acquisition system.
The monitoring activity presented in this work has been started in April 2009 and data analysis is presented from May 2009 till October 2010. A double junction amorphous silicon device from EPV Solar (EPV-50) has been mounted on Stand 1 where a polycrystalline silicon module by Kyocera (KC125-GHT) was already exposed since January 2008, as shown in Figure 1. Tilt angle has been varied each month in order to optimize energy collection and simultaneously provide normal incidence at noon. This configuration strategy has been chosen in order to have also useful data for NOST (Nominal Operating Specific Temperature) and/or NOCT (Nominal Operating Cell Temperature) and temperature coefficients calculation [12] during the year and IV curve tracing in accordance to IEC60904-1, [13]. Back of the module temperature, it has been measured attaching a Pt100 sensor on the back of each module. In plane irradiance has been collected by the EKO pyranometer. Electrical parameters measured every minute by the MPPT at the maximum power point have been considered for the analysis.
Data analysis
Data coming from the PV modules monitoring unit are extracted from the database using a made on purpose software, called Noria [14]. Noria has been conceived in order to simplify data recognition and interpretation. Virtually reproducing the station hardware and each configuration of the tests performed during time, the software can correctly recognize the data in the database and extract them through logical queries. Data extracted for the present work
have been sorted only by date and PV module type, archiving them on a monthly basis, however many filters on irradiance, air temperature, module temperature, wind velocity, electrical parameters can be applied to the dataset.
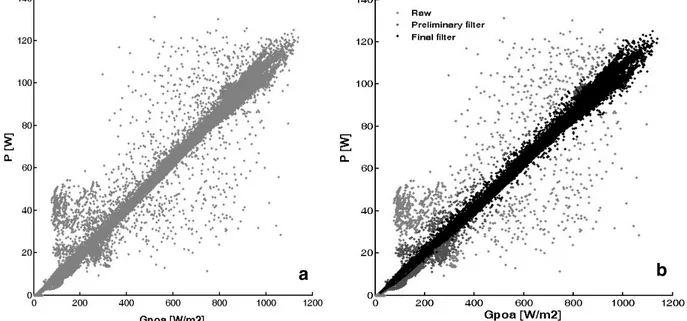
Figure 3: a) Raw power data versus in plane irradiance of KC125 for the month of July; b) the same data after the filtering procedure (black dots).
Figure 3a shows the raw data of the electrical power versus irradiance for the month of July 2009, for the KC125 module. It is recognized the typical linear trend, however a high data aggregation is visible at low irradiance. Shadowing and/or reflection from the surroundings are responsible for this deviation from the linear trend causing data disturbance. Moreover certain dispersion in the data can be observed, especially at medium irradiance values, probably due to fluctuation of the environmental parameters and to the oscillation of the power point tracking system. In order to clean data from these disturbances, a filtering procedure has been implemented in the Matlab software. The filtering procedure also eliminates data coming from system fault and data that are out of the physical range limits of each of the parameters considered (see Table 1). Besides, solar irradiance lower than 20 W/m2 has been discarded. Figure 3b shows the resulting data after the filtering procedure. The described procedure has been applied to the data of the KC125 and EPV-50 modules archived on a monthly basis for a period of 18 months.
Table 1: Physical limits of the measured parameters used for data filtration.
Parameter Range/Limit Irradiance [W/m2] 20 - 1500 Diffuse irradiance [W/m2] 0 - 800 Global > Diffuse Relative Humidity [%] 0 – 100 Voltage [V] 0 – 300 Current [A] 0 – 300 Module power [W] P > 0 a b
Results
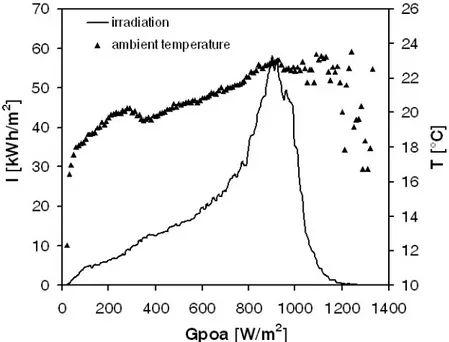
A detailed climatic characterization has been carried out for the eighteen months of monitoring. Ambient temperature and irradiance have been treated to get the irradiation and the average ambient temperature evaluated at various irradiance classes (Gpoa), as shown in Figure 4. On
the whole, during the test the incident irradiation (I) has been of the order of 2.2 MWh/m2, with consistent high energy collected at high irradiance values. This is due to the fact that in the 18 months of test we have two summer periods that increase the high irradiance contribution.
Figure 4: Irradiation and average ambient temperature evaluated at different irradiance classes.
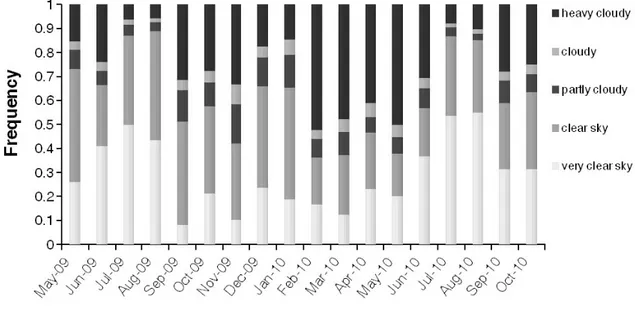
To characterize the weather conditions during the test period the ratio of diffuse irradiance on a horizontal plane, over the global irradiance on the same plane, has been evaluated for each minute of acquisition. This ratio, called Cloud Ratio (CR), gives an indication of the amount of diffuse irradiance during time. CR varies from 0 to 1 and this range has been divided into five classes, each of them representing a particular weather condition that can be attributed to the time in which the data have been collected. CR values near 1 are representative of bad weather conditions while CR values near 0 represents clear sky conditions. It has to be noted, however, that high values of CR can be related not only to cloudy sky conditions, but also to data taken at early morning and late afternoon, so this classification has to be considered as purely indicative. Figure 5 represents the five CR classes observed for each month of the test. Higher percentage of clear sky instants is mainly present during summer.
It can be observed that the spring months of year 2010 present less favourable weather with high percentage of cloudy days.
To evaluate the performances of PV modules of various technologies a series of indices can be considered. The main index used in the absence of direct measurements on the module is the efficiency at Standard Test Conditions (STC). These conditions are values of irradiance (1,000 W/m2), module temperature (25 °C) and air mass (AM 1.5) considered as reference for modules properties evaluation.
Figure 5: Cloud Ratio frequency evaluated for each month of the test. The efficiency at STC is defined as:
nom STC STC P A G η = ⋅ (1)
where Pnom is the nominal power (or peak power) at STC, A is the surface area of the module
and GSTC is the irradiance of 1,000 W/m2. This efficiency can be derived from the specification
given by the manufacturer or can be evaluated through indoor measurements using a sun simulator [15].
When the PV module is working in the real environment at its maximum power point its real efficiency can be defined as follow:
max poa P A G η = ⋅ (2)
where Pmax is the PV module electrical power produced at the maximum power point of
operation and Gpoa is the correspondent in plane irradiance. These indices evaluate the module
performances instantaneously but they can also give information about the performances in a defined period of time. In this case instead of electrical power and irradiance the correspondent energy values in the defined period of time (day, month, year) have to be evaluated. The efficiency indicates the performance of a device but it does not give indications about its energy production. If one wants to evaluate and to compare the energy production of different modules of different power size, the energy yield is the suitable parameter to use. The energy yield (Y) is written as:
[
]
kWh / kW nom E Y P = (3)where E is the electrical energy produced by the module in a defined time interval and Pnom is
modules work at their peak power value. Since the energy production is normalized to the module size, this index allows comparing PV devices of different peak powers, as already said. It is well known that the energy production of a PV module does not depend only by radiation intensity but also to some extent to the temperature of the module, to the variation of solar spectrum and also to other factors that do not strictly depend on the module itself. To take into account all these influences, another index called Performance Ratio (PR) is defined, [16]:
with r r STC Y I PR Y Y G = = (4)
Yr is called the reference yield and is the ratio between the irradiation evaluated in the
considered time interval and the irradiance at STC; it also represents the sun peak hours defined as the hours in which the in plane irradiance has reached the 1,000 W/m2. The PR index can also be seen as the ratio of the real efficiency over the efficiency at STC, and for this reason it measures how far is the behaviour of the module with respect to its performance at STC. As already mentioned, this index is not sensitive to irradiance variation but to secondary effects on the module performances.
Figure 6: Monthly yield calculated for the KC125 and the EPV-50 modules.
For the KC125 and the EPV-50 module the monthly yield and performance ratio have been calculated and are shown in Figures 6 and 7. From the graph of figure 6 it can be noted the low energy production of the two modules during the winter period, which corresponds to lower peak sun hours, also showed in the graph. The high yield observed in August 2009 for KC125 is mainly due to the higher value of peak sun hours calculated for this module, with respect to EPV-50. This difference in Yr is due to the filtration procedure, which cut different amount of data for the two modules. Also for May and June 2010 a lower energy production can be observed with respect of the same months of 2009 and this is mainly due to the worst weather conditions experienced for these months in 2010. The energy production for the KC125 is
higher than for the EPV-50 for approximately one year (May 2009 till June 2010), but after this period the two modules have approximately the same yield. This trend for the year is probably due to the effect of degradation of amorphous silicon.
Figure 7: Monthly Performance Ratio (PR) calculated for the KC125 and the EPV-50
modules.
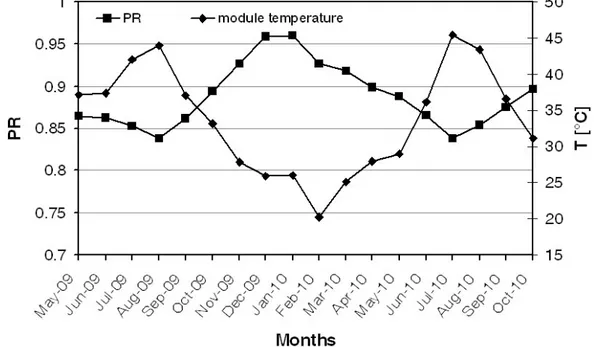
Figure 8: Monthly Performance Ratio (PR) calculated for the KC125 and monthly average module temperature.
The effect of degradation of amorphous silicon can be better seen from the monthly PR trend. Since the first exposure in April 2009 the EPV-50 has lost approximately 13% of PR in one year. It appears quite clear that for the first 4 months a degradation effect can be observed, while for the other months, till April 2010 a combined effect of seasonal variation and degradation can be considered. Both modules exhibit a typical seasonal effect due to their performance dependence on temperature and/or solar spectrum. It is well known that for poli-Si
high temperature reduces module production and this is the reason why the PR for KC125 is higher during the cold season than during the hot season (see Figure 8). Moreover, not significant degradation has been observed for this module that has been already tested in Lugano since the year 2006-07 [17]. On the contrary the amorphous silicon seems to respond better to higher temperatures with respect to poli-Si even if for the first 4 hot months of operation the typical degradation trend due to light exposure [18] can be observed. The amorphous silicon seasonal trend could be partly due to the seasonal temperature effect of annealing and partly due to seasonal variation of the solar spectrum that has been observed and also discussed by other authors [19], [20]. The summer period of 2010 contributed to partially recover the degradation due to light exposure. Table 2 summarizes the annual performances of the two modules tested together with their performances after 12 months and 18 months of operation. The PR uncertainty is in the order of ±5%. The measurement uncertainty of the STC power has not to be considered here. The main contribution to overall uncertainty is coming from the pyranometer irradiance measurements and in a smaller amount from the current and voltage measurements. The uncertainty on the Yield is the one referred to the measurements of the module power that from the MPPT specification is fixed to ±0.5%. From these considerations it can be concluded that the two PV modules present the same annual PR and that the double junction amorphous silicon module produced approximately 5% less energy than the poli-Si.
This is partly due to a failure of the EPV module during August 2009 and partly to the initial degradation of the module.
Table 2: Summary of the modules performances. PV module 12 months 18 months Y [kWh/kW] [%] η PR Y [kWh/kW] [%] η PR KC125GHT 1297 11.9 0.88 2030 11.8 0.88 EPV-50 1231 4.6 0.87 1939 4.6 0.86 Conclusions
An extensive monitoring campaign has been carried out on two photovoltaic modules of different technologies with the aim to better understand their behaviour in real operating conditions. It has to point out that the results obtained cannot be extended to every module of the considered technology since many differences can be encountered in terms of performance and energy production also among modules of the same technology but of different manufacturers. However some basic trends can be recognized in the tested devices. Poli-Si module has been proved to be highly stable and with an average annual PR of 0.88. A seasonal trend in the monthly PR has been observed due to the temperature effect on the module performance, these seasonal effects however compensate each other when the annual behaviour of the module is considered. The double junction amorphous silicon module shows an effect of degradation in the first months of operation and this effect is partially recovered during the hot months of 2010. Even if the monthly PR trend can be used to recognize the degradation, the PR on an annual basis is almost equal to the annual PR of poli-Si. From June 2010 the EPV-50 produced the same amount of energy per unit of nominal power as the KC125 (within 3%). Future research activity will be devoted to the determination of a correlation between solar spectrum and amorphous silicon performances, trying to quantify both the temperature and the spectrum contribution.
Acknowledgements
This work was supported by the Lazio Region within the frame of the Centre for Hybrid and Organic Solar Energy (CHOSE).
Nomenclature
A: Module surface area [m]
CR: Cloud Ratio
E: Energy produced by the module [Wh]
Gpoa: In plane irradiance [W/m2]
GSTC: Irradiance at Standard Test Conditions [W/m2] I: Irradiation [Wh/m2]
NOCT: Nominal Operating Cell Temperature [°C] NOST: Nominal Operating Specific Temperature [°C] Pmax: Electrical power at the maximum power point [W] Pnom: Nominal electrical power [W]
PR: Performance Ratio
T: Temperature [°C]
Y: Yield [kWh/kW]
Yr: Reference yield [h]
η: Module efficiency [%]
ηSTC: Module efficiency at Standard Test Conditions [%]
References
[1] Jardine C.N., G. J. Conibeer and K. Lane, 2001, “PV-COMPARE: Direct Comparison of Eleven PV Technologies at Two Locations in Northern and Southern Europe”, Proceedings of the 17th European Conference on Photovoltaic Solar Energy Conversion, Munich, 2001.
[2] Gottschalg R., J.A. del Cueto, T.R. Betts, D.G. Infield, 2005, “Seasonal performance of A-Si single and multi junction modules in two locations”, Proceedings of the 31st IEEE PV Specialists Conference, Buena Vista (FL), January, 3-7, 2005.
[3] Carr A.J., T.L. Pryor, 2004, “A comparison of the performance of different PV module types in temperate climates”, Solar Energy , vol. 76, pp. 285–294.
[4] Żdanowicz T., Rodziewicz T., Ząbkowska-Wacławek M., 2004 “Effectiveness of the sun tracking option during different insolation periods”, Proceedings of the 19th European Photovoltaic Solar Energy Conference, Paris, 2004.
[5] Longden D., L. Aitchison, R. Gottschalg, D.G. Infield, 2004, “Long-term performance of a CdTe array”, Proceedings of the19th European Photovoltaic Solar Energy Conference, Paris, 7-11 June 2004
[6] Żdanowicz T., Prorok M., Kołodenny W., Stellbogen D., Schaeffler R. R., 2005, “Evaluation of performance parameters of CIS modules using longterm outdoor monitoring data”, Proceedings of the 20th European Photovoltaic Solar Energy Conference, Barcelona, 2005.
[7] Chianese D., G. Friesen, P. Pasinelli, I. Pola, A. Realini, N. Cereghetti and A. Bernasconi, 2007, ”Direct Performance comparison of PV Modules”, Proceedings of 22nd EPVSEC, Milano, September, 2007.
[8] Betts T.R., T. Zdanowicz, M. Prorok, W. Kolodenny, H. de Moor, N. v.d. Borg, D. Stellbogen, J. Hohl-Ebinger, W. Warta, G. Friesen, D. Chianese, A. Guerin de Montgareuil, W. Herrmann, J. Diaz Berrade, J. Moracho, A.B. Cueli, A.R. Lagunas R, R. Gottschalg, 2006, “Photovoltaic Performance Measurements in Europe: PV-Catapult Round Robin Tests” IEEE 4th World Conference on Photovoltaic Energy Conversion, Waikoloa, Hawaii, May 7-‐12, 2006.
[9] Dunlop E. D. and D. Halton, 2006, “The Performance of Crystalline Silicon Photovoltaic Solar Modules after 22 Years of Continuous Outdoor Exposure, Prog. Photovolt: Res. Appl. Vol. 14, pp 53–64.
[10] Spena A., C. Cornaro, S. Serafini, 2008. “Outdoor ESTER Test Facility for Advanced Technologies PV Modules”. Proceedings of the 33rd IEEE PV Specialists Conference, San Diego (CA), May, 11-16, 2008.
[11] Spena A., C. Cornaro, G. Intreccialagli, D. Chianese, 2009. “Data Validation and Uncertainty Evaluation of the ESTER Outdoor Facility for Testing of PV Modules”, Proceedings of the 24th European Photovoltaic Solar Energy Conference and Exhibition, Hamburg, Germany, September 21-24, 2009.
[12] IEC 61215, 2005, “Crystalline silicon terrestrial photovoltaic (PV) modules – Design qualification and type approval”.
[13] IEC 60904-1, 1998, “Photovoltaic devices Part 1: Measurement of photovoltaic current-voltage characteristics”.
[14] Spena, A., C. Cornaro, P.G. Traini, 2008, “Noria Data Management Software for PV Modules Characterization in the Outdoor ESTER Test Facility”. Proceedings of the 23rd European Photovoltaic Solar Energy Conference and Exhibition, Valencia, September 1-5, 2008.
[15] IEC 60904-2, 2007. “Photovoltaic devices –Part 2: Requirements for reference solar devices”.
[16] Marion B. et al., 2005, “Performance Parameters for Grid-Connected PV systems”, Proceedings of the 31st IEEE Photovoltaics Specialists Conference, Lake Buena Vista, Florida, January 3-7, 2005.
[17] Cornaro C., Musella D., Chianese D., Friesen G., Dittmann S., 2010, “Outdoor PV module performance comparison at two different locations” Proceedings of the AMSE-ATI-UIT2010 Conference on Thermal and Environmental Issues in Energy Systems, 16 - 19 May 2010, Sorrento, Italy.
[18] Staebler, D. L.; Wronski, C. R.;, 1977, “Reversible conductivity changes in discharge -produced amorphous Si”, Applied Physics Letters, vol. 31, n. 4, pp. 292-294.
[19] Minemoto T., S. Nagae, H. Takakura, 2007, “Impact of spectral irradiance distribution and temperature on the outdoor performance of amorphous Si photovoltaic modules” Solar Energy
Materials & Solar Cells vol. 91, 919–923.
[20] Gottschalg R., T.R. Betts, D.G. Infield, M.J. Kearney, 2005, “The effect of spectral variations on the performance parameters of single and double junction amorphous silicon solar cells”, Solar Energy Materials & Solar Cells, vol. 85, 415–428.