Correspondencia: M.L Ballester-Palacios, Facultad de Medicina y Ciencias de la Salud, Departamento de Odontoestomatología, Feixa LLarga s/n, 08907 Hospitalet de Llobregat, Barcelona (Spain). E-mail: [email protected]
RESUMEN
Objetivo. El objetivo de este estudio fue determinar, el pH, la
conductividad y la solubilidad al someter el agregado trió-xido mineral (MTA) y el cemento Pórtland (CP) a diferentes irrigantes utilizados en endodoncia.
Material y Métodos. Se estudiaron un total de 210 muestras,
105 de cemento ProRoot MTA® blanco y 105 de CP blanco. Se
seleccionaron los siguientes irrigantes: hipoclorito sódico al 2,5% y al 5%, ácido cítrico al 10% y al 20%, clorhexidina al 2%, EDTA al 17%, y suero fisiológico como control. Se expusieron 15 muestras de MTA y 15 de CP a cada tipo de irrigante. Se midieron los resultados a 1, 5, 15, 30 y 60 minutos.
Resultados. La mayoría de cambios del pH y la conductividad
fueron de pequeña magnitud, aunque estadísticamente sig-nificativos. Destacan la alcalinización del suero fisiológico y la acidificación del hipoclorito sódico. Con MTA disminuye la conductividad en hipoclorito sódico y aumenta la con-ductividad en EDTA. Con CP hubo una mayor pérdida de conductividad del hipoclorito sódico y del ácido cítrico. To-das las muestras disminuyeron el peso considerablemente después de la exposición a cualquiera de los irrigantes, y en general ésta fue mayor para el CP que el MTA.
Conclusiones. El contacto del material de reparación con los
irrigantes utilizados habitualmente en endodoncia altera poco el pH y la conductividad pero aumenta marcadamen-te su solubilidad. Estos cambios afectan menos al MTA que al CP.
Palabras clave: Agregado trióxido mineral; cemento Portland; conductividad; irrigantes endodonticos pH; solubilidad.
ABSTRACT
Objective. The aim of this study was to determine changes to
pH, conductivity, and solubility when mineral trioxide aggre-gate (MTA) and Portland cement (PC) are exposed to different endodontic irrigants.
Methods. The study included a total of 210 samples, 105
white ProRoot MTA® cement and 105 white PC cement. The
following irrigants were tested: 2.5% and 5% sodium hypo-chlorite, 10% and 20% citric acid, 2% chlorhexidine, 17% ethylenediamine tetra-acetic acid (EDTA), and physiological serum as a control. Fifteen samples of each material were exposed to each irrigant. PH, conductivity, and solubility were measured at baseline and after 1, 5, 15, 30 and 60 minutes exposure to irrigants.
Results. Most changes in pH and conductivity were of small
magnitude, although statistically significant. For MTA and PC physical serum produced alkalinization, while sodium hypochlorite produced acidification. MTA lost conductivity when exposed to sodium hypochlorite but this increased with exposure to EDTA. PC underwent greater losses of conduc-tivity when exposed to sodium hypochlorite and citric acid. All samples decreased in weight significantly after exposure to any of the irrigants, and the loss was generally greater for PC than MTA.
Conclusions. When repair materials are exposed to the
irri-gants normally used in endodontics, pH levels and conducti-vity alter slightly, while solubility increases markedly. These effects were greater for PC than MTA.
Key words: Conductivity; Endodontic irrigants; Mineral trioxide aggregate; pH; Portland cement; Solubility.
Agregado trióxido mineral y cemento pórtland expuestos
a irrigantes endodóncicos: pH, conductividad y solubilidad
Mineral trioxide aggregate and portland cement exposed
to endodontic irrigants: pH, conductivity, and solubility
M.L. Ballester-Palacios
1, M Pons-Prat
2, I Bolíbar-Ribas
3, E Berástegui-Jimeno
41Profesora asociada de Endodoncia de la Universidad de Barcelona. Profesora del Máster de Endodoncia Clínica Avanzada y
Experimental de la Universidad de Barcelona. Colaboradora del equipo científico del Instituto de Investigación Biomédica de Bellvitge. 2Profesora asociada de Endodoncia de la Universidad de Barcelona. Profesora del Máster de Endodoncia Clínica Avanzada y
Experimental de la Universidad de Barcelona. 3Profesor asociado de Medicina Preventiva y Salud Pública de la Universidad Autónoma de Barcelona. Medico Adjunto del Servicio de Epidemiología Clínica y Salud Pública del Hospital de Sant Pau de Barcelona.
Miembro del Centro Cochrane Español. 4Profesora Titular de Endodoncia del Departamento de Odontoestomatología de la Universidad de Barcelona. Directora del Máster de Endodoncia Clínica Avanzada y Experimental de la Universidad de Barcelona. Investigadora del Instituto de Investigación Biomédica de Bellvitge.
Ballester-Palacios ML, Pons-Prat M, Bolíbar-Ribas I, Berástegui-Jimeno E. Mineral trioxide aggregate and portland cement exposed to endodontic irrigants: pH, conductivity, and solubility. Endodoncia 2018; 36:10-21
INTRODUCCIÓN
El agregado trióxido mineral (MTA) es un polvo que consiste en finas partículas hidrofílicas que fraguan en presencia de humedad. Su pH es de 12,5 y endurece a las cuatro horas de realizar la mezcla con agua destilada(1,2). La similitud del MTA con el cemento Portland (CP) se informó en el año 2000 por Estrela y cols.(3) que compara-ron MTA blanco con CP blanco y mostracompara-ron que los dos tipos de cemento tenían elementos constitutivos simila-res, excepto el óxido de bismuto en el MTA. Otros estudios obtuvieron resultados similares al comparar MTA con CP(4-7).Tanto MTA como el CP eran biocompatibles(8).
Las indicaciones clínicas fueron explicadas amplia-mente por Torabinejad y Chivian(9): recubrimiento pulpar, pulpotomías, obturación apical (retrógrada y ortógrada), reparación de perforaciones y de fracturas verticales. Posteriormente se han ido publicando más aportaciones como la obturación completa del conducto con MTA tras una reendodoncia, dens in dente, perforaciones apicales y
el tratamiento de fracturas horizontales(10-12).
En condiciones clínicas el material se coloca en el conducto radicular o cámara pulpar, donde un entorno ácido puede haber sido generado por las bacterias o la in-flamación. El pH bajo aparece como un factor importante que puede reducir la dureza y debilitar la ultraestructura de los materiales de reparación de la perforación(13-15). Un pH ácido puede inhibir el establecimiento de reac-ciones, afectar a la adhesión y aumentar la solubilidad de los materiales, puede causar la corrosión ácida en la que el hidróxido de calcio, el silicato cálcico hidratado (CSH), y el sulfoaluminato de calcio se descomponen para producir porosidades(16). La capacidad de sellado del material puede ser directa o indirectamente afectada por estos cambios físicos en los materiales(17). El pH bajo en el interior de los conductos también puede afectar la hidratación del MTA produciendo menor dureza super-ficial, más porosidad y menor adhesión a la dentina(18,19). La reparación temprana de las perforaciones de la furca y de las reabsorciones radiculares minimiza la contaminación bacteriana(20-22) y la irritación que pue-den causar los irrigantes en los tejidos periodontales(23). Después de la formación de la barrera de cemento el tratamiento endodóncico puede realizarse con diversos irrigantes para desinfectar el sistema de conductos
ra-INTRODUCTION
Mineral trioxide aggregate (MTA) is a powder con-sisting of fine hydrophilic particles that sets under wet conditions. Its pH is 12.5 and the material hardens within 4 hours after being mixed with distilled wáter(1,2).
In 2000, Estrela et al.(3) compared white MTA and
whi-te Portland cement (PC), showing that the two mawhi-terials have similar constituent elements, with the exception of bismuth oxide added to MTA. Other studies comparing MTA with PC have obtained similar results(4-7). Both MTA
and PC are biocompatible(8).
Torabinejad and Chivian have provided detailed in-formation about the clinical indications for the use of these materials(9), namely: pulp capping; pulpotomy; root
canal filling (retrograde and orthograde); perforation and vertical fracture repair. Subsequently, additional uses have been reported including endodontic retreatment, complete root canal filling, dens in dente, root perforation
repair and horizontal fracture repair(10-12).
Under clinical conditions, when a material is placed in the root canal or pulp chamber, it may be exposed to an acidic environment caused by bacteria or inflam-mation. Low pH would appear to be an important factor in reducing the repair material’s hardness and weakening its ultrastructure(13-15). An acidic pH can inhibit reactions,
affecting the material’s adhesion and increasing its solu-bility, or cause acid corrosion whereby calcium hydroxide, calcium silicate hydrate (CSH) and calcium sulfoalumina-te decompose producing porosities(16). The sealing capacity
of the material may be directly or indirectly affected by these physical changes(17). Low pH inside root canals can
affect MTA hydration causing decreased surface hardness, greater porosity and decreased adhesion to dentine(18,19).
Early repairing furcal perforations and root resorption minimizes bacterial contamination(20-22), and the irritation
of periodontal tissues can be caused by the use of endo-dontic irrigants(23). After establishing a cement barrier,
endodontic treatment involves diverse irrigants used to disinfect the root canal system, and chelators used to eliminate the smear layer. Although contact with irri-gants can alter the properties of cements(24), the effects
of these irrigant substances on the MTA surface in terms of possible corrosion and dissolution have hardly been investigated.
diculares y con quelantes para eliminar el barrillo den-tinario. El efecto de estas sustancias irrigadoras en la superficie del MTA en cuanto a corrosión y disolución del cemento se ha investigado escasamente. El contacto de los irrigantes con el cemento puede alterar las pro-piedades del mismo(24).
El objetivo del presente estudio in vitro es conocer aspectos del comportamiento del CP y del MTA blanco al exponerse a los irrigantes habitualmente usados en endodoncia. En concreto se describen los cambios en el pH, la conductividad y la solubilidad de los materiales.
MATERIAL Y MÉTODOS
Materiales y preparación de las muestras
Se realizó un estudio experimental con un total de 210 muestras de dos tipos de material: 105 muestras de ProRoot MTA® blanco, (Dentsply, Maillefer, Ballaigues, Suiza) y 105 muestras de CP blanco blanco (Cemex Es-paña BL II/B-LL 42, 5R UNE 80305, Madrid, EsEs-paña). Se expusieron a seis tipos de irrigación: hipoclorito sódico al 2,5% y 5%, ácido cítrico al 10% y 20%, clorhexidina al 2% y ácido etilendiaminotetraacético (EDTA) al 17%, con un grupo control expuesto a suero fisiológico. A cada tipo de irrigante se expusieron 15 muestras de MTA y 15 de CP.
El procedimiento de elaboración de las muestras fue el mismo para los dos tipos de cemento. Las muestras se realizaron usando como molde un tubo de silicona de 0,5 cm de altura por 2 mm de diámetro interno. Se mezclaron el polvo de los dos cementos del ProRoot MTA® y CP con agua destilada con proporción 1:3 tal y como indica el fabricante. Se introdujo el cemento en el tubo con ataca-dores de amalgama. Las muestras se dejaron fraguar 48 horas a temperatura ambiente. Posteriormente se pro-cedió al pulido de las superficies con disco diamantado montado en pieza de mano. Las muestras se numeraron e identificaron según los irrigantes correspondientes.
Determinación de pH, conductividad y solubilidad
En primer lugar se colocaron 15 ml de cada irrigante en un vial. Se puso un núcleo magnético para poder agi-tar durante la cinética. Se midió el pH con el pH-metro GLP 22 (Crison Instruments, S.A., Alella, España) y la con-ductividad en mS/cm con el Conductímetro EC-METER
The aim of this in vitro study was to determine the behavior of PC and white MTA when exposed to the irri-gants habitually used in endodontic treatment. In parti-cular the study evaluated changes to the materials’ pH levels, conductivity, and solubility.
MATERIAL AND METHODS
Materials and sample preparation
This in vitro experimental study used a total of 210
samples of two different endodontic repair materials: 105 samples of white ProRoot MTA® (Dentsply, Maillefer,
Ballaigues, Switzerland) and 105 samples of white Port-land cement (PC) (Cemex España BL II/B-LL 42, 5R UNE 80305, Madrid, Spain). The samples were immersed in six irrigants: 2.5%and 5% sodium hypochlorite, 10% and 20% citric acid, 2% chlorhexidine, 17% ethylenediamine tetra-acetic acid (EDTA), and physiological serum as a control. Fifteen MTA and 15 PC samples were exposed to each of the six irrigants.
Sample fabrication was carried out following the same procedure for both types of cement. The samples were cast using a silicon tube as a mold (0,5 cm in hei-ght, with an internal diameter of 2 mm). The ProRoot MTA® and PC powders were mixed with distilled water
in a proportion of 1:3 as indicated by the manufacturers. The cements were placed in the tube using amalgam pluggers. The samples were left to set for 48 hours at room temperature. Then, their surfaces were polished with a diamond disc (Diamond Scheibe nº 355, Edenta, Au, Switzerland) mounted in a hand-piece. The samples were numbered and grouped according to each corres-ponding irrigant.
Measuring pH, conductivity and solubility
Firstly, 15 ml of each irrigant were placed in vials. A magnetic stirrer was used to agitate the samples. PH was measured with the GLP 22 pH meter (Crison Instruments, S.A., Alella, Spain) and conductivity was registered in mS/ cm using the EC-METER BASIC 30 conductometer (Crison Instruments, S.A., Alella, Spain). Values were registered at baseline (time: t=0). Then the PC and MTA samples were placed in the irrigants with samples remaining submer-ged for different periods: 1, 5, 15, 30, and 60 minutes.
To calculate the samples’ solubility, the samples were weighed at baseline using an analytical precision balance calibrated from 0.001g to 110g (Mettler-Toledo GmbH, Greifensee, Switzerland). When pH and conductivity had been evaluated, the samples were washed in distilled wa-ter, drained, and dried at 105 ºC for 24 hours. The samples were weighed again calculating the difference in weight from baseline. The solubility formula presented by Gan-dolfi et al. in an earlier study(25) was used to calculate the
percentage of weight variation.
Statistical analysis
Descriptive analysis of changes in pH and conducti-vity at 1, 5, 15, 30 and 60 minutes were made comparing the data with baseline measurements. Solubility was eva-luated by changes in weight after 60 minutes exposure to the irrigants. Shapiro-Wilks and Kolmogorov-Smirnov tests were applied to check that data were distributed normally.
Analysis of changes over time (time 0-15 and 0-60 minutes) were performed with the Wilcoxon non-para-metric test for paired data. The Kruskal-Wallis test was applied to determine the presence of significant diffe-rences among the 14 sample groups. When the generic Kruskal-Wallis test identified statistical significance (p < 0.05), Tukey’s post hoc test was applied to determine which of the samples presented differences.
The non-parametric Mann Whitney test was used to identify differences between MTA and PC at each study time. Significance was established as p<0.05 for all analyses.
RESULTS
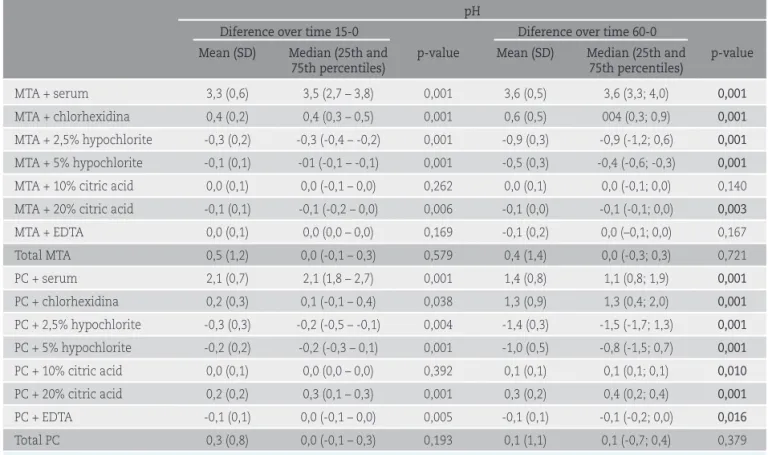
Baseline pH values of the irrigant solutions varied in acidy or alkalinity. Table 1 shows the pH changes obtai-ned. Even though most of the pH changes were statisti-cally significant, they were of small magnitude. For MTA, alkalinization with physiological serum was notable, as was acidification with sodium hypochlorite. PC samples underwent alkalinization with physiological serum and chlorhexidine, and acidification with sodium hypochlo-rite. When comparing pH changes between MTA and PC, the most notable changes were MTA’s greater alkalini-zation in physiological serum, and PC alkalinialkalini-zation in BASIC 30 (Crison Instruments, S.A., Alella, España). Se
registraron los valores correspondientes al tiempo t=0 minutos. A continuación se añadió la muestra y se midió el pH y la conductividad en la solución irrigante con la muestra sumergida en distintos tiempos: a 1, 5, 15, 30 y 60 minutos.
Para el cálculo de la solubilidad se pesaron previa-mente las muestras en una balanza analítica de preci-sión de 0,001 g a 11 0g (Mettler-Toledo GmbH, Greifensee, Suiza). Una vez acabado el estudio del pH y la conduc-tividad se lavaron las muestras con agua destilada. Se filtraron y se secaron las muestras a 105ºC durante 24 h. Se pesaron nuevamente las muestras y se calculó la diferencia de peso Se utilizó la fórmula de la solubilidad del estudio de Gandolfi y cols.(25) mediante el porcentaje de variación del peso.
Análisis estadístico
Se realizó un análisis descriptivo de la modificación en el minuto 1, 5, 15, 30 y 60 del pH y la conductividad respecto la situación basal. La solubilidad correspondió a los cambios de peso tras 60 minutos de exposición a los irrigantes. Previamente se realizó la prueba de Shapi-ro-Wilks y Kolmogorov-Smirnov para verificarse que las variables seguían una distribución no normal.
Para el análisis de los cambios temporales de las va-riables (tiempo 0-15 y 0-60) se utilizó el test no paramé-trico de Wilcoxon para datos apareados. Para determinar si había diferencias significativas entre los 14 tipos de muestras se realizó la prueba de Kruskal- Wallis. Cuando la prueba genérica de Kruskal-Wallis era significativa (p < 0,05), se realizó el test post hoc de Tukey para determinar entre qué muestras había diferencias.
Para determinar si habían diferencias entre las mues-tras de MTA y CP en cada tiempo del estudio se utilizó la prueba no paramétrica U de Mann-Whitney.
En todos los análisis se ha establecido el nivel de significación estadística (p<0,05).
RESULTADOS
El pH de la solución irrigante al inicio del estudio varió según la acidez o alcalinidad de la correspondiente disolución. En la Tabla 1 se describen los cambios del pH observados. Si bien la mayoría de cambios del pH
Tabla 1 Cambios del pH a los 15 y 60 minutos de exposición de las muestras de MTA y CP a los distintos tipos de irrigantes
pH
Diferencia tiempos 15-0 Diferencia tiempos 60-0
Media (DE) Mediana (P25-P75) p-valor Media (DE) Mediana (P25-P75) p-valor
MTA + suero 3,3 (0,6) 3,5 (2,7; 3,8) 0,001 3,6 (0,5) 3,6 (3,3; 4,0) 0,001 MTA + clorhexidina 0,4 (0,2) 0,4 (0,3; 0,5) 0,001 0,6 (0,5) 004 (0,3; 0,9) 0,001 MTA + hipoclorito NA 2,5% -0,3 (0,2) -0,3 (-0,4; -0,2) 0,001 -0,9 (0,3) -0,9 (-1,2; 0,6) 0,001 MTA + hipoclorito NA 5% -0,1 (0,1) -01 (-0,1; -0,1) 0,001 -0,5 (0,3) -0,4 (-0,6; -0,3) 0,001 MTA + ác cítrico 10% 0,0 (0,1) 0,0 (-0,1; 0,0) 0,262 0,0 (0,1) 0,0 (-0,1; 0,0) 0,140 MTA + ác cítrico 20% -0,1 (0,1) -0,1 (-0,2; 0,0) 0,006 -0,1 (0,0) -0,1 (-0,1; 0,0) 0,003 MTA + EDTA 0,0 (0,1) 0,0 (0,0; 0,0) 0,169 -0,1 (0,2) 0,0 (–0,1; 0,0) 0,167 Total MTA 0,5 (1,2) 0,0 (-0,1; 0,3) 0,579 0,4 (1,4) 0,0 (-0,3; 0,3) 0,721 CP + suero 2,1 (0,7) 2,1 (1,8; 2,7) 0,001 1,4 (0,8) 1,1 (0,8; 1,9) 0,001 CP + clorhexidina 0,2 (0,3) 0,1 (-0,1; 0,4) 0,038 1,3 (0,9) 1,3 (0,4; 2,0) 0,001 CP + hipoclorito NA 2,5% -0,3 (0,3) -0,2 (-0,5; -0,1) 0,004 -1,4 (0,3) -1,5 (-1,7; 1,3) 0,001 CP + hipoclorito NA 5% -0,2 (0,2) -0,2 (-0,3; 0,1) 0,001 -1,0 (0,5) -0,8 (-1,5; 0,7) 0,001 CP + ác cítrico 10% 0,0 (0,1) 0,0 (0,0; 0,0) 0,392 0,1 (0,1) 0,1 (0,1; 0,1) 0,010 CP + ác cítrico 20% 0,2 (0,2) 0,3 (0,1; 0,3) 0,001 0,3 (0,2) 0,4 (0,2; 0,4) 0,001 CP + EDTA -0,1 (0,1) 0,0 (-0,1; 0,0) 0,005 -0,1 (0,1) -0,1 (-0,2; 0,0) 0,016 Total CP 0,3 (0,8) 0,0 (-0,1; 0,3) 0,193 0,1 (1,1) 0,1 (-0,7; 0,4) 0,379
DE= desviación estándar, P25-P75= percentiles 25 y 75.
Table 1 Changes in pH after 15 and 60 minutes exposure of MTA and PC to different irrigants
pH
Diference over time 15-0 Diference over time 60-0 Mean (SD) Median (25th and
75th percentiles)
p-value Mean (SD) Median (25th and 75th percentiles) p-value MTA + serum 3,3 (0,6) 3,5 (2,7 – 3,8) 0,001 3,6 (0,5) 3,6 (3,3; 4,0) 0,001 MTA + chlorhexidina 0,4 (0,2) 0,4 (0,3 – 0,5) 0,001 0,6 (0,5) 004 (0,3; 0,9) 0,001 MTA + 2,5% hypochlorite -0,3 (0,2) -0,3 (-0,4 – -0,2) 0,001 -0,9 (0,3) -0,9 (-1,2; 0,6) 0,001 MTA + 5% hypochlorite -0,1 (0,1) -01 (-0,1 – -0,1) 0,001 -0,5 (0,3) -0,4 (-0,6; -0,3) 0,001 MTA + 10% citric acid 0,0 (0,1) 0,0 (-0,1 – 0,0) 0,262 0,0 (0,1) 0,0 (-0,1; 0,0) 0,140 MTA + 20% citric acid -0,1 (0,1) -0,1 (-0,2 – 0,0) 0,006 -0,1 (0,0) -0,1 (-0,1; 0,0) 0,003
MTA + EDTA 0,0 (0,1) 0,0 (0,0 – 0,0) 0,169 -0,1 (0,2) 0,0 (–0,1; 0,0) 0,167 Total MTA 0,5 (1,2) 0,0 (-0,1 – 0,3) 0,579 0,4 (1,4) 0,0 (-0,3; 0,3) 0,721 PC + serum 2,1 (0,7) 2,1 (1,8 – 2,7) 0,001 1,4 (0,8) 1,1 (0,8; 1,9) 0,001 PC + chlorhexidina 0,2 (0,3) 0,1 (-0,1 – 0,4) 0,038 1,3 (0,9) 1,3 (0,4; 2,0) 0,001 PC + 2,5% hypochlorite -0,3 (0,3) -0,2 (-0,5 – -0,1) 0,004 -1,4 (0,3) -1,5 (-1,7; 1,3) 0,001 PC + 5% hypochlorite -0,2 (0,2) -0,2 (-0,3 – 0,1) 0,001 -1,0 (0,5) -0,8 (-1,5; 0,7) 0,001 PC + 10% citric acid 0,0 (0,1) 0,0 (0,0 – 0,0) 0,392 0,1 (0,1) 0,1 (0,1; 0,1) 0,010 PC + 20% citric acid 0,2 (0,2) 0,3 (0,1 – 0,3) 0,001 0,3 (0,2) 0,4 (0,2; 0,4) 0,001 PC + EDTA -0,1 (0,1) 0,0 (-0,1 – 0,0) 0,005 -0,1 (0,1) -0,1 (-0,2; 0,0) 0,016 Total PC 0,3 (0,8) 0,0 (-0,1 – 0,3) 0,193 0,1 (1,1) 0,1 (-0,7; 0,4) 0,379
Tabla 2 Cambios de la conductividad a los 15 y 60 minutos de exposición de las muestras de MTA y CP a los distintos tipos de irrigantes en mS/cm
Conductividad
Diferencia tiempos 15-0 Diferencia tiempos 60-0
Media (DE) Mediana (P25-P75) p-valor Media (DE) Mediana (P25-P75) p-valor MTA + suero 0,01 (0,15) 0,02 (-0,06 – 0,09) 0,798 -0,09 (0,24) -0,07 (-0,21 – 0,06) 0,182 MTA + clorhexidina 0,04 (0,09) 0,02 (0,0 – 0,15) 0,041 0,11 (0,07) 0,15 (0,04 – 0,30) 0,001 MTA + hipoclorito NA 2,5% 0,52 (0,50) 0,40 (0,20 – 0,80) 0,004 -1,55 (5,87) -0,10 (-0,40 – 0,30) 0,659 MTA + hipoclorito NA 5% 0,26 (0,81) 0,40 (-0,20 – 0,80) 0,073 -1,00 (0,97) -1,00 (-1,20 – 0,50) 0,006 MTA + ác cítrico 10% -0,17 (0,06) -0,16 (-0,21 – -0,13) 0,001 -0,51 (0,13) -0,47 (-056 – -0,40) 0,001 MTA + ác cítrico 20% -0,12 (0,05) -0,11 (-0,14 – -0,09) 0,001 -0,33 (0,05) -0,33 (-0,36 – -0,28) 0,001 MTA + EDTA 0,15 (0,24) 0,20 (-0,10 – 0,30) 0,027 1,25 (0,72 1,10 (0,50 – 1,80) 0,001 Total MTA 0,10 (0,43) 0,00 (-0,13 – 0,22) 0,144 -0,30 (2,35) -0,20 (-0,44 – 0,17) 0,014 CP + suero 0,28 (0,24) 0,32 (0,12 – 0,46) 0,001 -0,02 (0,40) 0,00 (-0,26 – 0,23) 1,00 CP + clorhexidina 0,01 (0,01) 0,01 (0,00 – 0,001) 0,146 0,01 (0,03) 0,01 (-001 – 0,02) 0,118 CP + hipoclorito NA 2,5% -0,37 (1,04) -0,30 (-0,80 – -0,10) 0,26 -0,77 /0,89) -1,00 (-1,40 – 0,10) 0,018 CP + hipoclorito NA 5% 0,29 (1,32) -0,30 (-0,90 – 1,20) 0,509 -3,11 (4,83) -2,10 (-3,80 – -0,80) 0,003 CP + ác cítrico 10% -0,09 (0,14) -0,14 (-0,20 – 0,00) 0,026 -0,63 (0,18) -0,66 (-0,75 – -0,54) 0,001 CP + ác cítrico 20% -0,40 (0,09) -0,40 (-0,49 – -0,33) 0,001 -1,19 (0,21) -1,17 (-1,36 – 1,03) 0,001 CP + EDTA 0,34 (1,13) 0,01 (-0,02 – 0,20) 0,187 0,27 (1,21) 0,04 (-0,10 – 0,18) 0,495 Total CP 0,01 (0,80) -0,02 (-0,31 – -0,10) 0,072 -0,78 (2,15) -0,50 (-1,08 – 0,01) <0,001
DE= desviación estándar, P25-P75= percentiles 25 y 75.
Table 2 Changes in conductivity of MTA and PC after 15 and 60 minutes exposure to different irrigants
Conductivity
Diference over time 15-0 Diference over time 60-0 Mean (SD) Median (25th and
75th percentiles)
p-value Mean (SD) Median (25th and 75th percentiles) p-value MTA + serum 0,01 (0,15) 0,02 (-0,06; 0,09) 0,798 -0,09 (0,24) -0,07 (-0,21; 0,06) 0,182 MTA + chlorhexidina 0,04 (0,09) 0,02 (0,0; 0,15) 0,041 0,11 (0,07) 0,15 (0,04; 0,30) 0,001 MTA + 2,5% hypochlorite 0,52 (0,50) 0,40 (0,20; 0,80) 0,004 -1,55 (5,87) -0,10 (-0,40; 0,30) 0,659 MTA + 5% hypochlorite 0,26 (0,81) 0,40 (-0,20; 0,80) 0,073 -1,00 (0,97) -1,00 (-1,20; 0,50) 0,006 MTA + 10% citric acid -0,17 (0,06) -0,16 (-0,21; -0,13) 0,001 -0,51 (0,13) -0,47 (-056; -0,40) 0,001 MTA + 20% citric acid -0,12 (0,05) -0,11 (-0,14; -0,09) 0,001 -0,33 (0,05) -0,33 (-0,36; -0,28) 0,001 MTA + EDTA 0,15 (0,24) 0,20 (-0,10; 0,30) 0,027 1,25 (0,72 1,10 (0,50; 1,80) 0,001 Total MTA 0,10 (0,43) 0,00 (-0,13; 0,22) 0,144 -0,30 (2,35) -0,20 (-0,44; 0,17) 0,014 PC + serum 0,28 (0,24) 0,32 (0,12; 0,46) 0,001 -0,02 (0,40) 0,00 (-0,26; 0,23) 1,00 PC + chlorhexidina 0,01 (0,01) 0,01 (0,00; 0,001) 0,146 0,01 (0,03) 0,01 (-001; 0,02) 0,118 PC + 2,5% hypochlorite -0,37 (1,04) -0,30 (-0,80; -0,10) 0,26 -0,77 /0,89) -1,00 (-1,40; 0,10) 0,018 PC + 5% hypochlorite 0,29 (1,32) -0,30 (-0,90; 1,20) 0,509 -3,11 (4,83) -2,10 (-3,80; -0,80) 0,003 PC + 10% citric acid -0,09 (0,14) -0,14 (-0,20; 0,00) 0,026 -0,63 (0,18) -0,66 (-0,75; -0,54) 0,001 PC + 20% citric acid -0,40 (0,09) -0,40 (-0,49; -0,33) 0,001 -1,19 (0,21) -1,17 (-1,36; 1,03) 0,001 PC + EDTA 0,34 (1,13) 0,01 (-0,02; 0,20) 0,187 0,27 (1,21) 0,04 (-0,10; 0,18) 0,495 Total CP 0,01 (0,80) -0,02 (-0,31; -0,10) 0,072 -0,78 (2,15) -0,50 (-1,08; 0,01) <0,001
Tabla 3 Solubilidad o diferencia del peso después de 60 minutos de exposición de las muestras de MTA y CP a los distintos tipos de irrigantes.
Peso
Tiempo 0 Tiempo 60 Solubilidad
Media (DE) Mediana (P25-P75) Media (DE) Mediana (P25-P75) Media (DE) Mediana (P25-P75) p-valor MTA + suero 39,1 (3,0) 39,0 (38,0 – 41,0) 37,7 (3,0) 38,0 (36,0 – 40,0) -3,6 (2,3) -2,7 (-4,9; -2,4) 0,001 MTA + clorhexidina 39,1 (2,4) 39,0 (38,0 – 41,0) 36,8 (2,9) 37,0 (34,0 – 39,0) -5,8 (4,2) -5,1 (-10,5; -2,6) 0,001 MTA + hipoclorito NA 2,5% 38,0 (3,0) 39,0 (35,0 – 40,0) 35,9 (2,3) 35,0 (35,0 – 37,0) -5,4 (4,5) -5,0 (-8,1; -2,8) 0,002 MTA + hipoclorito NA 5% 39,5 (1,3) 39,0 (39,0 – 40,0) 37,6 (2,5) 38,0 (36,0 – 39,0) -4,9 (5,1) -2,6 (-10,0; 0,0) 0,007 MTA + ác cítrico 10% 39,2 (1,3) 39,0 (39,0 – 40,0) 33,8 (2,7) 34,0 (31,0 – 36,0) -13,8 (6,1) -12,8 (-18,0; -7,7) 0,001 MTA + ác cítrico 20% 39,6 (2,0) 39,0 (38,0 – 40,0) 38,1 (1,8) 38 (37,0 – 40,0) -3,8 (3,2) -2,6 (-6,8; 0,0) 0,003 MTA + EDTA 40,4 (1,4) 40,0 (40,0 – 40,0) 37,3 (2,4) 37,0 (36,0 – 39,0) -7,5 (5,9) -7,5 (-12,5; -7,1) 0,003 Total MTA 39,3 (2.2) 39,0 (38,0 – 40,0) 36,7 (2,8) 37,0 (35,0 – 39,0) -6,1 (5,6) -5,1 (-10,0; -2,6) < 0,001 CP + suero 32,7 (2,2) 33,0 (31,0 – 34,0) 30,7 (2,5) 31,0 (28,0 – 33,0) -5,9 (5,4) -3,2 (-9,7; -2,9) 0,001 CP + clorhexidina 30,6 (3,0) 31,0 (28,0 – 33,0) 29,1 (36) 31,0 (25,0 – 32,0) -5,0 (4,4) -6,1 (-8,8; 0,0) 0,006 CP + hipoclorito NA 2,5% 32,1 (2,7) 33,0 (30,0 – 33,0) 30,3 (3,2) 30,0 (29,0 – 32,0) -5,9 (4,7) -6,1 (-9,4; -2,9) 0,002 CP + hipoclorito NA 5% 31,5 (3,3) 32,0 (31,0 – 33,0) 29,6 (3,2) 30,0 (27,0 – 32,0) -6,1 (4,3) -4,6 (-8,8; -3,0) 0,001 CP + ác cítrico 10% 32,9 (2,1) 34,0 (31,0 – 34,0) 29,0 (1,8) 28,0 (28,0 – 30,0) -11,7 (6,7) -9,3 (-17,7; -6,5) 0,001 CP + ác cítrico 20% 32,8 (1,6) 32,0 (32,0 – 34,0) 20,8 (3,6) 21,0 (17,0 – 23,0) -36,4 (11,9) -34,4 (-47,1; 25,8) 0,001 CP + EDTA 29,5 (5,5) 31,0 (25,0 – 34,0) 26,1 (6,2) 26,0 (20,0 – 32,0) -12,2 (8,1) -9,1 (–20,0; 7,1) 0,001 Total CP 31,7 (3,3) 32,0 (31,0 – 34,0) 27,9 (4,8) 29,0 (25,5 – 31,5) -11,9 (12,5) -8,0 (-15,2; -3,2) <0,001
DE= desviación estándar, P25-P75= percentiles 25 y 75.
Table 3 Solubility/difference in weight after 60 minutes MTA and PC simple exposure to different irriants
Weight
Time 0 Time 60 Solubility
Mean (SD) Median (25th and
75th percentiles) Mean (SD) Median (25th and 75th percentiles) Mean (SD) Median (25th and 75th percentiles) p-value MTA + serum 39,1 (3,0) 39,0 (38,0 – 41,0) 37,7 (3,0) 38,0 (36,0 – 40,0) -3,6 (2,3) -2,7 (-4,9; -2,4) 0,001 MTA + chlorhexidina 39,1 (2,4) 39,0 (38,0 – 41,0) 36,8 (2,9) 37,0 (34,0 – 39,0) -5,8 (4,2) -5,1 (-10,5; -2,6) 0,001 MTA + 2,5% hypochlorite 38,0 (3,0) 39,0 (35,0 – 40,0) 35,9 (2,3) 35,0 (35,0 – 37,0) -5,4 (4,5) -5,0 (-8,1; -2,8) 0,002 MTA + 5% hypochlorite 39,5 (1,3) 39,0 (39,0 – 40,0) 37,6 (2,5) 38,0 (36,0 – 39,0) -4,9 (5,1) -2,6 (-10,0; 0,0) 0,007 MTA + 10% citric acid 39,2 (1,3) 39,0 (39,0 – 40,0) 33,8 (2,7) 34,0 (31,0 – 36,0) -13,8 (6,1) -12,8 (-18,0; -7,7) 0,001 MTA + 20% citric acid 39,6 (2,0) 39,0 (38,0 – 40,0) 38,1 (1,8) 38 (37,0 – 40,0) -3,8 (3,2) -2,6 (-6,8; 0,0) 0,003 MTA + EDTA 40,4 (1,4) 40,0 (40,0 – 40,0) 37,3 (2,4) 37,0 (36,0 – 39,0) -7,5 (5,9) -7,5 (-12,5; -7,1) 0,003 Total MTA 39,3 (2.2) 39,0 (38,0 – 40,0) 36,7 (2,8) 37,0 (35,0 – 39,0) -6,1 (5,6) -5,1 (-10,0; -2,6) < 0,001 PC + serum 32,7 (2,2) 33,0 (31,0 – 34,0) 30,7 (2,5) 31,0 (28,0 – 33,0) -5,9 (5,4) -3,2 (-9,7; -2,9) 0,001 PC + chlorhexidina 30,6 (3,0) 31,0 (28,0 – 33,0) 29,1 (36) 31,0 (25,0 – 32,0) -5,0 (4,4) -6,1 (-8,8; 0,0) 0,006 PC + 2,5% hypochlorite 32,1 (2,7) 33,0 (30,0 – 33,0) 30,3 (3,2) 30,0 (29,0 – 32,0) -5,9 (4,7) -6,1 (-9,4; -2,9) 0,002 PC + 5% hypochlorite 31,5 (3,3) 32,0 (31,0 – 33,0) 29,6 (3,2) 30,0 (27,0 – 32,0) -6,1 (4,3) -4,6 (-8,8; -3,0) 0,001 PC + 10% citric acid 32,9 (2,1) 34,0 (31,0 – 34,0) 29,0 (1,8) 28,0 (28,0 – 30,0) -11,7 (6,7) -9,3 (-17,7; -6,5) 0,001 PC + 20% citric acid 32,8 (1,6) 32,0 (32,0 – 34,0) 20,8 (3,6) 21,0 (17,0 – 23,0) -36,4 (11,9) -34,4 (-47,1; 25,8) 0,001 PC + EDTA 29,5 (5,5) 31,0 (25,0 – 34,0) 26,1 (6,2) 26,0 (20,0 – 32,0) -12,2 (8,1) -9,1 (–20,0; 7,1) 0,001 Total PC 31,7 (3,3) 32,0 (31,0 – 34,0) 27,9 (4,8) 29,0 (25,5 – 31,5) -11,9 (12,5) -8,0 (-15,2; -3,2) <0,001
fueron estadísticamente significativos, su magnitud fue pequeña. Con MTA destaca la alcalinización del suero fisiológico y la acidificación del hipoclorito sódico. Con CP destaca también la alcalinización del suero fisiológico así como de la clorhexidina, y la acidificación de hipoclo-rito sódico. Al comparar los cambios observados entre el MTA y el CP destaca una mayor alcalinización del suero fisiológico con MTA y de la clorhexidina con el CP, y una mayor acidificación del hipoclorito sódico con el CP.
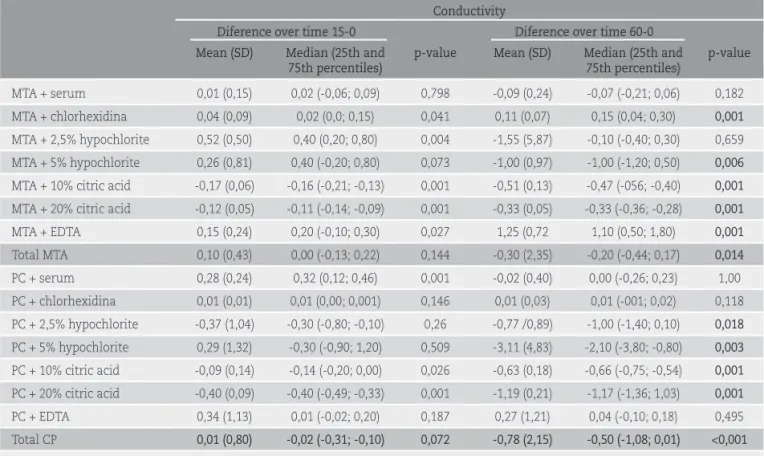
Los valores basales de la conductividad y los cambios observados a los 15 y 60 minutos se presentan en la Tabla 2 para los distintos tipos de irrigantes. La mayoría de cambios de conductividad observados también fueron estadísticamente significativos, mostrando una tendencia general a perder conductividad, aunque su magnitud fue pequeña. Con MTA destaca la perdida de conductividad del hipoclorito sódico, sobre todo en solución al 5% a los 60 minutos, y aumento de la conductividad del EDTA. Con CP también destaca la pérdida de conductividad del hipoclorito sódico a los 60 minutos, pero tanto de la solución al 5% como al 2,5%. Tras la exposición del CP al ácido cítrico la conductividad también disminuyó a los 60 minutos. Prácticamente no hubo cambios en la exposición del CP al EDTA. Al comparar los cambios ob-servados entre el MTA y el CP destaca una mayor pérdida de conductividad del CP con hipoclorito sódico al 2,5% y con ácido cítrico.
Respecto a la solubilidad todas las muestras dismi-nuyeron el peso considerablemente después de 60 minu-tos de exponerlas a los irrigantes (Tabla 3). Por orden de magnitud, el MTA mostró mayor solubilidad con el ácido cítrico al 10%, el EDTA, la clorhexidina y el hipoclorito sódico. El CP mostró mayor solubilidad con el ácido cítrico al 20% y al 10%, el EDTA, la clorhexidina y el hipoclorito sódico. Al comparar la solubilidad observada entre el MTA y el CP se comprobó que las muestras de CP, en gene-ral, tenían una solubilidad más elevada que las de MTA, independientemente del irrigante utilizado. Destacó la pérdida de peso mayor del CP que del MTA con el ácido cítrico al 20% (34,4 mg vs 2,6 mg respectivamente).
DISCUSIÓN
En este estudio in vitro se ha observado que los mate-riales de reparación modifican sus propiedades al
expo-chlorhexidine, and the greater PC acidification in sodium hypochlorite.
MTA lost conductivity after exposure to sodium hypochlorite, particularly with the 5% concentration at 60 minutes; after exposure to EDTA MTA conductivity increased.
PC lost conductivity when exposed to both concen-trations (2.5% and 5%) of sodium hypochlorite for 60 minutes. After PC exposure to citric acid, conductivity decreased after 60 minutes. PC exposed to EDTA showed almost no change. Comparing the changes in conductivi-ty between MTA and PC, the most noticeable differences were the greater loss with PC exposure to 2.5% sodium hypochlorite and to citric acid.
As for the solubility of the materials, all samples underwent considerable decreases in weight after 60 minutes exposure to all irrigants. (Table 3) Comparing solubility between MTA and PC, it was shown that PC ge-nerally underwent greater solubility than MTA, regardless of the irrigant to which they were exposed. Of particular note, it was seen that PC underwent considerably more weight loss than MTA in 20% citric acid (34.4 mg vs. 2.6 mg respectively). MTA showed its greatest solubility in 10% citric acid, followed by EDTA, chlorhexidine, and sodium hypochlorite.
DISCUSSION
This in vitro study found that repair materials under-go modification when exposed to the irrigant solutions normally used in endodontic treatments. When we were repairing furcation perforations and root resorptions with MTA and subsequently we use different irrigants solu-tions, these can cause changes in the cement and it is clinically relevant to know what these changes are at the physico-chemical level.
Changes to pH levels and conductivity were found to be relatively minor but the results showed a considerable increase in the solubility of the materials tested. In gene-ral, MTA was seen to be a more stable material than PC.
Regarding pH alterations, the biggest change was the alkalinization of acidic pH when MTA, and even more so PC, were exposed to physiological serum. When MTA comes into contact with water, calcium hydroxide disso-ciates into Ca2+ and OH– ions produce an increase in the
nerse a las soluciones irrigantes usadas habitualmente en endodoncia. Cuando reparamos perforaciones de la furca y reabsorciones radiculares con MTA y posterior-mente utilizamos distintas soluciones irrigantes, éstas pueden causar cambios en el cemento y tiene relevan-cia clínica conocer cuales son estos cambios a nivel fí-sico-químico.
Los cambios en el pH y la conductividad fueron rela-tivamente pequeños y se constató un aumento notable de la solubilidad de los materiales. En general, el MTA mostró un comportamiento más estable que el CP.
En relación al cambio del pH, la alteración más im-portante consistió en una alcalinización del pH ácido del suero fisiológico expuesto al MTA y sobre todo al CP. Cuando el cemento de MTA entra en contacto con agua la disociación del hidróxido de calcio en Ca2+ y iones OH– produce un aumento del pH del medio(26,27). Estos resultados son parecidos a los aportados por Heward y Sedgley(28), que hallaron valores de pH 9 a las 3 horas. Igualmente, Hansen y cols.(29) detectaron valores de pH de 9,0 a los 20 minutos y 9,2 a las tres horas. Los resul-tados de Heward y Sedgley y Hansen y cols. se basaron en en raíces de dientes naturales y el microelectrodo de calibración estaba en el interior de la raíz. Nuestros resultados también se corresponden con los hallados por Duarte y cols.(30) que utilizaron un molde similar al nuestro. De forma parecida, Bortoluzzi y cols.(31) dejaron fraguar las muestras y posteriormente las sumergieron en agua desionizada. Su pH inicial fue de 9,7 para MTA y 9,6 para PC, y a las 24 horas fue de 11,0 y 11,1 respec-tivamente.
Los cambios en la conductividad observados consis-tieron en una pequeña tendencia a perder conductividad que fue algo más marcada en el CP que el MTA. Santos y cols.(26) estudiaron la conductividad del MTA, median-te una solución de agua desionizada (10 ml). Hallaron unos valores de conductividad de 170,9 mS/cm a las 24 horas con un gran aumento de la conductividad en los periodos iniciales para disminuir a partir de las 24 h. Los resultados en la conductividad obtenidos por Gonçal-ves y cols.(32) son parecidos a los del presente estudio en suero fisiológico, aunque ellos sin embargo utilizaron como solución agua destilada. y sus resultados fueron a las 3 horas 11,5 mS/cm para CP y ProRoot MTA, y a las 24 horas 16,03 mS/cm y 13,88 mS/cm respectivamente.
pH of the médium(26,27). These results are similar to those
obtained by Heward and Sedgley(28), who registered pH
values of 9 after 3 hours exposure. Likewise, Hansen et al.(29) placed calibrated microelectrodes inside the roots of
natural teeth, detecting pH values of 9.0 after 20 minutes and 9.2 after 3 hours. The present results also concur with those of Duarte el al.(30) that used a mold similar to
ours. Bortoluzzi et al.(31) who left samples to set and then
submerged them in deionized water. The initial pH was 9.7 for MTA and 9.6 for PC, and after 24 hours pH values were 11.0 and 11.1 respectively.
The changes in conductivity obtained showed a minor tendency to loss of conductivity that was more marked among PC samples than MTA. Santos et al.(26)
studied the conductivity of MTA by means of a deio-nized water solution (10 ml). They found conductivity values of 170.9 mS/cm after 24 hours with a major in-crease in conductivity beyond the 24-hour mark. Con-ductivity results obtained by Gonçalves et al.(32) were
similar to the present study for physiological serum, although these authors used distilled water as a so-lution; for they obtained 11.5 mS/cm after 3 hours for both PC and ProRoot MTA, and after 24 hours 16.03 mS/ cm and 13.88 mS/cm respectively. Berástegui et al.(33)
also evaluated and compared the conductivity of an experimental Portland cement and a modified Portland cement (C.P.M.®, Egeo SRL MTM, Buenos Aires,
Argenti-na) but over longer periods.
In the present study, MTA and PC decreased in weight considerably after exposure to all of the irrigants investi-gated. The high solubility of these endodontic materials can bring about their disintegration, endangering the seal between the material and the dental structure(34). Chiang
and Ding(35) concluded that the degradation of cement
is a slow process, and that the degree of solubility was both time- and pH-dependent. Other authors such as Shie et al.(36) reported that ProRootMTA® at pH 4 lost 2.2% of
its weight, while at pH 7 it lost 1.4% over 7 days. These data coincide with Saghiri et al.(16), who found that white
ProRoot MTA® samples exposed to an acidic pH showed
greater solubility in comparison with other pH values (7 and 10.4). In agreement with these findings, the present study observed greater solubility with the more acidic irrigants, namely, 20% citric acid and EDTA. However, the present study observed one exception to this pattern of
Berástegui y cols.(33) también determinaron y compararon la conductividad de un cemento Pórtland experimental (CP) con un cemento Portland Modificado (C.P.M.®, Egeo SRL MTM, Buenos Aires, Argentina) pero en periodos de tiempo más largos.
Nuestras muestras de MTA y CP disminuyeron el peso considerablemente después de la exposición a cualquiera de los irrigantes estudiados. La alta solubilidad de los materiales de endodoncia puede causar la desintegración de los materiales, lo que favorece la falta de sellado entre ellos y la estructura dental(34). Chiang y Ding(35) concluye-ron que la degradación del cemento era un proceso lento, y el grado de solubilidad era tiempo y pH dependiente. Otros autores como Shie y cols.(36) describieron que el ProRootMTA® a pH 4 perdía un 2,2% y a pH 7 el 1,4% en siete días. Estos datos coinciden con los resultados de Saghiri y cols.(16), en los que las muestras de ProRoot MTA® blanco expuesto a pH ácido mostraron mayor solubilidad en comparación con los otros dos valores de pH (7 y 10,4). En concordancia con ello, la mayor solubilidad observada en nuestro estudio se produjo en los irrigantes con pH más ácido, es decir el ácido cítrico y el EDTA. No obstante, obtuvimos una excepción a este comportamiento, que fue la pequeña pérdida de peso del MTA en contacto con el ácido cítrico al 20%. Según Parirokh y Torabinejad(37) el método de estudio de la solubilidad que se utiliza de forma estándar tiene limitaciones que pueden influen-ciar los resultados. Así, las partículas del material de reparación podrían desprenderse del cemento durante el almacenamiento y el secado de las muestras. Ello podría explicar el resultado obtenido en nuestro estudio en que paradójicamente las muestras de MTA sumergidas en ácido cítrico al 10% mostraron más solubilidad que las sumergidas en ácido cítrico al 20%.
Vivan y cols.(38) obtuvieron unos resultados de solubi-lidad parecidos a los nuestros con MTA Angelus® blan-co inmerso en agua destilada durante el fraguado. Otro estudio que también determinó la solubilidad en agua destilada de MTA Angelus® blanco fue el de Silva y cols. (34) en que hallaron unos valores de 2,5% de solubilidad, mientras que en nuestro estudio fue de 2,7%.
Recientemente se ha estudiado la interacción entre los cementos de MTA y los irrigantes endodóncicos en cuanto al cambio de coloración del cemento y las impli-caciones estéticas que puede conllevar(39).
behavior, which was the minor loss undergone by MTA in contact with 20% citric acid. According to Parirokh and Torabinejad(37), the standard method for assessing
solubility suffers limitations that can skew the results, in that the materials’ particles can detach from the cement during storage and sample setting. This could explain this result, whereby, paradoxically, MTA submerged in 10% citric result showed greater solubility than when submerged in 20% citric acid.
Vivan et al.(38) obtained similar solubility results to
the present study with white MTA Angelus® immersed
in distilled water during setting. Silva et al.(34) also
de-termined the solubility of MTA in distilled water, fin-ding a value of 2.5% solubility, while the present study obtained 2.7%.
In another recent study, the interaction between MTA cements and endodontic irrigants have been investigated in terms of changes to the color of the cement, and the aesthetic implications of this alteration(39).
Newly developed MTA cements continue to appear on the market, and so further studies will be required to evaluate the effects of irrigants on these new endodontic materials.
CONCLUSIONS
ProRoot MTA® reached higher pH values than PC
when exposed to physiological serum after 15 and 60 minutes. The material also reached higher conducti-vity levels than PC, which were maintained over time with statistically significant changes from baseline to 15 minutes and 60 minutes. The solubility of PC was greater than that of ProRoot MTA® regardless of the
irrigant used. ProRoot MTA underwent less change than PC when exposed to the irrigants normally used in endodontic treatments. Given that newly developed MTA cements are being introduced, further studies will be necessary to assess the effects of irrigants on these new cements.
ACKNOWLEDGEMENTS
The authors thank Dr. Mónica Martínez López of the Department of Material Engineering at the University of Barcelona for her technical assistance.
Se están fabricando nuevos cementos de MTA, serán necesarios más estudios para valorar la importancia de la acción de los irrigantes sobre esos cementos.
CONCLUSIONES
ProRoot MTA alcanzó unos valores más altos de pH que en el CP tratado con suero fisiológico a los 15 y a los 60 minutos. También alcanzó niveles más altos de conductividad que el CP y se mantuvo en el tiempo con resultados estadísticamente significativos tanto en el periodo de 0 a 15 minutos como a los 60 minutos. La so-lubilidad de CP fue más elevada que la del ProRoot MTA® independientemente del irrigante utilizado. Por tanto el ProRoot MTA® cambió menos que el CP en contacto con los irrigantes usados habitualmente en endodoncia. Dado que se están fabricando nuevos cementos de MTA, serán necesarios más estudios para valorar la importancia de la acción de los irrigantes sobre esos cementos.
AGRADECIMIENTOS
Los autores agradecen a la Dra. Mónica Martínez López del departamento de Ingeniería de Materiales de la Universidad de Barcelona su asistencia técnica.
REFERENCIAS
1. Torabinejad M, Watson TF, Pitt Ford TR. Sealing ability of a mineral trioxide aggregate when used as a root end filling material. J Endod. 1993;19:591–5.
2. Torabinejad M, Hong CU, McDonald F, Pitt Ford TR. Physical and chemical properties of a new root-end filling material. J Endod. 1995;21:349–53.
3. Estrela C, Bammann LL, Estrela CR, Silva RS, Pécora JD. Antimicrobial and chemical study of MTA, Portland cement, calcium hydroxide paste, Sealapex and Dycal. Braz Dent J. 2000;11:3–9.
4. Funteas UR, Wallace JA, Fochtman EW. A comparative analysis of Mineral Trioxide Aggregate and Portland cement. Aust Endod J. 2003;29:43–4.
5. Asgary S, Parirokh M, Eghbal MJ, Brink F. A Comparative study of white mineral trioxide aggregate and white Portland cements using X-ray microanalysis. Aust Endod J. 2004;30:89–92.
6. Oliveira MG de, Xavier CB, Demarco FF, Pinheiro ALB, Costa AT, Pozza DH. Comparative chemical study of MTA and portland cements. Braz Dent J. 2007;18:3–7.
7. Camilleri J. Hydration mechanisms of mineral trioxide aggregate. Int Endod J. 2007;40:462–70.
8. Saidon J, He J, Zhu Q, Safavi K, Spångberg LSW. Cell and tissue reac-tions to mineral trioxide aggregate and Portland cement. Oral Surg Oral Med Oral Pathol Oral Radiol Endod. 2003;95:483–9.
9. Torabinejad M, Chivian N. Clinical applications of mineral trioxide aggregate. J Endod. 1999;25:197–205.
10. Darvell BW, Wu RCT. “MTA”-an Hydraulic Silicate Cement: review update and setting reaction. Dent Mater. 2011;27:407–22. 11. Bogen G, Kuttler S. Mineral trioxide aggregate obturation: A review
and case series. J Endod. 2009;35:777–90.
12. Yildirim T, Genço lu N. Use of mineral trioxide aggregate in the treat-ment of horizontal root fractures with a 5-year follow-up: report of a case. J Endod. 2009;35:292–5.
13. Namazikhah MS, Nekoofar MH, Sheykhrezae MS, Salariyeh S, Hayes SJ, Bryant ST, et al. The effect of pH on surface hardness and microstructure of mineral trioxide aggregate. Int Endod J. 2008;41:108–16.
14. Fridland M, Rosado R. Mineral Trioxide Aggregate (MTA) Solubi-lity and porosity with different water-to-powder ratios. J Endod. 2003;29:814–7.
15. Lee Y. Effects of physiological environments on the hydration be-havior of mineral trioxide aggregate. Biomaterials. 2004;25:787–93. 16. Saghiri M, Sheibani N, Asatourian A, Garcia-Godoy F, Gutmann J, Lotfi M, et al. The effect of pH on solubility of nano-modified endodontic cements. J Conserv Dent. 2014;17:13-7.
17. Roy CO, Jeansonne BG, Gerrets TF. Effect of an acid environment on leakage of root-end filling materials. J Endod. 2001;27:7–8. 18. Saghiri MA, Lotfi M, Saghiri AM, Vosoughhosseini S, Aeinehchi M,
Ranjkesh B. Scanning electron micrograph and surface hardness of mineral trioxide aggregate in the presence of alkaline pH. J Endod. 2009;35:706–10.
19. Saghiri MA, Shokouhinejad N, Lotfi M, Aminsobhani M, Saghiri AM. Push-out bond strength of mineral trioxide aggregate in the pre-sence of alkaline pH. J Endod. 2010;36:1856–9.
20. Pace R, Giuliani V, Pagavino G. Mineral trioxide aggregate as repair material for furcal perforation: case series. J Endod. 2008;34:1130–3.
21. Mente J, Hage N, Pfefferle T, Koch MJ, Geletneky B, Dreyhaupt J, et al. Treatment outcome of mineral trioxide aggregate: repair of root perforations. J Endod. 2010;36:208–13.
22. Mente J, Leo M, Panagidis D, Saure D, Pfefferle T. Treatment outcome of mineral trioxide aggregate: repair of root perforations-long-term results. J Endod. 2014;40:790–6.
23. Uyanik MO, Nagas E, Sahin C, Dagli F, Cehreli ZC. Effects of different irri-gation regimens on the sealing properties of repaired furcal perforations. Oral Surgery, Oral Med Oral Pathol Oral Radiol Endod. 2009;107:e91–5. 24. Aggarwal V, Jain A, Kabi D. In vitro evaluation of effect of various endodontic solutions on selected physical properties of white mi-neral trioxide aggregate. Aust Endod J. 2011;37:61–4.
25. Gandolfi MG, Taddei P, Siboni F, Modena E, Ciapetti G, Prati C. Deve-lopment of the foremost light-curable calcium-silicate MTA cement as root-end in oral surgery. Chemical-physical properties, bioactivity and biological behavior. Dent Mater. 2011;27:e134–57.
26 Santos AD, Moraes JC, Araújo EB, Yukimitu K, Valério Filho WV. Phy-sico-chemical properties of MTA and a novel experimental cement. Int Endod J. 2005;38:443–7.
27. Camilleri J. Characterization and hydration kinetics of trical-cium silicate cement for use as a dental biomaterial. Dent Mater. 2011;27:836–44.
28. Heward S, Sedgley CM. Effects of intracanal mineral trioxide aggre-gate and calcium hydroxide during four weeks on pH changes in simulated root surface resorption defects: an in vitro study using matched pairs of human teeth. J Endod. 2011;37:40–4.
29. Hansen SW, Marshall JG, Sedgley CM. Comparison of intracanal EndoSequence Root Repair Material and ProRoot MTA to induce pH changes in simulated root resorption defects over 4 weeks in matched pairs of human teeth. J Endod. 2011;37:502–6.
30. Duarte MAH, Demarchi ACC de O, Yamashita JC, Kuga MC, Fraga S de C. pH and calcium ion release of 2 root-end filling materials. Oral Surg Oral Med Oral Pathol Oral Radiol Endod. 2003; 95:345–7.
31. Bortoluzzi EA, Broon NJ, Bramante CM, Felippe WT, Tanomaru Filho M, Esberard RM. The influence of calcium chloride on the setting time, solubility, disintegration, and pH of mineral trioxide aggregate and white Portland cement with a radiopacifier. J Endod. 2009;35:550–4.
32. Gonçalves JL, Viapiana R, Miranda CES, Borges ÁH, Cruz Filho AM da. Evaluation of physico-chemical properties of Portland cements and MTA. Braz Oral Res. 2010;24:277–83.
33. Berástegui E, Valmaseda-Castellón E, Faus V, Ballester M-L, Beri-ni-Aytés L. Study of two MTA cements. Med Oral Patol Oral Cir Bucal.2014;19:e634–8.
34 Silva EJNL, Herrera DR, Rosa TP, Duque TM, Jacinto RC, Gomes BPF de A, et al. Evaluation of cytotoxicity, antimicrobial activity and physicochemical properties of a calcium aluminate-based endo-dontic material. J Appl Oral Sci. 2008;22:61–7.
35. Chiang TY, Ding SJ. Physicochemical properties of radiopaque di-calcium silicate cement as a root-end filling material in an acidic environment. Int Endod J. 2013;46:234–41.
36. Shie M-Y, Huang T-H, Kao C-T, Huang C-H, Ding S-J. The Effect of a physiologic solution pH on properties of white mineral trioxide aggregate. J Endod. 2009;35:98–101.
37. Torabinejad M, Parirokh M. Mineral Trioxide Aggregate: A Compre-hensive literature review—Part II: Leakage and biocompatibility investigations. J Endod. 2010;36:190–202.
38. Vivan RR, Zapata RO, Zeferino MA, Bramante CM, Bernardineli N, Garcia RB, et al. Evaluation of the physical and chemical proper-ties of two commercial and three experimental root-end filling materials. Oral Surg Oral Med Oral Pathol Oral Radiol Endod. 2010;110:250–6.
39. Keskin C, Demiryurek EO, Ozyurek T. Color stabilities of calcium si-licate-based materials in contact with different irrigation solutions. J Endod. 2015;41:409-11.