1
Title: An empirical analysis on the curvilinear relationship between
slack and firm performance
Authors:
Josep Mª Argilés-Bosch
Universitat de Barcelona (Departament d’Empresa) Josep Garcia-Blandón*
IQS, (Faculty of Economics) Diego Ravenda
Toulouse Business School (Department of Management Control, Accounting and Auditing)
Mónica Martínez-Blasco***
IQS, (Faculty of Economics)
Address for correspondence:
Josep Mª. Argilés. Department of Accounting. Facultat d’Econòmiques i Empresarials. Universitat de Barcelona. Av. Diagonal, 696. 08034 Barcelona. Spain. Phone: 00 34 93 4039985
00 34 93 4021957 Fax. 00 34 93 4029099 e-mail address: [email protected] * e-mail address: [email protected] ** e-mail address:[email protected] *** e-mail address: [email protected]
2
An empirical analysis of the curvilinear relationship between slack and
firm performance
Abstract
This study performs an in-depth analysis of the curvilinear relationship between slack and future firm performance. Using a sample of US firms, we analyze the influence of three indicators of absorbed and unabsorbed slack on the two commonest dimensions of firm performance: profitability and sales growth. Although the relationship between most slack variables and firm performance is curvilinear, the inflection points (for both maximums and minimums) lie mainly outside the distribution range of the slack variables and, consequently, the curvilinear relationships between slack and performance are, in fact, neither U-shaped nor inverted U-shaped. Therefore, the influence of slack on performance can be positive or negative: linear for certain variables, but concave/convex for most variables analyzed in our study. An additional important finding is that the influence of slack on future profitability is usually the opposite of its influence on future sales growth: negative and positive, respectively, for absorbed slack; positive and negative, respectively, for financial slack. Results are robust to different lagged periods of the independent variables. The effects of equity and cash slacks on future performance are mainly negative, especially for longer time periods.
Keywords: profitability, sales growth, slack, non-linear relationship, absorbed slack, unabsorbed slack.
3
1 Introduction
Cyert and March (1956, p. 52) defined slack as a pool of excess resources that helps firms to adjust to unexpected fluctuations. Similarly, Bourgeois (1981) stated that slack is a cushion of actual and potential resources that firms can use to adapt to internal and external pressures, counteract threats and exploit opportunities. Slack resources, as such, provide protection against unfavorable events, like an economic downturn (Zona, 2012). One line of empirical research with regard to this issue analyzes the influence of different measures of slack on firm profitability, as is apparent in the review conducted by Daniel et al. (2004). These authors conclude that extant empirical research finds different effects of slack on firm performance. The literature on slack, however, holds that firms need surplus resources to build the necessary capacities to achieve an advantageous competitive position, as well as to avoid waste and maintain a favorable financial performance.
While firm performance has many dimensions, empirical research on slack has tended to focus on a sole dimension of performance, typically profitability. Given that profitability and growth can be deemed different, if not even opposite and conflicting, dimensions of performance and strategic objectives (e.g. Peteraf and Barney, 2003; Markman and Gratner, 2002; Armstrong and Green, 2007), the absence of analysis of the influence of slack on the two is a remarkable deficiency in the extant literature.
Some studies (Bromiley, 1991; Tan and Peng, 2003; Tan, 2003; George, 2005; Chiu and Liaw, 2009; Modi and Mishra, 2011; Tan and Wang, 2010) have tested the curvilinear relationship between slack and performance. And where they found significant coefficients for the slack variables and their squared terms, they concluded in favor of the existence of U-shaped or inverted U-shaped relationships (mainly the latter) and, therefore, of optimal points. Bradley et al. (2011a) observed concave and convex relationships, but these authors focused more closely on interactions of slack with munificence and dynamism and did not perform in-depth analyses of squared terms of slack. Salge and Vera (2013) found no significant coefficient for the squared slack variable and, consequently, could find no support for the hypothesis of an inverted U-shaped relationship. However, apart from a significant sign for the coefficient of the squared variable, additional conditions are required. The maximum or minimum points should lie within the data range of the variable, and not too close to an endpoint of the data range, and tests should be performed for the slopes of the lower and upper bounds of
4
the variable’s range (Lind and Mehlum, 2010). These authors review a number of studies published in leading economics journals, concluding that they do not use adequate procedures when testing for the presence of a U-shape, or inverted U-shape but, generally, report only the significance of the quadratic term, which is potentially misleading.
To our knowledge, no previous study has performed such an in-depth analysis of the existence of U-shaped or inverted U-shaped relationships between slack and performance. Hence, there are no reliable conclusions regarding precise levels of attainable and affordable slack leading to either maximum or minimum future performance, in the extant business literature. The identification of an optimal level of slack would provide valuable knowledge for both academics and practitioners, and would be an invaluable mechanism for improving firm efficiency and resource use. Managers would have a straightforward and clear means for attaining their targets, and academics would be able to cast light on the appropriate determinants and the most efficient ways of attaining them. It is of interest to both practitioner and academic to investigate the dilemma of the existence of a desirable level of slack and/or a positive/negative relationship between that level and performance. As researchers commonly mimic previous procedures, it is important to call into question any conclusions hastily drawn from estimates of quadratic terms. An inappropriate assessment of the existence of critical thresholds of slack may provide misleading guidance for managers, investors and other classes of practitioner and stakeholder, as well as forming a groundless foundation upon which to build knowledge on this matter.
This study contributes in-depth analyses of the curvilinear relationships between a wide array of slack variables and two different performance dimensions: profitability and growth. It provides evidence of the fact that the lack of rigorous analysis of these relationships may lead to misleading conclusions in business research; more precisely, it shows that there are no plausible levels of slack facilitating maximum or minimum performance. It also contributes to the few existing studies on the influence of slack on sales growth. Finally, to our knowledge, it is the first empirical research to analyze, in a single study, the influence of slack on two different dimensions of firm performance, namely profitability and sales growth, dimensions that are usually considered to be conflicting strategic choices. In this respect, we contribute evidence of opposing influences of slack on profitability and growth to existing research.
We report the existence of curvilinear relationships between most of the slack measures analyzed and future performance, but the corresponding maximum or minimum
5
points lie outside the distribution range of the slack variables. We show that simply reporting the significant sign of the squared slack variable, as has been frequent in the literature, is misleading when assessing the existence of U-shaped or inverted U-shaped relationships. According to our evidence, the influence of slack on performance can be positive or negative, depending on the type of slack and performance. There are no attainable maximum or minimum points of performance. We find opposing influences of absorbed slack on profitability and sales growth: negative on the former and positive on the latter. While increasing levels of absorbed slack are associated with lower levels of future profitability, and with higher levels of sales growth. These results are robust to different forward periods considered. With respect to unabsorbed slack, the influence of financial slack is positive on profitability and negative on sales growth. The influences of equity and cash slacks on performance are mainly negative. Most of the results reported are also robust to different forward periods considered for slack.
The rest of the article is organized as follows: the next section explains the research background, we then describe the research design and sample characteristics, and present our results. We end with a discussion and our concluding remarks.
2 Theoretical background
Methodologies, approaches and results vary considerably across the studies included in the meta-analysis conducted by Daniel et al. (2004) of the influence of slack on firm performance, as they do across more recent studies – see Table 1 for a summary.
--- Insert Table 1 approximately here ---
Yet, while firm performance is multi-dimensional, almost all empirical studies of the effects of slack on it focus on a sole dimension. Moreover, some studies analyze the influence of slack on somewhat unusual performance measures, built from responses to questionnaires. For instance, Voss et al. (2008) analyze the effects on product exploration and exploitation, Mellahi and Wilkinson (2010) on the number of patents issued, Elbanna
6
(2012) on organizational performance, Huang and Li (2012) on project performance, Salge and Vera (2013) on learning capability and organizational performance, and Su et al. (2011) on a composite index built from responses in five categories: growth, profitability, quality, service and overall performance.
However, profitability and sales growth are the most common dimensions and measures of firm performance, and they are shown to interact and evolve in complex, multidimensional ways (Steffens et al., 2009). The most frequent argument made for establishing a link between them is that growth results in a greater size, which, in turn, fosters economies of scale and scope, first mover advantages and network externalities (Davidsson et al., 2009; Bercovitz and Mitchell, 2007). Szymanski et al. (1993) argue that common sources of sales growth may drive economic benefits, but that they may also bring greater costs, with uncertain effects on profitability. Some authors present growth and profitability as different and even as opposite and conflicting strategic objectives (e.g. Peteraf and Barney, 2003; Markman and Gartner, 2002; Armstrong and Green, 2007).
While most existing research analyzes the effects of slack on different measures of profitability (e.g. Tan and Peng, 2003; Tan, 2003; Love and Nohria, 2005; Peng et al., 2010; Modi and Mishra, 2011; Lecuona and Reitzig, 2014; Vanacker et al., 2013), to our knowledge only Mishina et al. (2004) and Bradley et al. (2011a) analyze its influence on sales growth. Given that firms may have one or both strategic objectives (often considered as opposites), or they may seek to balance them, a complete analysis requires considering the impact of slack on both measures of performance.
Most previous research classifies slack according to its discretional managerial use (e.g. George, 2005; Bradley et al. 2011a, 2011b). Accordingly, a commonly established distinction between absorbed and unabsorbed slack (e.g. Tan and Peng, 2003; Huang and Li, 2012) refers to excess costs in organizations with low discretional use, and to uncommitted resources allowing greater managerial discretion, respectively. The discussion concerning the influence of slack does not usually distinguish between absorbed and unabsorbed varieties. While organizational theory argues that slack resources, in general, have a positive effect on firm performance, agency theory identifies a negative influence (Tan and Peng, 2003; Daniel et al., 2004; George, 2005). Extant knowledge here is inconclusive with respect to the sign of the effect of different types of slack on performance, and also with respect to the level of slack at which firms achieve
7
optimal performance. However, it seems that absorbed slack may provide a buffer, or a pool of resources, allowing for the exploitation of opportunities or exploration of potential market requirements, thus enabling growth but also likely jeopardizing profitability. For instance, the existence of excess inventories, machinery or equipment may help to fuel immediate future sales or facilitate expansion plans, ensuring the supply of growing or new market demands. However, these surplus resources may be a burden on a firm’s profitability. Similarly, the endowment of a large staff of qualified employees or senior officers may help to build strategies leading to future business growth, but may, in turn, prove to be a burden on a firm’s profitability, even over the long term. Given that unabsorbed slack, including financial slack and cash reserves, allows for a wider array of potential and discretional uses, it may have more uncertain effects on a firm’s profitability and growth.
The main concern of this study is to analyze the existence or otherwise of U-shaped or inverted U-shaped relationships between slack and performance. Extant research is inconclusive on this question, regarding both the arguments underpinning such relationships and the empirical findings.
With respect to the inverted U-shaped relationship, various authors have argued for (and found) the existence of this relationship, concluding that a moderate level of slack provides for optimal performance (e.g. George, 2005; Tan and Peng, 2003; Tan and Wang, 2010; Chiu and Liaw, 2009). There are a number of plausible explanations as to why this might be the case. On the one hand, from the point of view of organizational theory, slack enhances experimentation, risk taking, innovativeness, building capabilities, etc. It also eases capital restrictions and strategic choices. Therefore, an increase in slack is associated with a subsequent increase in performance. However, at higher levels of slack, the behavior recognized by agency theory prevails. Managers become complacent and engage in irrational decision-taking, including excessive diversification or managerial empire building (e.g. Cooper et al., 1988; Hope and Thomas, 2008). When managers have been engaged in successful and/or ongoing projects and courses of action, they lose any perception of threat and fail to change their resource investment patterns and organizational processes (Gilbert, 2005). For example, an excessive endowment of staff, employees and other selling, general and administrative resources may result in a less alert or dedicated management, who behave complacently. Such a response is likely to be even more pronounced when financial resources are plentiful. The excessive
8
abundance of such resources is a burden undermining a firm’s performance, both in absolute and relative terms. Hvide and Møen (2010) found empirical evidence of this relationship between wealth and returns on equity.
According to Nohria and Gulati (1996), two underlying mechanisms are activated. On the one hand, too little slack discourages any type of experimentation where success is uncertain, while a certain amount of slack promotes greater risk taking, experimentation and the undertaking of new projects. Slack also frees up managerial attention, a scarce resource that cannot be exploited when levels of slack are low. On the other hand, slack promotes diminishing levels of discipline. As slack increases, the discipline exercised in the selection, ongoing support, and termination of projects becomes lax, with the result that inappropriate projects may be initiated and developed. Moreover, managers tend to become less demanding about reaching certain targets. For example, a surplus of shareholder or cash funds may help to fuel expansion plans or new projects, but beyond a certain level it may equally breed complacency and a lack of discipline, resulting in the implementation of unsuitable projects or a deterioration in the rigor with which good projects already underway are pursued. These countervailing forces describe an inverted U-shaped relationship with performance, suggesting that perhaps an intermediate level of slack is optimal. Likewise, increasing levels of inventories and equipment will allow sales growth, but on reaching a certain point they will begin to compete with the resources needed to start new projects and will become detrimental to growth. In the same vein, Salge and Vera (2011) argue that once this turning point has been reached, excessive slack can be expected to drive inertia, which in its turn jeopardizes performance.
In the case of arguments identifying a U-shaped relationship, a lack of slack may force a company to manage projects with greater care and efficiency (Baker and Nelson, 2005) and, in this way, achieve a good performance. Likewise, as a firm’s wealth begins to increase it may feel less impelled to strive for efficient use, explore new possibilities and make proactive choices. In contrast, a firm with little slack, and especially with limited financial resources, is forced to try out new ideas, enhance innovation, make proactive choices, overcome scarcity and, therefore, improve its performance. Yet, firms with slack above a certain level, while under no obligation to innovate, are in a better position to build capabilities and implement the decisions needed to improve performance. Bromiley (1991) argues that when slack corresponds to the firm’s target level (as determined by its aspirations), it takes few risks, because they consider the organization to be operating
9
satisfactorily and so it adheres to conventional routines. But at levels below and above this target slack, managers are more forced, willing or able to take risks. This means slack should have a non-linear influence on performance, with both high and low levels of slack being associated with higher levels of performance than those associated with more moderate levels of slack. Another plausible explanation is that at low resource levels, all available resources must be assigned to either operational or urgent tasks. The first increases in slack merely burden financial performance, as the incremental investment required by these additional resources is not adequately rewarded with future additional income, thus decreasing performance in relative terms. While efforts are focused on operational activities, they cannot be transferred to value-added activities. In such situations, a firm’s dynamics are unable to perform well, because strategic and planning activities are constantly being postponed in order to run daily operations, and any available resources, however valuable or qualified, must be implemented to ensure short-run operations and to deal with disruptions caused by unexpected events. For instance, Argilés et al. (2014) found empirical evidence that labor accidents contribute to decreasing long-term profitability, suggesting that the disruptions caused by these accidents take up managerial slack, diverting managerial attention and strategic activities into ensuring restoration of daily operative tasks. There is a large body of empirical evidence pointing to the beneficial effects of planning on performance (e.g. Delmar and Shane, 2003; Brinckmann et al., 2010; Kim and Sung-Choon, 2013), but there are few options for developing planning and strategic behaviors when slack is scarce. Only when a certain level of slack is achieved can managers focus on strategy and planning and devote sufficient time to these activities. Thus, it is only at levels above this that slack fuels future performance through the implementation of value-added decisions. Consequently, when slack is scarce the effect of any incremental expansion of resources is a decrease in performance, but above a moderate level of slack, firm performance increases as a result of proactive management decisions and new capabilities being put into action. This may be the influence of staff, employees and other selling, general and administrative resources on future sales growth. While Bromiley (1991) failed to find empirical evidence of a U-shaped relationship between slack and performance, Chiu and Liaw (2009) claimed to find such a relationship between recoverable slack and performance, as well as an inverted U-shaped relationship between both available and potential slack and two out of their three measures of performance.
10
Next, we explain the methodology used to test empirically the existence of hump-shaped or U-hump-shaped relationships between slack and performance.
3 Research design
3.1 Empirical model
In this study we analyze the existence of U-shaped or inverted U-shaped relationships between a wide array of slack indicators and two different dimensions of firm performance: profitability and sales growth. To do so, we use two equations. Equation 1 analyzes the effects of slack on firm profitability (PR). It formulates future firm profitability depending on different indicators of slack (SL), while controlling also for sales growth, size and specific seasonal or temporal effects:
𝑃𝑅, = 𝛼 + 𝛼 ∙ 𝑆𝐿, + 𝛼 ∙𝑆, 𝑆,
+ 𝛼 ∙ log𝐴𝑆𝑆, + α ∙ Y,
+ ε, (1)
where subscripts i, t and n refer to firm, year and the forwarded year, respectively; S indicates sales; ASS is firm size measured in terms of total assets; Y represents dummy variables indicating that an observation belongs to a given year (with value 1, and zero otherwise); s and z are the subscripts for the estimators of sales growth and size, respectively, and ε is the error term. For simplicity, we use this last symbol to indicate the error term in all equations in this paper.
Equation 2 analyzes the effects of slack on future sales growth, depending also on the controls of size and investment in production resources, and on seasonal and temporary effects: 𝑆 𝑆 = 𝛽 + 𝛽 ∙ 𝑆𝐿, + 𝛽 ∙ log𝐴𝑆𝑆, + 𝛽 ∙ 𝑃𝑃𝐸, 𝑃𝑃𝐸, + α ∙ Y, + ε, (2)
Here, p is the subscript for the estimator of investment in property, plant and equipment (PPE), or, more precisely, for the increase in fixed assets of this kind.
Previous research uses a range of different definitions and methodologies. While some use absolute measures of profitability and sales growth as dependent variables, others use
11
relative measures. These are combined with independent variables measuring slack indistinctly in either relative or absolute terms, in some cases indexed to industry values and in others to non-indexed values. In this paper we seek to avoid such methodological differences by defining variables in relative terms and standardizing them with industry-year means and standard deviations, which avoids having to include variables of industry characteristics. However, we use non-standardized size values because these raw data allow us to make more appropriate comparisons between the firms of different industries and to perform logarithmic transformations.
We forward the performance measures to better capture the effects of slack and to establish the direction of causality. In line with most previous studies (e.g. Tan, 2003; Tan and Wang, 2010; Peng et al., 2010; Bradley et al., 2011a; Salge and Vera, 2013), we forward performance by a year with respect to slack. That is, we first analyze the influence of slack at year t on performance at t+1. Considering additional forward periods may be controversial, because all slack data included between t and n-1 periods may be expected to gradually influence the corresponding forward performance. While the omission of the corresponding successive slacks would fail to capture their effects, their inclusion would entail problems of collinearity. However, in order to strengthen our outcomes by testing the influence over longer periods, we run further models using three years of forward performance. In this way, we calculate the average performances of the following three years and use them as dependent variables in this further analysis.
A number of previous studies have analyzed the effect of slack in the same year (see Table 1), but their data are usually built from responses to questionnaires, where the identification of organizational slack corresponding to a given date is more problematic.
Below, we provide descriptions, and outline calculations, of all the dependent and independent variables in terms of their corresponding items in COMPUSTAT.
3.2 Measures
12
In line with previous studies, we use two different indicators of firm profitability: return on assets (ROA) and return on equity (ROE)1. The former refers primarily to the financial
profitability of firms, indicating how many dollars of earnings are derived from each dollar of assets controlled, while the latter considers the firms’ financial structure, measuring how efficient they are in generating profits from every unit of shareholder equity. We calculate the ROA by dividing operating income after depreciation (i.e. before financial income and expenses) at t+1 by total assets at t, and we calculate the ROE by dividing pre-tax income at t+1 by stockholder equity at t.
Following Mishina et al. (2004), we use a relative measure of sales growth in Equation 2. We calculate this by dividing sales at t+1 by sales at t, as indicated in the equation. We prefer this to an absolute measure of sales growth, as the latter mainly reflects size. Given that we use standardized variables with industry-year means and standard deviations, this variable provides an appropriate indicator of sales growth relative to industry behavior.
We begin our analysis by forwarding performance one year with respect to slack, and continue with a future analysis for three-year forward performance measures, using the corresponding average ratios for t+1 to t+3 for any of these three performance measures as our dependent variables.
3.2.2 Slack variables
Following the well-established distinction between absorbed and unabsorbed slack (see, for example, Peng, 2003; Huang and Li, 2012), we use a wide array of both types, related to excess costs in organizations with low discretional use and to uncommitted resources allowing greater managerial discretion, respectively.
As measures of absorbed slack, in line with previous studies (e.g. Hendricks et al., 2009; Love and Nohria, 2005; Modi and Mishra, 2011), we use the ratios of inventories to sales (INVSL), property, plant and equipment to sales (PPESL) and selling, general and administrative expenses to sales (SGASL). As measures of unabsorbed slack, we use financial, equity-to-debt and cash slacks (FINSL, EQDSL and CASHSL, respectively).
1 These have been widely used elsewhere (Daniel et al., 2004). More recently, Tan and Peng (2003), Tan
and Wang (2010), Modi and Mishra (2011), among others, employed ROA, while Ebben and Johnson (2005) used both dependent variables.
13
Following Mishina et al. (2004), Bradley et al. (2011b) and Zona (2012), we define financial slack as the difference between working capital available and working capital required, and we take its relative value with respect to total assets. More specifically, we calculate it as the ratio of current assets less current liabilities to total assets.
In line with previous studies (e.g. Vanacker et al., 2013; George, 2005; Bradley et al., 2001a, 2011b), we calculate equity-to-debt slack using the ratio of stockholder equity to current liabilities and long-term debt.
Following Vanacker et al. (2013), Bradley et al. (2011a) and George (2005), we calculate cash slack using the ratio of cash and short-term investments to total assets.
We include the squared forms of all slack variables in the model to test their curvilinear relationships with the dependent variables. Moreover, we perform additional in-depth analyses when a curvilinear relationship is detected. In line with Lind and Mehlum (2010), we calculate the inflection points for any slack variable as well as their Fieller confidence intervals at 95%. We compare these with the lower and upper bounds of the range values of their variables and run the corresponding Lind and Mehlum U-tests.
3.2.3 Control variables
In the traditional cost behavior model, costs are described as fixed or variable with respect to an activity. Given that only variable costs can be immediately related to changes in sales, the increase/decrease in sales in a given period significantly influences firm profitability (Anderson et al., 2003). We expect an immediate positive influence of sales growth (St+1/St) on firm profitability. We also expect a positive influence of investments
in PPE (PPEt+1/PPEt) on sales growth, because, given a certain level of slack, investment
in production resources is a prerequisite to being able to afford sales expansion. In the same vein, cuts in firms’ productive equipment will entail restrictions in activity, and consequently in markets, products and any other subsequent reduction in sales.
Size (logASS) is an important factor influencing firm performance. It is widely recognized that large firms enjoy advantages over small firms. Among these are economies of scale (see, Caves and Barton, 1990; Alvarez and Crespi, 2003), favorable access to credit markets and lower financing costs (see Beck and Demirguc-Kunt, 2006; Martinelli, 1997), more resources to better afford quality-related investments (see Noci, 1994), etc. However, small firms have the advantage of being more flexible (You, 1995), they are less bureaucratic and more inclined to use resources efficiently (Baker and
14
Nelson, 2005), and they respond more quickly to changing circumstances (e.g. Knight and Cavusgil, 1996). Moreover, smaller firms usually attain higher growth rates than their bigger counterparts. While we expect a negative influence of size on growth, its influence on profitability is uncertain. Given the non-normal distribution of this variable, and as is common in business studies, we use the logarithm of total assets.
We then use the ratio of one-year ahead sales to current sales (St+1/St) and size (logASS)
as control variables in Equation 1, and the ratio of one-year ahead PPE to current PPE (PPEt+1/PPEt) and size (logASS) as control variables in Equation 2, in our first analysis
for one year forward. Control variables for years are included in both equations.
4 Sample
We use COMPUSTAT data for all American industrial firms (SIC codes 2 and 3) presenting data between 1979 and 2009 and with at least twenty years of observations in the database. We prefer to use a stable sample of firms to ensure more reliable results, uncompromised that is by firms changing from one year to the next or by short-lived, unusual performers. Although such firms might potentially reveal interesting slack behavior, we consider a stable sample of firms to provide a more appropriate dynamic. We do not consider firms in the service industry because of their different cost structures and business approach. We start with 37,730 year-data observations from 1,453 firms available in the database. Table 2 displays sample and descriptive statistics: means, medians and year-data observations for the untransformed values for all dependent and independent variables used in our study. The average ROA for the 35,797 observations available for this ratio across the whole period is 9.3%, while the average ROE for a similar number of observations is 17.4%. Sales grew 15.8% on average, for the available sample in the period, matched by a similar growth rate for PPE. The corresponding values for the remaining variables are also shown in Table 2.
--- INSERT TABLE 2 ABOUT HERE ---
Given the panel data structure of our sample, assets are converted into values of the most recent year in our sample, applying the US inflation rate. We use the logarithm of these values as an independent variable in our study.
15
The substantial differences between mean and median values in the case of most variables, primarily in ROE, St+1/St, PPESL, EQDSL, CASHSL, PPEt+1/PPEt and ASS,
suggest the existence of influential values, a fact which supports the convenience of winsorizing variables. We standardize all variables with means and standard deviations of year and industry values, with two SIC digits. All standardized variables are then winsorized to the top and bottom 1%. However, all results are substantially the same as with non-winsorized variables.
Given that not all variables are available for all firms and years, the available sample for our multivariate analyses ranges from 1,422 to 1,423 firms, with 31,769 to 33,266 year-data observations, as can be seen in Tables 4 and 5.
5 Results
5.1 Explorative analysis
Table 3 shows the Pearson correlations for the winsorized variables in our sample. While all correlations are significant at p<0.01, their coefficients are not high. The highest value is 0.5385 (between the financial and equity slacks). For the sake of simplicity, we do not show the correlations for the squared slack variables, but the highest variation inflation factor in all the subsequent estimations performed, including these squared terms, is low: 2.40 for financial slack. As such, the estimations are unlikely to be influenced by collinearity.
--- INSERT TABLE 3 ABOUT HERE ---
5.2 Results for Equation 1
We perform panel data regressions with our sample, correcting for autocorrelation disturbances. The Hausman test rejects the null hypothesis of no correlation between individual effects and explanatory variables. As individual effects are correlated with the regressors in all estimations, the random effects estimator is inconsistent, while the fixed
16
effects estimator is consistent and efficient. We, therefore, perform panel data estimations with fixed effects.
Assuming that the results obtained from Equation 1 may be biased, as some of the covariates may be endogenous, we check for this possibility. The equation includes sales growth as a control variable influencing firm profitability, though this growth, in turn, depends on increased investment in productive capacity. We, therefore, include investment in PPE (PPEt+1/PPEt) as an instrument for sales growth (St+1/St) in Equation
1. The residuals for sales growth depending on this instrument, with fixed effects estimation, are significant at p<0.01 when included in Equation 1. This, as suspected, points to the existence of endogenous disturbances both with and without squared terms. We then use the two-stages least squares estimator, available in STATA, for the fixed effects option.
Columns A and B in Table 4 display results for both measures of one-year ahead profitability. All models estimated in this table present a significant goodness of fit, with overall R-squares of 19.7% (when the dependent variable is ROA) and 3.6% (when the dependent variable is ROE). Coefficients for the year dummies are not displayed, for the sake of simplicity. In all estimations, sales growth and size present significant positive and negative influences, respectively, on firm profitability.
--- INSERT TABLE 4 ABOUT HERE ---
As for our variables of interest, the results in column A reveal that the relationships between slack and ROA are linear only for financial and cash slacks (see the non-significant coefficients of their squared terms at p<0.1), while they are non-linear for the remaining slack variables. The significant (at p<0.01) negative signs for slack in inventories and PPE, matched with significant (at p<0.01) positive signs for their corresponding squared terms, reveal non-linear relationships between these slack variables and one-year ahead ROA, suggesting U-shaped relationships. On the other hand, the significant coefficients for slacks in selling, general and administrative expenses (SGA) and equity, matched with significant negative signs for their squared terms, suggest inverted U-shaped relationships between these slacks and one-year ahead ROA.
17
Column B in this table displays estimations when the dependent variable is ROE, revealing non-linear relationships only for slacks in inventories and PPE, with positive significant signs at p<0.01 and p<0.1, respectively, for their squared terms, thus suggesting U-shaped relationships.
5.3 Results for Equation 2
We also assume that the results obtained from Equation 2 may be biased because endogeneity is likely to affect the estimations. The independent variable for investment in PPE (PPEt+1/PPEt) in this equation depends on past sales growth, as well as on past
profitability. We, therefore, include past sales growth (St/St-1) and profitability (ROAt) as
instruments for PPEt+1/PPEt in this equation. The residuals for the latter variable
depending on these instruments, with fixed effects estimation, is significant at p<0.01 when included in Equation 2, thus revealing again the existence of endogenous disturbances. We again use the two-stages least squares estimator with fixed effects. Column C in Table 4 displays the corresponding results. Again, the Hausman test rejects the null hypothesis of no correlation between individual effects and explanatory variables and we, therefore, perform panel data estimations with fixed effects. Coefficients for the dummy variables for years are again, for the sake of simplicity, not displayed. The model estimated in this column presents a significant goodness of fit, with an overall R-square of 17.4%. Size and the investment in PPE present significant (at p<0.01) negative and positive signs, respectively, as expected. With respect to our variables of interest, with the exception of inventory slack, there are non-linear relationships between all slack variables and the dependent variable. The significant signs for PPE, financial and cash slacks, matched with significant negative signs for their squared terms, provide preliminary support for the existence of inverted U-shaped relationships between these variables and one-year ahead sales growth, while the significant positive signs for the squared terms of SGA and equity slacks provide preliminary support for the existence of U-shaped relationships between these variables and the dependent variable.
18 5.4 Analysis of curvilinear relationships
The relationships between most types of slack and the dependent variables are curvilinear, especially with future ROA and sales growth. Table 5 presents a summary of our in-depth analysis of these curvilinear relationships for the estimations in Table 4. In terms of the main purpose of this study, despite the U-shaped (and inverted U-shaped) relationships suggested by the significant signs of the squared slack variables (see columns B and C), all minimum and maximum points lie outside the range of the statistical distribution of the slack variables (see columns D and E in Table 5). Recall we use standardized and winsorized variables in our study. With the exception of equity slack (when the dependent variable is ROA), all the maximum/minimum points of the slack variables lie outside their data ranges or the Fieller intervals (at 95%) of these maximum/minimum points range outside the upper/lower bounds of their slack variable ranges (see column G in Table 5). The Lind and Mehlum tests for the slope of the lower/upper bounds of these variables (when the inflection points are inside but the 95% Fieller intervals are outside the ranges) are non-significant, and so they fail to provide support for the existence of U-shaped or inverted U-shaped relationships between slack and performance (see also column G in Table 5).
--- INSERT TABLE 5 ABOUT HERE ---
As can be seen in columns E to G for panels A and B, the minimum profitability points match up to very high values for inventories and PPE slacks: 6.49707 and 3.54604, respectively, in the case of the dependent variable ROA, and 3.93817 and 7.72551, respectively, in that of the dependent variable ROE. Accordingly, the positive relationships between these variables and future profitability would only start at remarkably high values (outside the data range if we consider the Fieller interval of the minimum points), while for the lower (whole 100%) distribution of these variables, their influences on profitability are negative. Conversely, the maximum ROA is reached at a remarkably low value for SGA slack: -5.48911. Therefore, for the upper (whole 100%) distribution of this slack variable, its influence on ROA is negative, while it would be positive only for the lower values (outside the range).
19
Similarly (see panel C in Table 5), the maximums depicted by the curvilinear influence of PPE and cash slacks on future sales growth are attained at notably high values (outside the range) for these slack variables (4.625628 and 3.84736, respectively). While for the lower (whole 100%) distribution of values, the relationships between these variables and sales growth are positive, and they are negative only for the upper values (outside the range). The positive influence of SGA slack on future sales growth in the corresponding U-shaped relationship starts with a notably low value for this slack variable: -3.51874. Only below the lower values outside the range of its distribution would the influence on the dependent variable be negative, while it is positive for the upper (whole 100%) values of its distribution range. In contrast, equity slack negatively influences future sales growth for most of its range of values (the lower 98.36%), and only after a very high equity-to-debt ratio (3.30036) does it start to have a positive influence on the dependent variable, i.e. for the upper 1.64% (100 − 98.36) of its distribution, which is outside the range considering the 95% Fieller interval for the corresponding minimum point (see panel C in Table 5). Similarly, sales growth attains its maximum when the value for financial slack is -2.1912538. Accordingly, the positive relationship between both variables is found in the lower 1.56% of this variable distribution, outside the data range if we consider the Fieller interval for this maximum point. For the upper 98.44% (the whole 100% if we consider the Fieller interval) of its distribution, the relationship between this variable and sales growth is negative.
Therefore, the influence of slack on firm performance is either solely positive or negative, with the exception of equity slack when the dependent variable is the one-year ahead ROA. In this case, the corresponding Lind and Mehlum U-test is significant at p<0.01 (t-value of 5.33), providing support for an inverted U-shaped relationship. The maximum profitability is 0.87809 for equity slack. The upper 10.05% (100 – 89.95) of its distribution range has a negative influence on the dependent variable, while in the lower 89.95% the influence is positive (see panel C in table 5). Although the relationship between these variables is positive for most of the range of the slack variable distribution, the overall influence of equity slack on the one-year ahead ROA is negative, because the upper range values for this slack variable are very high and profitability decreases sharply in this upper range. While the estimates reveal an overall negative influence on the dependent variable (see the significant negative sign for this variable), the influence of this slack is positive for most values in the distribution. Panels A, B and C in Figure 1 illustrate this relationship.
20 --- INSERT FIGURE 1 ABOUT HERE ---
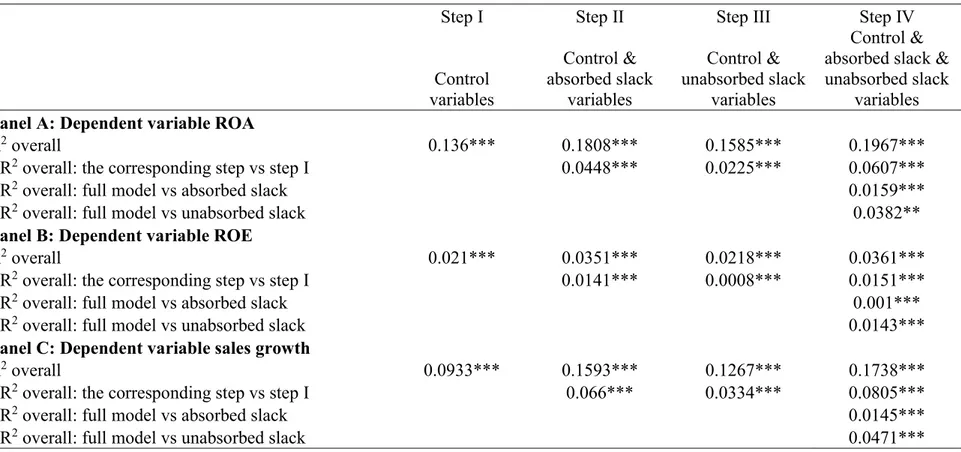
5.5 Stepwise regressions
We next perform four stepwise regressions for each of our dependent variables, in order to assess how much each additional set of variables adds to the explanation of the dependent variables. In a first step we just include control variables, the second and third steps add absorbed and unabsorbed slack variables, respectively, to the basic model with control variables, while in the fourth step we run regressions between our dependent variables and all independent variables included in our Equations 1 and 2 (i.e.: control and absorbed and unabsorbed slack variables).
Table 6 shows a summary of these results. All regressions present significant goodness-of-fit at p<0.001. Wald tests indicate that each set of variables add substantial explanatory power of the dependent variables in the full model. Despite the incremental R2 may seem small in some cases, their corresponding incremental values are significant at p<.01 in all cases. Moreover, the signs and significances of our control and variables of interest (not displayed because of simplicity) are essentially the same, in most cases, as those displayed in Table 4 across all of these stepwise regressions. Results (again not displayed because of simplicity) are also essentially the same, as those presented in Table 5, with respect to the analysis of the curvilinear relationships between our slack and dependent variables.
--- INSERT TABLE 6 ABOUT HERE ---
5.6 Supplementary analyses
We perform additional analyses considering longer lagged periods of the influence of slack on performance. Table 7 displays the results for the estimations of Equations 1 and
21
2, where the dependent variables are the corresponding three-year ahead performance averages. As with estimations using one-year ahead performances, given problems of endogeneity, we again perform two-stages least squares estimations. In Equation 1, the average investment in PPE (for the three years following the reference period for the slack variables) is the instrument for the average sales growth in these years. In Equation 2, the endogenous variable (average investment in PPE for the three following years) depends on two instrument variables: average sales growth and profitability of the previous three years. Table 7 shows estimations for these equations, and Table 8 a summary of the corresponding relationships between slack and performance. Although there are some differences in the linearity and curvilinearity of the relationships with respect to the main underlying relationships, the results are similar to those for one-year ahead performance. Only two (out of 18) present U-shaped relationships (i.e. between equity slack and both ROE and sales growth), but the bulk of both ranges (the lower 97.2% and 95.2%, respectively) presents a negative influence of slack on performance (as in Table 5). In the case of inverted U-shaped relationships between financial slack and ROE, and between PPE slack and sales growth, the 95% Fieller intervals of the maximum points lie outside the variable range values, and the U-tests are only significant at p<0.1.
--- INSERT TABLES 7 AND 8 ABOUT HERE ---
Additional analyses (not displayed, for sake of simplicity) including variables with industry characteristics (that is, number and size of competitors) do not change our results. As expected, given that our variables are standardized with industry-year means and standard deviations, these variables do not significantly influence our dependent variables.
5.7 Summary of results
In short, in 10 out of the 11 cases in which the signs of the squared variables are significant, our analyses fail to confirm the preliminary assessment of the existence of U-shaped or inverted U-U-shaped relationships, and in all cases the relationships are monotonic over the relevant data range values. Despite the relationships suggested by the
22
data in Table 4, the curvilinear relationships between slack and performance cannot be interpreted as U-shaped or inverted U-shaped, as has been concluded in studies conducted elsewhere. On the contrary, the overall influence of slack on performance is either positive or negative (linear, concave or convex) depending on the type of slack and the measure of performance being analyzed. According to our results, absorbed slack influences future profitability negatively and future sales growth positively. The influence of unabsorbed slack would appear to be more complex. While financial and equity slacks have a positive influence on future ROA (the corresponding influence of cash slack being negative), their influence on future sales growth is negative (the corresponding influence of cash slack here being positive).
Results are essentially the same when we consider three years lagged periods of the influence of slack on performance.
6 Discussion
George (2005, p. 672) reframed the simple question of whether slack is good for performance into a more complex set of questions: “How much of what form of slack is good for performance?” and “When is slack good for performance?”. Interpretations of U-shaped and hump-shaped relationships suggest there is no absolute advantage or liability in the existence of slack, and that resources should either be optimized in order to maximize performance or kept outside of a certain range to avoid minimum performance. From this perspective, the key is to determine either the intermediate optimal or the less performant level of slack. Empirical academic research claimed to provide support for these theoretical tenets when significant signs for several slack indicators, as well as for their corresponding squared variables, were found in the estimations of regression models (e.g. Tan and Peng, 2003; Tan and Wang, 2010; Chiu and Liaw, 2009). However, some estimations provide maximum and minimum points that lie outside a plausible range of values, and their corresponding hump- or U-shaped relationships may be more formal than effective possibilities. For example, the estimations in Chiu and Liaw (2009) provide maximum and minimum profitability at values of 16.6 and 5.25 for available and recoverable slacks, respectively. These authors define available slack as the ratio of current assets to current liabilities, and recoverable slack as the ratio of SGA to sales. We would be unlikely to find a firm with current assets
23
16.6 times greater than current liabilities (a mere 0.65% in our sample of about 37,000 observations not previously winsorized). Similarly, we would be highly unlikely to find a surviving firm with an SGA 5.25 times greater than sales (not a single observation in our sample). Consequently, despite the authors’ claims of having found U-shaped and inverted U-shaped relationships between available and recoverable slacks and profitability, respectively, they are actually positive and negative effects, comparable to the effects we find between our corresponding variables (FINSL and SGASL) and ROA. In our study, we find curvilinear relationships between slack and performance, also apparently resembling U- and inverted U-shapes, but, in fact, they are merely positive or negative. Therefore, our results have crucial implications for theories arguing the existence of thresholds of slack. They provide support for the existence of absolute advantages and disadvantages of slack, which means that the influence of a given slack on performance is solely positive or negative. There are no intermediate optimal or less performant levels of slack. Resources can fuel or decrease performance, depending on the type of slack and the type of performance, with simple positive or negative influences in most cases.
Previous studies of the influence of slack on performance have analyzed different types of slack, but they examine their influence on just one (or various similar) measures of performance, usually profitability. Our research supports the findings of previous studies regarding the diverse impacts of different types of slack on firm performance but here we contribute evidence of opposite and conflicting influences on profitability and growth. For all six measures of slack used in this study we find these opposite effects. This finding has interesting implications since it points to the existence of conflicting strategic objectives or, more precisely, it suggests that resources cannot be used to attain profitability and growth simultaneously. On the contrary, managers must balance these conflicting effects, endowing more or less of a particular resource depending on its specific impact and on the relative priority given to one or other of these strategic objectives. According to our results, while the endowment of a specific resource has a net marginal benefit for one objective, it entails a net marginal loss for the other. As such, our findings have interesting implications for our understanding of organizational and agency theory postulates on the influence of slack on performance.
We find that absorbed slack has a positive influence on future growth but a negative influence on profitability. As such, the positive effects of slack on performance, as
24
hypothesized by organizational theory, apply in relation to absorbed slack acting on future growth. Our results suggest that excess inventories and PPE provide firms with flexibility to exploit market opportunities (including the availability to deliver unexpected customers’ orders), to protect themselves against mismatches between supply and demand, or to attend to growing demand. All in all, this flexibility enhances sales growth. Similarly, the positive relationship between SGA slack and sales growth suggests that the staffing resources included in these expenses provide a buffer to environmental threats and allow firms to explore and exploit future opportunities for business growth. These results also seem to suggest that SGA slack allows for the necessary managerial attention to the coordination and planning needed to ensure long-term business expansion. When there is no excess capacity, managers can only attend to daily operational routines and address urgent tasks as they arise; this being the case, they are unable to devote any efforts to strategic value-added activities aimed at long-term firm survival and expansion.
The positive concave relationships for inventories and PPE indicate decreasing marginal effects of this slack on growth, while the positive convex relationship for SGA indicates increasing marginal effects of this slack. According to these relationships, the effect of tangible absorbed slack, such as inventories or equipment, on future growth is limited compared to the corresponding exponential effect of intangible absorbed slack, such as the managerial coordination and resource planning included in SGA. Raw materials, machines and equipment must be preferentially used for a defined manufacturing purpose. All of them, as well as finished products, may have an important role in fueling growth, but their influence decreases when current markets are sufficiently supplied. Managerial efforts may produce increasing marginal effects because they can be assigned to the development of new markets or products.
The negative influence of all our absorbed slack variables on profitability provides support for the agency theory stance. These results suggest that firms apply abundant absorbed resources, regardless of profitability. Managers may decide to maintain buffers in inventories, machine, equipment or SGA aimed merely at growth and/or at self-serving interests such as prestige or different kinds of rewards. Where they have a wealth of these resources, managers do not pay full attention to stretching them appropriately, and any additional committed resource progressively decreases profitability. Moreover, managers tend to convert excess available slack into unnecessary or self-interested activities, especially when managerial tasks are difficult to monitor and control. Given that size is
25
an additional factor influencing this difficulty, it is not implausible that one important factor behind an abundance of absorbed slack is managers’ opacity limiting principal’s scrutiny, thus reinforcing the growth-profitability loop. The decrease in profitability is greater with increasing SGA slack, than with inventories and PPE slacks, as can be seen by the former’s higher negative coefficient, as well as by its concave negative relationship, compared to the lower coefficients and convex negative curves of the latter. These results suggest that managers prefer to utilize resources embedded in SGA to pursue self-interest objectives.
Unabsorbed slack has more diverse and complex influences on performance than absorbed slack, because it has more potential uses. However, some common patterns can be identified from our results for unabsorbed slack. Like absorbed slack, there are solely positive or negative relationships between most ranges of these variables and performance, with opposite and conflicting influences on profitability and sales growth. While the influence of cash slack on performance is similar to that of absorbed slack, financial and equity slacks influence profitability and growth positively and negatively, respectively. These results suggest that financial and equity wealth is associated with management complacency, inhibiting experimentation and risk taking, and having a negative influence on long-term growth. By contrast, firms with lower financial and equity wealth must rely more on indebtedness, withstanding greater financial stress and expenses, which decreases profitability but forces managers to take proactive action to look for new opportunities and overcome the financial stress. Accordingly, agency theory assumptions seem to play an important role in the relationship between unabsorbed slack and growth. In this scenario, indebtedness is a disciplinary factor. Financial and equity constraints alter the way in which resources are expended, avoiding manager empire building and ensuring resources are devoted to strictly necessary business operations, while a lack of these constraints contributes to agency behavior. It should also be noted that the level of a firm’s slack is also the outcome of management decisions. Firms undertaking proactive investment decisions are more likely to need external financial resources, thus increasing their financial stress. By assuming higher financial costs, they lower profitability. The opposite effect is found in conservative firms with few investment projects. Financial slack reflects the automatic operating liquidity provided by working capital. As it increases, short-term financial stress falls and, consequently, it acts as a greater financial buffer. Similarly, greater equity slack means lower indebtedness, which
26
entails lower financial expenses and higher profits. Our results for the relationships between financial and equity slack and profitability provide support for the positive effect of slack on performance, as hypothesized by organizational theory. The greater positive effect of financial slack on profitability indicates that organizational theory plays a more important role in relation to this slack. The positive linear relationship between financial slack and profitability, compared to the corresponding positive concave relationship for equity slack, reinforces this more important role. The relationship between equity slack and profitability is positive for most of the distribution range of this independent variable, yet it is matched with a negative agency effect. At a crucial point, profitability decreases sharply, suggesting that complacency and opportunistic behaviors play a dominant role across the upper 10.05% of the distribution range of this variable. It is the only slack variable in our study that presents an effective inflection point, or to be more precise that depicts an inverted U-shaped relationship, where profitability decreases sharply across the small upper distribution range.
The higher negative coefficients of absorbed slack compared to those of unabsorbed slack, when the dependent variable is profitability, suggest that these latter resources provide more opportunities for redeploying resources to more profitable opportunities, or for devoting these high-discretion resources to exploring new and more favorable opportunities, while absorbed slack is more constrained to current uses and better suited to expanding current business at the expense of profitability.
Finally, our results have general implications for theory. Both, organizational and agency theories are imprecise with respect to the influence of slack on firm performance in some points. First, there are no precise and elaborated formulations with respect to the existence of non-linear relationships in these theories. There are several hints, suggestions or explanations provided by some authors (see section 2) which mainly repeat, overlap and combine the fundamentals of both theories, but they are no precise enough with respect to the extent, feasibility, circumstances and factors which would determine the turning points of the prevailing positive into negative influences, and/or vice-versa. It perhaps requires a new theory, or a synthesis of both theories acknowledging or reconciling the effect and importance of both influences of slack on performance, as well as their interplay. Second, both theories are ambiguous and ill-defined with respect to the array of available resources and business companies’, or organizations’, objectives, and its associated measures of performance. Profitability is an important firms’ objective, but
27
they may also share it with growth, quality, market share, customer or client satisfaction, environmental and social issues, etc., or even prefer them to it. Moreover, there are also very different types of available resources, even within both the absorbed and unabsorbed slack categories, which may diversely influence performance. New accurate and detailed theory is required with respect to the precise influence of specific types of slack on different types of performance.
7 Conclusions
In this study we have analyzed the influence of slack on future firm performance using standardized and winsorized dependent and independent variables. Assuming that the effects of slack on performance are likely to vary according to the slack and performance indicators used, we employed three indicators of absorbed and unabsorbed slack, in addition to two ratios of profitability (ROA and ROE) and a ratio of sales growth as dependent variables. We use a panel data sample of firms with at least twenty years of observations in COMPUSTAT.
Although the relationships between most slack and performance measures are found to be curvilinear, the inflection points (both maximums and minimums) lie outside the range of our slack variables or they are biased values of their distribution ranges. In 10 out of 11 cases of significant signs presented by the squared slack variables (13 out of 15 in the case of the three-year forward performance), our analyses do not provide support for the existence of either U-shaped or inverted U-shaped relationships. In the few remaining cases, the maximum or minimum points are implausible real values. Consequently, the effects of slack on performance are either positive or negative for the relevant values of the distribution ranges of these slack variables, and only in a tiny part of their lower or upper ranges do the signs of influence change. In fact, the relationships between slack and future performance are either positive or negative, and either linear, concave or convex.
According to our findings, there are no plausible crucial slack levels that permit a maximum or minimum future performance. Resource endowment with respect to slack is not, therefore, a technical question that offers a solution to an optimization problem.
28
The opposite and conflicting effects of slack on profitability and growth are important additional implications to be derived from our study. Overall, we find that absorbed slack has opposite and conflicting effects on future profitability and sales growth, that is, negative and positive, respectively. Results are robust to the consideration of different periods of future performance. The influence of unabsorbed slack is more complex and less univocal than that of absorbed slack. A manager deploys resources depending on their availability and in line with the firm’s strategy, considering that the greater the absorbed slack the higher its future sales growth will be, but the worse its future profitability. As such, the manager in deploying resources seeks to balance their opposite impacts on profitability and growth, prioritizing a specific strategic objective. Future research may find actual evidence of such relationships, perhaps in specific contexts or with certain moderating effects, but in the meantime academics should use the appropriate methodology to test them.
The measurement of the influence of slack on performance over long-term periods is subject to limitations. There is no substantial theoretical support for an appropriate limit for this forward period on which this influence should be projected. On the other hand, provided that an n forward period is appropriate, it is implausible that subsequent consecutive forward slacks would not also influence the subsequent forward performance. Even the slack in the same n forward period influences current performance. Moreover, the inclusion of consecutive slacks entails problems of collinearity.
An interesting additional avenue for future research is to assess the future term at which the influence of different types of slack is recorded. This would also include the examination of methodological issues for dealing with the simultaneous slack effects of consecutive periods and any subsequent changes. Likewise, more research is needed with respect to the different opportunities that can arise from this issue. Specifically, more analyses are needed that consider longer term effects, and more complex interactions and moderators, of slack on different indicators of firm performance. Additionally, in line with previous studies (e.g. Lecuona and Rietzig, 2104; Bradley et al., 2011; Mishina et al., 2004; Love and Nohria, 2005), a greater variety of environments and settings should be analyzed for different types of slack.
29
Alvarez, R., & Crespi, G. (2003). Determinants of Technical Efficiency in Small Firms. Small Business Economics, 20, 233–244.
Anderson, M.C., Banker, R.D. & Janakiraman, S. (2003). Are selling, general and administrative costs sticky? Journal of Accounting Research, 41, 47-63.
Argilés, J.M., Martí, J., Monllau, T., Garcia, J., & Urgell, T. (2014). Empirical analysis of the incidence of accidents in the workplace on firms’ financial performance. Safety Science, 70, 123-132.
Armstrong, J.S., & Green, K.C. (2007). Competitor-oriented objectives: the myth of market share. International Journal of Business, 12, 117-136.
Baker, T., & Nelson, R. (2005). Creating Something from Nothing: Resource Construction through Entrepreneurial Bricolage. Administrative Science Quarterly, 50(3), 329-366.
Banker, R.D., Potter, G., & Schroeder, R.G. (1995) An empirical analysis of manufacturing overhead cost drivers. Journal of Accounting and Economics, 19, 115-137.
Beck, T., and Demirguc-Kunt, A. (2006) Small and medium-size enterprises: Access to finance as a growth constraint. Journal of Banking and Finance, 30, 2931-2943. Bercovitz, J., & Mitchell, W. (2007). When is more better? The impact of business scale
and scope on long-term business survivial, while controlling for profitability. Strategic Management Journal, 28, 61-79.
Bourgeois, L. (1981). On the measurement of organizational slack. Academy of Management Review, 6, 29-39.
Bradley, S.W., Shepherd D.A., & Wiklund, J. (2011a). The importance of slack for new organizations facing “tough” environments. Journal of Management Studies, 48, 1071-1097.
Bradley, S.W., Wiklund, J., & Shepherd, D.A. (2011b). Swinging a double-edged sword: The effect of slack on entrepreneurial management and growth. Journal of Business Venturing, 26, 537-554.
Brinckmann, J., Grichnik, D., & Kapsa, D. (2010). Should entrepreneurs plan or just storm the castle? A meta-analysis on contextual factors impacting the business planning-performance relationship in small firms. Journal of Business Venturing, 25, 24-40.
Bromiley, P. (1991). Testing a causal model of corporate risk taking and performance. Academy of Management Journal, 34, 37-59.
30
Caves, R.E. & Barton, D. (1990) Efficiency in US Manufacturing Industries. MIT Press, Cambridge.
Chiu, Y., & Liaw, Y. (2009). Organisational slack: is more or less better? Journal of Organizational Change Management, 22(3), 321-342.
Cooper, A.C., Dunkelberg, W.C., & Woo, C.Y. (1988). Entrepreneurs’ perceived changes for success. Journal of Business Venturing, 3, 97-108.
Cyert, R., & March, J. (1956). Organizational factors in the theory of oligopoly. Quarterly Journals of Economics, 70, 44-64.
Daniel, F., Lohrke, F.T. Fornaciari, C.J., & Turner, R.A. (2004). Slack resources and firm performance: a meta-analysis. Journal of Business Research, 57, 565-574.
Davidsson, P., Steffens, P., & Fitzsimmons, J. (2009). Growing profitable or growing from profits: putting the horse in front of the cart. Journal of Business Venturing, 24, 388-406.
Delmar, F., & Shane, S. (2003). Does business planning facilitate the development of new ventures? Strategic Management Journal, 24, 1165-1185.
Ebben, J.J., & Johnson, A.C. (2005). Efficiency, flexibility, or both? Evidence linking strategy to performance in small firms. Strategic Management Journal, 26, 1249-1259.
Elbanna, S. (2012). Slack, planning and organizational performance: Evidence from the Arab Middle East, European Management Review, 9, 99-115
George, G. (2005). Slack resources and the performance of privately held firms. Academy of Management Journal. 48, 661-676.
Gilbert, C.G. (2005). Unbundling the structure of inertia: resource versus routine rigidity. Academy of Management Journal, 48, 741-763.
Hendricks, K.B., Singha, V.R., & Zhang, R. (2009). The effects of operational slack, diversification, and vertical relatedness on the stock market reaction to supply chain disruptions. Journal of Operations Management, 27, 233-246.
Hope, O.K., & Thomas, W.B. (2008). Managerial empire building and firm disclosure. Journal of Accounting Research 46, 591-626.
Hvide, H.K., & Møen, J. (2010). Lean and hungry or fat and content? Entrepreneurs’ wealth and start-up performance. Management Science, 56, 1242-1258.
Huang, J.W., & Li, Y.H. (2012). Slack resources in team learning and project performance. Journal of Business Research, 65, 381-388.