TRENDS
in
Sport Sciences
2017; 4(24): 143-150 ISSN 2299-9590 DOI: 10.23829/TSS.2017.24.4-1 Received: 15 September 2017 Accepted: 29 November 2017 Corresponding [email protected]1 University of Warmia and Mazury in Olsztyn, Department of Physical Education and Sport, Olsztyn, Poland
2 University of Warmia and Mazury in Olsztyn, Department of Heavy Duty Machines and Research Methodology, Olsztyn, Poland
3 University of Malaga, Faculty of Educational Sciences, Malaga, Spain
4 University of Macerata, Department of Law, Macerata, Italy ROBERT PODSTAWSKI1, PIOTR MARKOWSKI2, DARIUSZ CHOSZCZ2, RAFAEL MERINO-MARBÁN3,
OSCAR ROMERO-RAMOS3, CRISTINA CURTOLO4
An evaluation of the reliability of the 8-second Skipping with
Hand Clapping (8-s SHC) test with the use of the retest method
Abstract
Aim of Study. The aim of this study was to evaluate the reliability of the 8-second Skipping with Hand Clapping (8-s SHC) test performed by young women and men. The presence of a “training trend” was checked during the evaluation. Material and Methods. The study involved 84 female students and 83 male students of the University of Warmia and Mazury in Olsztyn, aged 19-21 years (mean age: 19.44 ± 0.50 and 19.59 ± 0.49, respectively). The reliability of the 8-s SHC test was determined the number of claps in 10 successive repetitions of the test. The and post-hoc tests. Results.
between successive repetitions of the 8-s SHC test were within the range of acceptable reliability (0.80-0.90) to good reliability between the number of claps in successive repetitions of the 8-s SHC test point to the presence of a “training trend”. Those and men. Conclusions. The 8-s SHC test is a reliable tool for assessing speed abilities among young women and men. The “training trend” should be eliminated before the test is used to evaluate speed abilities. A minimum number of 5 repetitions of the above motor test should be performed in advance for the norms, can be used in the process of improving speed abilities for people of different ages.
KEYWORDS: reliability evaluation, retest method, training trend, speed abilities, 8-SHC test, university students.
Introduction
E
students based on adequate and reliable criteria are essential for validating the effectiveness of physical University students have to engage in the appropriate kinesiology activities to develop and maintain their biotic motor abilities at satisfactory levels. The appropriate tools abilities lays the foundations for successful adoption and implementation of motor skills that are essential for daily and skills, sources of motivation, strengths and needsacknowledged motor ability tests should be carefully New motor ability tests have to meet several adequacy criteria, including reliability. Low reliability of
measurements used to evaluate the level of speed abilities a given test as a measuring tool. If a given test, poorly correlates with itself, then it cannot be expected to show greater usability in assessing or anticipating another given test will show poor correlation with any other one, regardless of what motor abilities it measures. Reliability
provides information about the magnitude of measurement error, and it is directly linked with the consistency of results if it is conducted at least twice (retest method) in In most cases, reliability is determined by calculating following estimated intervals of reliability (correlation) in motor tests: 0.95-0.99 – perfect reliability, 0.90-0.94 – good reliability, 0.80-0.90 – acceptable reliability, 0.70- for individual assessments which is acceptable for group regarded as satisfactory in motor tests. The reliability of lowest in children and seniors, probably because these groups are characterized by mood swings and a short The presence of a “training trend”, which points to a gradual improvement in motor abilities due to repeated during reliability assessments involving the retest method. A “training trend” can be diagnosed by analyzing
motivation. The reliability of speed tests has been less frequently investigated in the literature, and the relevant assessments have been made in the Slalom test (speed) and the Hurdle test (agility) involving 11-year-old girls The aim of this study was to evaluate the reliability of the 8-s Skipping with Hand Clapping (8-s SHC) test
which was performed by female and male university students in 10 repetitions in weekly intervals. The above goal was pursued by answering the following questions:
between the results scored in each of the 10 repetitions of the 8-s SHC test?
2. Do the results (average number of claps) of that could be indicative of a “training trend”?
Material and Methods Participants
full-time students of the University of Warmia and Mazury in Olsztyn, aged 19-21 years (mean age: 19.44 ± ± 0.50 and 19.59 ± 0.49, respectively). The participants attended only obligatory physical education classes (90 minutes per week) and performed one 8-s SHC test per week. All participants were permanent residents of the Region of Warmia and Mazury in Poland.
Procedures
The study was carried out in compliance with provisions of the Declaration of Helsinki and upon the prior consent of the Bioethical Committee of the University of Warmia and Mazury in Olsztyn. All participants signed written consent forms.
Measurements
(PA) levels. For this reason, students who participated in extracurricular sports activities as well as students who were dismissed from physical education classes on medical grounds were excluded from the study. The International Physical Activity Questionnaire was used weekly amount of exercise (minimum of 10 minutes) they had performed in the weeks preceding the study. The energy expenditure associated with the declared amount of weekly exercise was calculated and expressed in Metabolic Equivalent of Task (MET) units. The MET is the ratio of the rate of energy consumed during exercise to the rate of energy consumed at rest. One MET unit represents the amount of oxygen which is consumed in 1 minute, which is approximately equal to 3.5 mL/ /kg/min. The students were divided into groups with
PA levels based on the declared frequency, intensity and duration of exercise. Ultimately, only participants characterized by low PA levels, sedentary lifestyle and selected for the study. The results of the IPAQ survey were analyzed to reveal that none of the polled students group of female and male respondents with equally sedentary lifestyles was selected based on IPAQ results which are not presented in this paper. Body mass and height were measured using a Martin anthropometer according to standardized guidelines. The results were used to calculate the Body Mass Index (BMI). Speed abilities were evaluated with the use of the 8-s Skipping repeated the 8-s SHC test 10 times in weekly intervals. Every student performed the test once in each week of the study.
Phases of the 8-s SHC test:
Phase I The participant starts the test in neutral position. Phase II On the “start” cue, the participant runs in place
for 8 seconds, lifting the knees high (thighs are at least perpendicular to the ground) and clapping hands under the bend knee.
Score: The score is the number of hand claps performed
in 8 seconds.
Comments: During the test, the participant should not
slouch, the torso should remain erect, hands should be clapped against each other under the knee, and not against a raised leg. The following errors disqualify the participant: torso excessively curled forward, slouching and clapping hands against a raised leg, leg not raised high enough.
Every female and male participant was given clear instructions on how to correctly perform the 8-s SHC test. The participants were able to improve their technique by practicing twice during each of the two meetings warm-up routine was held before the test. The same routine was used in all groups. The following exercises and movement patterns were incorporated into the hold exercises, two 8-meter dashes, dynamic stretching same warm-up routine for 10 successive weeks in which measurements were performed.
Statistical analysis
The results were processed statistically to calculate minimum, mean and maximum values, median values,
independent variable (number of claps) and the of successive repetitions (independent variables) of the 8-s SHC test, conducted in weekly intervals, on the average number of claps (dependent variable) in a given trial was analyzed to detect the presence of a “training trend”. For this purpose, repeated measures ANOVA (parametric test) or the Friedman non-parametric test were performed for the dependent variable (number of tests were additionally used to identify the repetitions a “training trend”. All calculations were performed at
Results
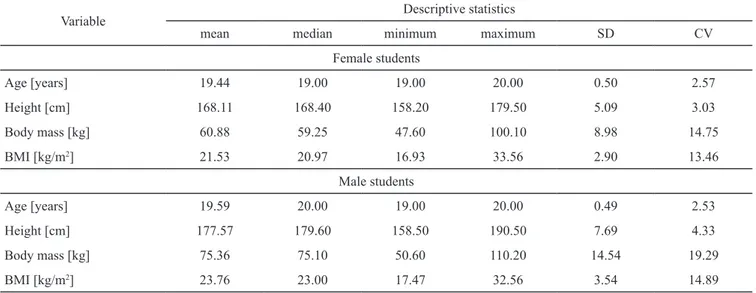
The analyzed anthropometric parameters of the study participants are presented in Table 1.
The mean BMI values were approximately 10% lower in women than in men, but they were within the norm in both groups. Standard deviation values point to smaller variations in body mass, height and BMI values in women than in men (Table 1).
The results (number of claps) scored by female and male students in each of the 10 repetitions of the 8-s SHC test are presented in Table 2.
The average number of claps in all repetitions was approximately 5% higher in the group of male students. Throughout the experiment, the values of standard in both groups for the entire measurement series. A correlation analysis was performed to calculate the every repetition of the 8-s SHC test (Table 3).
Based on the previously described method for evaluating of the 8-s SHC test were indicative of acceptable
both groups (Table 3).
differences in the number of claps between successive repetitions of the 8-s SHC test. Additional analyses were
Table 2. Average number of claps in successive repetitions of the 8-s SHC test
Variable Descriptive statistics
mean median minimum maximum SD CV
Female students
I (number of claps) 24.50 20.00 30.00 2.10 8.53
II (number of claps) 24.74 25.00 20.00 29.00 8.72
III (number of claps) 25.08 25.00 21.00 29.00 2.01 8.03
IV (number of claps) 25.00 19.00 30.00 2.11 8.50
V (number of claps) 24.87 25.00 21.00 30.00 2.03
VI (number of claps) 24.88 25.00 20.00 29.00 2.01 8.07
VII (number of claps) 24.87 25.00 20.00 29.00 7.89
VIII (number of claps) 24.88 25.00 20.00 30.00 2.19 8.81
IX (number of claps) 24.88 25.00 20.00 29.00 2.10 8.45
X (number of claps) 24.88 25.00 20.00 30.00 2.04 8.22
Male students
I (number of claps) 22.00 29.00
II (number of claps) 27.00 22.00 30.00 2.00 7.53
III (number of claps) 25.98 21.00 29.00 1.73
IV (number of claps) 21.00 31.00 1.99
V (number of claps) 21.00 29.00 1.85 7.11
VI (number of claps) 22.00 30.00 1.88 7.22
VII (number of claps) 22.00 30.00 1.85 7.08
VIII (number of claps) 21.00 30.00 1.83 7.03
IX (number of claps) 21.00 29.00 1.85 7.11
X (number of claps) 27.00 21.00 30.00 1.93 7.38
Table 1. Basic anthropometric characteristics of female and male students
Variable Descriptive statistics
mean median minimum maximum SD CV
Female students 19.44 19.00 19.00 20.00 0.50 2.57 158.20 179.50 5.09 3.03 59.25 100.10 8.98 14.75 2 21.53 20.97 2.90 Male students 19.59 20.00 19.00 20.00 0.49 2.53 177.57 158.50 190.50 4.33 75.10 110.20 14.54 19.29 2 23.00 17.47 3.54 14.89
between the average number of claps performed by students in successive repetitions of the test. The robustness of parametric and non-parametric statistics calculations. For example, a parametric test of dependent
Table 3.
female and male students
Variable (observations without valid data were eliminated)
F M I II III IV V VI VII VIII IX X
I 1.0000 0.8839 0.8599 0.8537 0.8730 0.8457 0.8499 0.8544 0.8226 II 0.8854 1.0000 0.9095 0.8934 0.9227 0.9243 0.9157 0.9070 III 0.8177 0.8220 1.0000 0.8995 0.9202 0.8934 0.9141 0.9100 IV 0.8374 0.8527 0.8414 1.0000 0.8785 0.9019 0.8807 V 0.8042 0.8397 0.8734 1.0000 0.8892 0.9150 0.8708 VI 0.7954 0.8184 0.8515 0.8917 1.0000 0.8918 0.9190 0.9012 VII 0.8282 0.8337 0.8510 0.8705 0.9186 0.8758 1.0000 0.8955 0.9045 0.8882 VIII 0.8322 0.8475 0.8395 0.8195 1.0000 0.9277 0.8895 IX 0.8531 0.8397 0.8002 0.8403 0.8179 0.8472 0.8412 1.0000 X 0.9018 0.7861 0.8124 0.7839 0.8217 0.8582 0.8558 1.0000 Table 4.
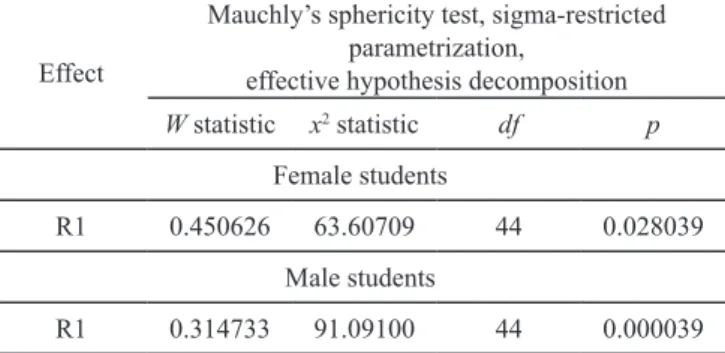
and male students
Effect effective hypothesis decompositionparametrization,
W statistic x2 statistic df p
Female students
R1 44 0.028039
Male students
R1 0.314733 91.09100 44 0.000039
Notes: minimum and maximum values are indicated in bold
Table 5. A comparison of the average number of claps in
successive repetitions of the 8-s SHC test Variable Average
rank Rank sum Sum SD
I 4.773810 401.0000 II 4.952381 24.73810 2.157191 III 540.0000 25.08333 2.013259 IV 473.5000 24.85714 2.112173 V 5.494048 2.028589 VI 5.482143 24.88095 2.008445 VII 5.500000 VIII 5.583333 24.88095 IX 5.523810 24.88095 2.102235 X 472.5000 24.88095 2.044120 I 5.120482 425.0000 II 571.5000 III 5.138554 25.97590 1.731881 IV 5.897590 489.5000 1.994777 V 5.277108 438.0000 1.847873 VI 5.319277 441.5000 1.877297 VII 5.487952 455.5000 VIII 429.0000 IX 5.144578 427.0000 1.847873 X
variables has to be evaluated for sphericity. The results obtained for both groups are presented in Table 4. sphericity test) revealed that the differences between the results scored in each repetition of the 8-s SHC test did not meet the assumption of sphericity (because p < 0.05) in either group. Therefore, the Friedman non-parametric test, an alternative to repeated measures ANOVA for dependent variables, was applied to verify the research hypotheses. The average number of claps in successive repetitions of the 8-s SHC test is presented in Table 5. the average number of claps in successive repetitions of the 8-s SHC test (p < 0.05) in both groups. In the next step,
in the average number of claps were observed until the
Discussion
The present study, conducted in line with the adopted procedural algorithm, produced interesting results. between successive repetitions of the 8-s SHC test, which could be indicative of a “training trend”, were weeks preceding study and the one repetition between trials I and II).
A “training trend” was also observed during a 500 m rowing test performed by female and male university students on an ergometer. Female participants steadily improved their results up to the fourth repetition, and
reliability of a test. In tests that last relatively long, such as endurance runs, measurement error is compensated by other factors (for example cardiovascular endurance), which increases reliability. In contrast, most speed and coordination tests are short, therefore, to assess if a motor test is reliable, parallel-test method can be applied, which is about estimating one motor ability by means of different tests that are next tried for correlation. A group of kindergarten children was corresponded with other motor tests, for instance, 4 x 10 m shuttle run to test speed (+0.73), standing long and sit-ups for 30 seconds to test abdominal strength has a more hybrid character.
Practical Implications and Limitations
The results of this study indicate that the 8-s SHC test is suitable for population studies and can be carried out conditions. A comparison of the values of correlation
Table 6.
F M 24.607 24.738 25.083 24.857 24.869 24.881 24.869 24.881 24.881 24.881
Trial I II III IV V VI VII VIII IX X
25.964 I – 0.0000 0.0260 0.0235 0.0227 0.0270 0.0284 0.0267 0.0248 26.506 II 0.0000 – 0.0044 0.2422 0.2710 0.2523 25.976 III 0.9171 0.0000 – 0.0720 0.0853 0.0930 0.0803 0.0589 0.0845 26.181 IV 0.0050 – 0.9115 0.8430 0.9177 0.8533 0.8508 26.000 V 0.7808 0.0000 0.1778 – 0.9177 1.0000 0.9251 0.9235 0.9211 26.012 VI 0.7244 0.0001 0.7870 0.9229 – 0.9115 1.0000 1.0000 1.0000 26.072 VII 0.4327 0.0003 0.4788 0.3812 – 0.9235 0.9211 0.9177 26.000 VIII 0.7713 0.0001 0.8351 0.1852 1.0000 0.5881 – 1.0000 1.0000 26.000 IX 0.7870 0.0000 0.8529 1.0000 0.9171 1.0000 – 1.0000 26.120 X 0.2598 0.0013 0.2928 0.3812 0.3744 0.3501 –
indicates that the reliability of the 8-s SHC test ranges is 0.70, therefore, the 8-s SHC test can be effectively used to assess speed abilities in young women and men. To date, reliability assessments have been carried out needed to determine the reliability of the 8-s SHC test standards for those age groups based on representative samples of the studied population groups. Developing allow better usage of the 8-s SHC Test in the studies controlling of the speed abilities level based on a higher number of motor tests would be more extensive and accurate.
Conclusions
1. The 8-s SHC test can be reliably used in female and male university students aged 19-21. The values of of the test were indicative of acceptable to good reliability in both female and male students.
in the number of claps between successive repetitions “training trend” has to be eliminated to guarantee that the 8-s SHC test reliably evaluates the speed abilities of young females and males. A minimum of 5 repetitions should be performed before the test can be reliably used to assess the speed abilities of university students.
References
1. Alricsson M, Harms-Ringdahl K, Werner S. Reliability of sports related functional tests with emphasis on speed and agility in young athletes. Scan J Med Sci Sports. 2001; 17: 229-232.
2. Atkinson G, Nevill AM. Statistical methods for assessing measurement error (reliability) in variables relevant to 3. Burton A, Conway JH, Holgate ST. Reliability: what is it, 4. Burton A, Miller DE. Movement skills assessment.
Champaign, IL: Human Kinetics; 1998.
5. Frandkin AJ, Zazryn TR, Smoliga JM. Effects of warming-up on physical performance: A systematic review with meta-analysis. J Strength Cond Res. 2010; 24(1): 140-148.
Hands B, Martin M. Fundamental movement skills: 7. Hraski M, Hovat V, Hovat I. Reliability of instrument for power of kinesiology. Croatia; Zagreb: University of Zagreb Press; 2011. pp. 235-237.
8.
Kessels AGH, Bakker E, et al. Reliability and validity of old children. Eur J Pediatr Neuro. 2004; 8(3): 135-143. 9. Krombholz H. Physical performance in relation to age,
sex, social class and sports activities in kindergarten and 1170.
10. Molenaar HM, Zuidam JM, Selles RW, Stam HJ, dynamometers when used in children. J Bone Joint Surg. 2008; 90: 1053-1059.
11. Morris DM, Uswatte G, Crago JE, Cook EW, Taub E. The reliability of the Wolf Motor Function Test for assessing upper extremity function after stroke. Arch Phys Med 12. Ortega FB, Artero EG, Ruiz JR, Vincente-Rodrigez G, Bergman P, Hagstömer M, et al. Reliability of Health-The HELLENA Study. Int J Obes. 2008; 32: 49-57. Doi: 13.
AWF; 2003. 14.
Level of physical activity of physical education students according to criteria of the IPAQ questionnaire and the recommendation of WHO experts. Biom Hum Kinet. 2014-0002.
15.
Bella P, Johnson G. Reliability and validity of arm function assessment with standardized guidelines for the Fugl-Myer Test, Action Research Arm Test and box and block Test: a multicenter study. Clin Rehab. 2005; 19(4): 404-411.
Podstawski R, Choszcz D, Wysocka-Welanc M. Próba
the adequacy of taking the measurement of the short-term endurance capacity and analysis of the impact of training on the results achieved by the University of
Warmia and Mazury students on rowing ergometer). 17. Podstawski R, Choszcz D, Konopka S. The impact of training on the 500 m rowing ergometer time and 18.
relationships between physical development and speed abilities of children from classes I-III, for the formulation of fair requirements in relation to students on physical education lessons (On example of pupils from primary Activity of People in Different Age. 2010; 14: 103-113. 19.
characteristics, heart rate and the results of the 8-secound skipping with hand clapping (SHC) test in preschool 20. Podstawski R, Markowski P, Choszcz D, Klimczak J, Romero-Ramos O, Merino-Marban R. Methodological aspect of evaluation of the reliability the 3-Minute Burpee Test. Arch Budo Sci Martial Art Extreme Sport.
21.
Polska (Statistics program Statistica. Polish version). Gliwice: Helion S.A. Press; 2012.
22. Ritchie C, Trost SG, Brown W, Armit C. Reliability and 23. Rothwell PM. Analysis of agreement between measurements of continuous variables: general principles and lessons from studies of imaging of carotid stenosis. J Neurol, 2000; 247: 825-834.
24. Sanders SW. Active for life: Developmentally appropriate movement programs for young children. Washington, DC: NAEYC; 2002.
25. Verhagen Metman L, Myre B, Verwey N, Hassin-Baer S, Arzbaecher J, Sierens D, et al. (2004). Test-retest reliability of UPDRS-III, dyskinesia scales, and timed an argument against multiple baseline assessment. Movement Disord. 2004; 19(9): 1079-1084.
fundamental movement skills test for 8 year old children: construction and validation. J Sport Sci Med. 2011; 10: