Molecular Study of the Amazonian Macabea
Cattle History
Julio Vargas1, Vincenzo Landi2,3*, Amparo Martı´nez2,3, Mayra Go´ mez2,3 , Marı´a Esperanza Camacho4, Luz A´ ngela A´lvarez5, Lenin Aguirre6, Juan Vicente Delgado2 1 Universidad Nacional Amazo´nica. Rectorı´a. Puyo, Ecuador, 2 Departamento de Gene´tica, Universidad
de Co´rdoba, Co´rdoba, España, 3 Animal Breeding Consulting S.L., Parque Cientı´fico Tecnolo´ gico de Co´rdoba, España, 4 Instituto de Investigacio´n y Formacio´n Agraria y Pesquera (IFAPA), Alameda del Obispo, Co´rdoba, España, 5 Universidad Nacional de Colombia - Sede Palmira, Palmira Colombia,
6 Universidad Nacional de Loja, Loja, Ecuador
Abstract
Macabea cattle are the only Bos taurus breed that have adapted to the wet tropical condi-tions of the Amazon. This breed has integrated into the culture of the indigenous Shuar-Asuar nations probably since its origins, being one of the few European zoogenetic resources assimilated by the deep-jungle Amazon communities. Despite its potential for local endogenous sustainable development, this breed is currently endangered. The pres-ent study used molecular genetics tools to investigate the within- and between-breeds diversity, in order to characterize the breed population, define its associations with other breeds, and infer its origin and evolution. The within-breed genetic diversity showed high values, as indicated by all genetic parameters, such as the mean number of alleles (MNA = 7.25±2.03), the observed heterozygosity (Ho = 0.72±0.02) and the expected heterozygosity (He = 0.72±0.02). The between-breeds diversity analysis, which included factorial corre-spondence analysis, Reynolds genetic distance, neighbor-joining analysis, and genetic structure analysis, showed that the Macabea breed belongs to the group of the American Creoles, with a Southern-Spain origin. Our outcomes demonstrated that the Macabea breed has a high level of purity and null influences of exotic cosmopolitan breeds with Euro-pean or Asiatic origin. This breed is an important zoogenetic resource of Ecuador, with rele-vant and unique attributes; therefore, there is an urgent need to develop conservation strategies for the Macabea breed.
Introduction
The group of the American Creole cattle breeds, which were formed in the American continent after the European colonization [1], represents an important economic resource for marginal areas of South America; however, these breeds are still not well characterized. Macabea cattle, named after the Macas Province in Ecuador, is a singular breed adapted to the wet tropic of the Amazon, integrated as a patrimony of the indigenous nationalities.
a11111
OPEN ACCESS
Citation: Vargas J, Landi V, Martı´nez A, Go´mez M,
Camacho ME, A´lvarez LA´, et al. (2016) Molecular Study of the Amazonian Macabea Cattle History. PLoS ONE 11(10): e0165398. doi:10.1371/journal. pone.0165398
Editor: Axel Janke, Senckenberg am Meer
Deutsches Zentrum fur Marine Biodiversitatsforschung, GERMANY
Received: June 24, 2016 Accepted: October 11, 2016 Published: October 24, 2016
Copyright:© 2016 Vargas et al. This is an open access article distributed under the terms of the
Creative Commons Attribution License, which permits unrestricted use, distribution, and reproduction in any medium, provided the original author and source are credited.
Data Availability Statement: Data are available at
https://datadryad.org(doi:10.5061/dryad.1dh4c).
Funding: Support was provided by the Universidad
Estatal Amazonica [Proyect: evaluacion y contribucion al rescate de la biodiversidad de las razas bovinas y porcinas criollas autoctonas en la region amazonica del Ecuador].
Competing Interests: The authors have the
following interests. Vincenzo Landi, Mayra Gomez and Amparo Martinez are employed by Animal Breeding Consulting sl. Animal Breeding
The first arrival of cattle to America occurred in the second voyage of Columbus in 1493, which set sail from the south of the Iberian Peninsula [2]. After this first, other sporadic intro-ductions were carried out by the Spanish governorate and in the Portuguese colonies, through the Brazilian Capitanies [3]. All the Spanish and Portuguese breeds have a Bos Taurus origin. After the independence of the American colonies in the late 19th century, the British economic influence enabled the progressive introduction of Bos indicus breeds from the Asian colonies of the British Empire. Already at the beginning of the 20th century, Asiatic breeds such as Guzerat, Nelore, and Gyr had an extended distribution across the United States, Mexico, and Brazil [4].
Bos taurus and B. indicus have a common ancestor in the Aurochsen wild B. primigenius,
which marked the start of domestication approximately 11000 years ago [5], even though it commenced from two different domestication processes and geographical locations [6].
The Amazonian region was almost free of cattle until the 20th century, when farming prac-tices became more aggressive and sprawled into natural environments. At the same time, the introduction of Bos indicus animals became massive and indiscriminate, producing extensive deforestation especially in river basins. Today only few local breeds from Bos Taurus type exist one of this is the Ecuadorian Macabea breed. The animals from this breed present excellent meat attributes.
The origin of the Macabea breed is unknown. Presumably, they reached the Ecuadorian Amazon along with the Spanish incursions developed between 1540 and 1548 from Quito and Guayaquil [7]. However, European practices were not consolidated in the region until 1576, with the foundation of the Sevilla de Oro city, which was destroyed in 1599 by the Shuar-Achuar native nations [7]. Probably during this period, native communities assimilated some European resources, such as the precursors of the current Macabea breed.
Macabea cattle (Fig 1) are currently distributed in small herds composed by 1 to 10 individ-uals. The total number of herds and total number of individuals are unknown, but official reports classify this breed as in critical situation according to the FAO´s criteria [8].
Fig 1. Four of the Macabea bovines included in this study.
Consulting sl is involved in research programmes in cattle genetics/genomics and contributed to laboratory and statistical analysis for this work. There are no patents, products in development or marketed products to declare. This does not alter the authors’ adherence to all the PLOS ONE policies on sharing data and materials.
There are several enigmatic controversies around the genetics origins of Macabea breed, and in particular, if it should be admitted as a resource for the sustainable development of the Amazonian region. There is a persistent pressure from conservationist groups against the pres-ence of farm animals in the natural environment. The aim of this study was to genetically char-acterize the Macabea cattle breed based on microsatellites markers, in order to generate scientific data about this rare genetic resource and its genetic relation with other Creole or exotic breeds, searching for a geo-evolutionary explanation of its origin and dissemination. These findings would support the conservation of this important breed, and propose the Maca-bea breed as a resource for the endogenous sustainable development of the region, in terms of its excellent meat quality and its ability to adapt to the wet tropic. Microsatellite markers have been widely used for population genetic analyses of livestock species [9–11], as they are infor-mative and can successfully elucidate associations between individuals and populations, intro-gression from other populations, genetic differentiation, and admixtures between breeds [12–14].
Materials and Methods
Ethics Statement
Ethical approval was not needed for this study. All hair samples collections were non-invasive (hair roots) and carried out during routine veterinary visits in the farms on live animals. The fieldwork did not involve any endangered or protected species. Hair root were manually col-lected without any injury in the back of the animals No other kind of tissues (blood, meat or other) were used in this study.
Sampling and DNA extraction
Hair samples of 25 Macabea individuals (Fig 1)were randomly collected from eight herds (3–4 animal per herd and when applicable one male and 2 female) distributed in the 55,280 km2 area of the Amazonian Provinces of Pastaza and Morona Santiago, in Ecuador; in particular the following location were visited: Palora (long: -77.975505, lat: -1.720847°); Jimbitono (long: -78.177398°, lat: -2.260553°); Macas (long: -78.106919°, lat: -2.318572°); Puyo (long:
-78.046440°, lat: -1.530083°); Morona-Santiago (long: -78.289073°, lat: -2.556032°); All the farms were isolated, distributed in the deep-jungle, accessed only by river routes, and with a considerable distance between them (~50–100 km). Cattle owners belonged to the native nationality Shuar-Achuar, which still maintain strong traditional culture practices. After col-lection, hair samples were stored in labeled envelopes, and brought from the collecting point to the Universidad Estatal Amazónica (Puyo, Ecuador). DNA was extracted using three hair roots cut and incubated at 95°C during 15 minutes and at 99°C during 3 minutes in a 100 μl solution of Chelex100 resin (Bio-Rad, California, USA). After incubation, extracted DNA was con-served at –20°C until use.
Genotype analysis
A panel of 28 microsatellite markers (Table 1), selected on the basis of the recommendations issued by the FAO/International Society of Animal Genetics, were used to conduct studies on bovine genetic biodiversity [15]. The analysis was performed in the Laboratory of Applied Molecular Genetics of the Research Group PAI-AGR-218, in the University of Córdoba (Spain).
Data used in this paper have been archived at Dryad (www.datadryad.org): doi:10.5061/ dryad.1dh4c
We obtained data on different bovine breeds from the BIOBOVIS project (http://www. biobovis.jimdo.com); these breeds represented evolutionary branches to be tested to determine the genetic origin and the evolutionary associations of Macabea. Data are deposited and avail-able at Laboratory of Applied Molecular Genetics. As outgroup-breeds, we chose the Rubia Gallega (RGA), which represents Celtic animals from northern Spain, and the Berrenda en Colorado (BC) and the Marismeña (MA), both representing southern Spanish resources. In theory, Macabea cattle reached the Amazon with colonizers from the Pacific coast; therefore, we included the Ecuadorian Creole Ecuadorian of Southern (EC) and the Colombian Creoles Hartón del Valle (HV), and Blanco Orejinegro (BON). In order to test recent influences of cos-mopolitan European breeds specialized in milk and beef production, we included the most influential breeds of these groups in the region: Hereford (HER), Brown Swiss (BWS), Holstein (HOL), Jersey (JER), Simmental (SIM), and Charolaise (CHAR). Finally, to test the possible Table 1. Outcomes of the Microsatellite Analysis.
Microsatellite NA He Ho PIC FIS P-value
BM1314 6 0.731 0.680 0.671 0.072 0.250 BM1818 6 0.477 0.520 0.425 -0.093 0.437 BM1824 4 0.666 0.600 0.600 0.101 0.084 BM2113 8 0.839 0.720 0.801 0.145* 0.020* BM8125 5 0.578 0.640 0.527 -0.110 0.598 CRSM60 8 0.739 0.760 0.694 -0.029 0.670 CSSM66 10 0.898 1.000 0.866 -0.117 0.073 ETH003 8 0.851 0.920 0.813 -0.082 0.379 ETH010 7 0.746 0.800 0.691 -0.074 0.686 ETH185 6 0.456 0.440 0.410 0.035 0.0130* ETH225 7 0.774 0.800 0.720 -0.035 0.663 HAUT24 7 0.753 0.720 0.699 0.044 0.417 HAUT27 10 0.810 0.800 0.769 0.012 0.253 HEL09 8 0.790 0.800 0.741 -0.013 0.779 HEL13 5 0.659 0.760 0.607 -0.157 0.311 ILSTS006 9 0.839 0.909 0.798 -0.085 0.156 ILSTS011 6 0.734 0.680 0.678 0.075 0.274 INRA023 8 0.813 0.880 0.769 -0.084 0.852 INRA032 7 0.740 0.680 0.689 0.082 0.493 INRA035 4 0.602 0.280 0.503 0.540* 0.00* INRA037 9 0.771 0.667 0.719 0.138 0.275 INRA063 5 0.654 0.560 0.576 0.146 0.096 MM12 8 0.738 0.800 0.679 -0.086 0.075 SPS115 6 0.614 0.840 0.558 -0.379* 0.284 TGLA053 8 0.684 0.520 0.629 0.244* 0.007* TGLA122 12 0.848 0.800 0.812 0.058 0.408 TGLA126 5 0.735 0.667 0.666 0.095 0.927 TGLA227 11 0.855 0.880 0.819 -0.030 0.925 Mean 7.3 0.728 0.719 0.676 0.015 0.372 *Significance value (P<0.05);
NA: number of alleles detected; He: unbiased expected heterozygosities; Ho: observed heterozygosities (Ho); PIC: content of polymorphic information; P-value: probability values obtained in the Hardy-Weinberg equilibrium test.
influence of the zebuine expansion in the Amazon on the Macabea breed, the Brahman (BRH), Gyr (GYR), Nellore (NEL), and Cuban Zebu (ZEBU) were also used in this study. To explore the between-breeds diversity, we used 621 genotypes belonging to outgroup-animals. This information, and the individual breeds sample sizes are shown inTable 2.
Statistical analysis
Within-breed diversity. To explore the within-breed genetic diversity in the Macabea, we calculated allelic frequencies, observed heterozygosity (Ho), unbiased expected heterozygosity (He), the average number of alleles (Na) and the content of polymorphic information (PIC) for the breed and for each marker by means of using the Microsatellite Toolkit software [16]. The Fis coefficient for Macabea (Weir and Cockerham, 1984) was calculated using the software Genetix v.4.05.2 [17]. The Hardy-Weinberg(HW) equilibrium test was performed using the Genepop software v. 4.2 [18], which apply the Fisher-exact-test based on the Markov chain Monte Carlo method [19].
Between-breed diversity. To infer the genetic relation between the Macabea breed and all the determined outgroups, we performed a factorial correspondence analysis (FCA) using the Genetix v. 4.05.2 software [17]. In addition, the pair-wise Fst and the Reynolds genetic dis-tances between populations were calculated [20] by means of using Populations v.1.2.28 soft-ware [21]. The calculation and graphical representation of the Fst matrix were performed using the Arlequin software v.3.5[22]. Based on the obtained genetic distance-matrix, we constructed a neighbor-joining dendrogram (neighbor-net) with SplitsTree v. 4.0 software [23]. The genetic Table 2. Biodiversity Parameters of the 17 Analyzed Breeds.
Population SZ NA AR He Ho FIS HW BON 25 5.74±1.76 5.28 0.70±0.02 0.74±0.02 -0.06 1 HV 22 7.74±1.73 7.24 0.78±0.02 0.78±0.02 0.00 2 EC 58 9.47±2.44 7.64 0.79±0.02 0.72±0.01 0.09* 4 RGA 50 7.47±1.95 6.12 0.71±0.03 0.70±0.01 0.02 1 BC 40 7.68±2.16 6.76 0.78±0.02 0.73±0.02 0.06* 1 MA 50 7.79±2.55 6.19 0.74±0.02 0.72±0.01 0.02 1 HER 88 6.63±1.54 5.27 0.70±0.02 0.65±0.01 0.07* 2 JER 20 4.79±1.03 4.57 0.65±0.03 0.67±0.02 -0.03 1 BWS 29 6.79±2.15 6.10 0.73±0.02 0.74±0.02 -0.02 2 CHAR 58 6.95±1.99 5.79 0.71±0.03 0.68±0.01 0.03 1 FRI 50 6.89±2.40 5.82 0.71±0.03 0.73±0.01 -0.02 1 SIM 19 6.16±1.92 5.88 0.67±0.03 0.65±0.03 0.03 2 GYR 36 7.00±1.94 5.97 0.67±0.03 0.62±0.02 0.07* 4 BRH 41 7.74±2.40 6.33 0.70±0.02 0.68±0.02 0.03 3 NEL 49 6.89±1.94 5.41 0.63±0.02 0.59±0.02 0.07* 7 ZEBU 50 7.53±2.06 6.28 0.71±0.04 0.71±0.01 -0.00 4 MAC 25 7.79±2.02 6.92 0.73±0.03 0.73±0.02 0.01 3 Mean 42 7.13±2.00 6.23 0.70±0.02 0.74±0.02 0.03* *: Significant value (P<0.05);
SZ: sample size; NA: total number of alleles; AR: allelic richness (considering 16 samples); He: expected heterozygosity; Ho: observed heterozygosity; FIS: fixation index within population; HW, Hardy-Weinberg equilibrium (deviated loci per breed; P<0.05); BON: Blanco Orejinegro; HV: Harto´n del Valle; EC: Ecuadorian Creole Ecuadorian of Southern; RGA: Rubia Gallega; BC: Berrenda en Colorado; MA: Marismeña; HER: Hereford; JER: Jersey; BWS: Brown Swiss; CHAR: Charolais; FRI: Holstein Friesian; SIM: Simmental; ZEBU, Zebu; NE: Nelore; BRH: Brahman; GYR: Gyr; MAC: Macabea.
structure of the populations included in this study was explored using the Structure v. 2.3.4 software [24]. The parameters used were 200K iteration after 100K burn-in under the Admix-ture model with default settings. This program uses a Bayesian algorithm to calculate a
posteri-ori distribution of each individual admixture coefficient (q). The mean in this distribution
represents an estimation of the proportion of the parental population genome present in the individuals. This program develops a clustering of the individuals in different number of clus-ters (K), representing the number of populations admitted in an admixture model, in which each individual genome could content different percentages of the ancestral population genomes where they come from. Alternatively, two structure runs were carried out: in the first one, all breeds were included, and the results were displayed using Distruct v1.1 software [25] and the most likely numbers of group (K) were assessed by the Evano method [26]. In the graphical representation, each individual is represented by a vertical line divided in k colored segments, which represents the genotypic fractions of each inferred cluster. Secondly, we calcu-lated a structure run only including MAC, EC, BON and HV breeds, where we used the kriging interpolation method [27] to assess the correlation between assignment values and geographi-cal data. After this, the graphigeographi-cal library of statistigeographi-cal software R version 3.2.4[28] was used to display the maps, where each breed was represented by coordinates corresponding to the center of their geographical dispersion.
Results
Microsatellite markers
The microsatellites panel used in this study has been previously applied and proved in several cattle studies, conducted by our own research team [1,2,29]. This panel allowed the detection of 316 alleles, with a mean of 7.3±2 alleles/locus, with a global observed and expected heterozy-gosities of 0.72 and 0.73, respectively. The most polymorphic marker in terms of number of alleles was TGLA122, with a value of 12; meanwhile, the lesser polymorphic markers were BM1824 and INRA035 (4), both with a value of four. The expected heterozygosities by marker were high (Table 1), and ranged from a minimum of 0.456 (ETH185) to a maximum of 0.898 (CSSM66). The HW equilibrium was generally respected; in fact, only four markers (BM2113, ETH18, INRA035, TGLA053) presented significant deviations (Table 1).
Breed diversity
Most of the markers in the studied breeds were in HW equilibrium (Table 2); seven breeds showed only one marker out of the equilibrium, four breeds only two markers deviated, two breeds three, and three breeds showed four markers out of the equilibrium. Only Nellore breed presented a higher number of unbalanced markers, with seven. Overall, a mean of 2.35 markers deviated from the HW equilibrium. Macabea showed three deviated markers, slightly above the mean. The average F-statistics and their 95% confidence intervals (data not shown) obtained with 10,000 bootstraps over loci were: FIS= 0.03(0.02–0.05), FIT= 0.16(0.14–0.18),
and FST= 0.13(0.12–0.15). Macabea cattle showed a high mean of alleles, with a value 7.79
±2.02; the other Ecuadorian breed EC presented the highest value (9.47±2.44), and the lower value was detected in JER (4.79±1.03). This trend was confirmed by the allelic richness and the heterozygosity data (Table 2). The overall defect of heterozygous estimated by mean the FIS
index was low in all dataset (0.03) and significant (P<0.05). When observed by breed, the FIS
index from EC, BC, HER, GYR, and NEL breeds showed slightly significant values, and with Macabea presented no significant deviation.
Between-breeds associations
S1 Tablepresents the results of the two genetic distances between the studied breeds explored (FISand Reynolds distances). In both cases, Macabea showed extreme distances in respect to
the zebuine breeds, and a close position in respect to the EC and the Colombian breeds (HV and BON). These results are supported byFig 2, where FSTpairwise-distances are graphically
represented by using a color gradient matrix. Two clusters belonging to the Bos indicus and
Bos taurus cattle types are visible. In this scenario, Macabea cattle breed showed very large
dis-tances with respect to all the Bos indicus breeds, with FSTvalues ranging between 0.18 and
0.23, and between 0.18 and 0.21 for Reynolds distances. In general, Macabea breed also showed important distances in respect the other international Bos taurus breeds, with FST
val-ues ranging between 0.07 and 0.15, and between 0.06 and 0.14 for Reynolds distances. The shorter distance of Macabea with international breeds was detected in respect to the BWS breed. The Spanish outgroups RGA (representing the Celtic breeds from the northern Spain), and the MA and BC (Southern-Spain breeds) showed diverse patterns of distances with MAC, being the southern breeds closer than the northern breeds, with FSTvalues of 0.06, 0.08, and
0.11, respectively, and Reynolds distances of 0.06, 0.08 and 0.10, respectively. Finally, the group that was detected to be the most related to Macabea was formed by the other Creoles, in particular, the Colombian HV and the EC (both at FST 0.04; 0.04 and 0.036 of Reynolds dis-tance respectively).
Analysis of molecular variance [22,30,31] were performed considering two levels of classifi-cation; the first one, grouped by breed branch (Bos taurus vs. Bos indicus); and the second level Fig 2. Pairwise FSTdistance matrix graphical representation.
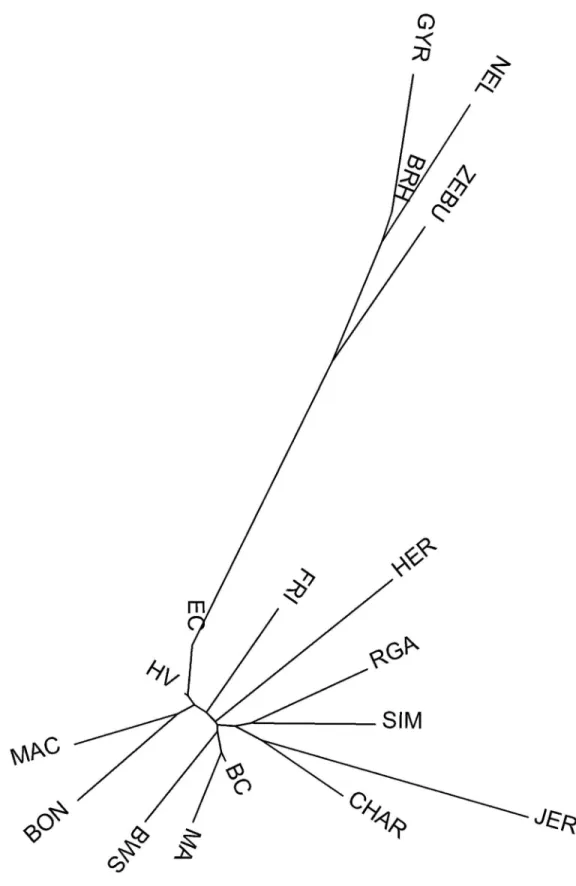
considered each geographical origin (i.e., Bos indicus and international breeds were considered as two separate groups).Table 3shows that the highest percentage of variation was always within-breeds, with a value of 80.03% and 83.90% for phylogenetic and geographical groups comparisons, respectively (P<0.01). Variation between-groups were 11.67% (P <0.05) and 7.86% (P<0.01) for the phylogenetic and geographical groups comparisons, respectively. The results of the factorial correspondence analysis conducted with all the studied breeds, and then avoiding the zebuines, both supported the results obtained in the AMOVA: breeds were grouped in the space according to their phylogenetic origin (Fig 3). The distance tree (Fig 4), constructed with the individual Reynolds distances by using the neighbor-joining algorithm, also showed congruent results with respect to the geographic and phylogenetic origins: all zebuine breeds occupied similar distance-branch, and Macabea was close to the other Creoles, particularly with HV. There was no relevant influence from other international Bos taurus or
Bos indicus breeds on Macabea.
Neighbor-joining dendrogram (Fig 4) based on Reynolds distances between the 17 studied breeds, showed large distances between zebuins and taurines. Macabea formed a cluster with its Colombian neighbor BON, proximal to the other regional Creoles HV and EC. However,
Fig 4does not clearly define which breed group (Spanish or international ones) has more influ-enced the origin of Macabea. Results of the genetic structure analysis represented inFig 5are eloquent in respect to the definition of the breeds. From k2, the differentiation between zebuines and taurines is evident; from k3, the structure of the different breeds is beginning to be definite; and in k17, all the structures of the studied breeds are evident. The most likely K value as indicated by the Evano method was K = 14 even though a higher peak was visible at K = 3 (S1 Fig).
Table 3. Outcomes from the Analysis of Molecular Variance: results are expressed as a percentage of explained variance and resulting fixation indices, comparing within- and between-breeds accord-ing to their phylogenetic and geographical origins.
factor considered
phylogenetic geography
sum of square/ degree of freedom
among groups 537.214/1 654.406/3 AMONGBREEDSWITHINGROUP 849.924/15 732.732/13 WITHINBREED 8642.129/1403 8642.129/1403 variance components among groups 0.90 0.60 AMONGBREEDSWITHINGROUP 0.61 0.60 WITHINBREED 6.15 6.16 percentage variation among groups 11.67** 7.86*** AMONGBREEDSWITHINGROUP 8.03*** 8.24*** WITHINBREED 80.30*** 83.90*** f-statistics AMONGGROUP (FCT) 0.20 0.16
among breeds within group (fsc) 0.10 0.10
among breeds total variability (fst) 0.12 0.10
***: P-value<0.001, **: P-value<0.005
Geographical representation of the interpolation of the admixture coefficient (Q matrix), using as reference the clusters k2 and k3, results very illustrative.Fig 6shows the close relation of Macabea and its equidistant position in respect to the pacific Colombian Creoles (BON and HV) in the north, and with the EC in the south.
Discussion
We described a unique cattle breed adapted in a tropical environment of Ecuador. The impor-tance of this genetic resource goes further in the field of biodiversity conservation; in fact, these animals reared in extremely marginal areas, with low technological inputs, demonstrate a unique capacity of adaptation to produce high quality beef in the wet tropics, intended as a money reservoir for native nationalities. In general, the daily protein consumption of families is sustained through hunting, fishing, and pigs and chicken. The cattle, however, are often con-verted into money when needed by the family. The official recognition supported by the molec-ular findings could add value to this particmolec-ular economy and improve the quality of life of the disadvantaged population.
Within-breed diversity results supplied robust and important arguments to support Maca-bea conservation status. We must first highlight that only four of our 28 markers were not in HW equilibrium; this outcome denotes a genetic stability in the population that corresponds to a consolidated breed with no recent bottleneck or migration events. Other general parameters also support this hypothesis, such as the mean number of alleles, all of which reflect a high level of within-breed variability. These general parameters were higher than those previously reported for European breeds [11,14,32,33], but were similar to values previously described for other Latin American breeds [34,35].
Fig 3. Graphic representation of the factorial correspondence analysis results. a) Factorial correspondence analysis results
involving the 17 cattle breed populations; and b) factorial correspondence analysis results without Bos indicus breeds. In a) Red: ZEBU; Green: GYR. BRH. NEL; Blue: BON, HV. EC, RGA. BC, MA, HER, JER, BWS, CHAR, FRI, SIM, MAC; in b) Red: MAC; Green: HER; Blue: BON, HV, EC, RGA, BC, MA, JER, BWS, CHAR, FRI, SIM.
Fig 4. Neighbor-joining dendrogram constructed from the Reynolds genetic distances between 17 cattle breeds. EC: Ecuadorian Creole Ecuadorian of Southern; HV: Harto´n del Valle; FRI: Holstein Friesian;
BON: Blanco Orejinegro; MA: Marismeña; BC: Berrendaen Colorado; BWS: Brown Swiss; SIM: Simmental; HER: Herford; CHAR: Charolais; JER: Jersey; RGA: Rubia Gallega; MAC: Macabea; ZE: Zebu; NEL: Nellore; BRH: Brahman; GYR: Gyr.
Cattle reached Ecuador from Panama during the beginning of the regional Spanish conquest arriving directly to the Caribbean Islands, which was the first point of cattle colonization in the Americas [36]. Probably, the first introduction of cattle to the Amazon derived from the Pacific coast, between the years of 1540 and 1548 [7], along with the Spanish conquest and colonization.
The panel of microsatellites markers used in the present study resulted highly informative and with sufficient statistical power for biodiversity studies as just described in different works on bovine species [2] suitable as showed by high allelic richness, and PIC levels (Table 1). Therefore, our panel is recommended for any other research on Creole biodiversity studies, confirming previous findings of our own team developed with American Creole cattle [1]. Fig 5. Graphic representation of the genetic structure analysis of the 17 cattle breeds. In each K graphic, the color represents the
genetics partition found by the software. doi:10.1371/journal.pone.0165398.g005
Fig 6. Geographical representation of the interpolation of admixture coefficients (Q matrix) for clusters k2 and k3 including MAC, EC BON and HV breeds only. Each color represents the genetics partitions spotted on geographical surface through Kriging
algorithm.
The general FISvalues, which were undistinguishable from cero, demonstrated a general
HW equilibrium. These results indicated that Macabea presents a level of genetic differentia-tion that is sufficient to be considered as an independent breed, according to internadifferentia-tional con-ventions [37]. Thus, Macabea is revealed as an important genetic resource belonging to the Ecuadorian patrimony, and further efforts should be made to recognize, protect, and promote this breed.
Once covered the objective of breed-genetic characterization by means of the within-breed diversity study, the second purpose of this study was to explore Macabea phylogenetic evolu-tion. This second objective was tackled by means of the between-breeds diversity study, taking into account representatives of all branches used as outgroups, representing different hypothe-sis of the origin, genetic relationships, and evolution of the Macabea breed. The results of the Reynolds and FSTdistances were robust: we demonstrated the no existence of zebuines breeds
introgression on Macabea, which remark its resistance despite a challenging context with mas-sive introductions of zebuines in the region. In addition, we demonstrated the isolation of Macabea breed with respect of previous introductions of international Bos taurus breeds, highly specialized in meat or dairy productions.
Our results on the genetic association of the Macabea with the Spanish breeds, both the southern and northern representatives, are very interesting and support the hypothesis of the traditional integration of the breed in the Shuar-Asuar culture (old “head reducers”). The rela-tionship between the Macabea cattle and the Shuar-Asuar communities, as pointed out by us earlier, probably started in 1599 when the city of Sevilla de Oro; the first European Amazonian settling founded in 1577, was destroyed by these native nationalities [7]. Currently, the Maca-bea breed displays the best adaptation ability to the wet tropics. However, because of its replacement with exotic zebuines, the breed is highly endangered.
There was a strong association of Macabea with southern Spanish breeds, supporting the hypothesis extracted from the chronicles, which described that the commercial trade between Spain and the American colonies was monopolized by the southern-Spanish ports for a long period [36,38]. Finally, the closeness of the Macabea with respect to the other creoles, the Colombian HV and BON, included in the study suggests that the origin of the breed would be consistent with the Amazon colonization history, that recall the Spanish expansions from the Pacific area (Figs2and4;S1 Table).
The outcomes from the factorial correspondence analysis support a strong integration of the Macabea with the South American Creoles, grouped with most of the Bos taurus members, in particular, when the zebuines were included (Fig 3). When zebuines were excluded, the asso-ciation among Creoles was magnified. The close proximity between Macabea and the BWS detected in the distance studies (S1 Table) was not supported by the factor correspondence analysis (Fig 3); meanwhile its association with the Spanish BC was reinforced in this analysis. These results support the idea that most of the Creoles originated in areas from the southern Spain, agreeing with previous studies [2,14].
We used the factorial correspondence analysis to investigate the associations between-breeds based on two different orientations: first, to test the influence of phylogeny on the diver-sity; and on the another hand, to explore the influence of the original geographical location on the diversity included in the present study. The molecular analysis of variance results suggests that both the phylogenetic origin and the geographical expansions determined the formation of the current diversity; however, the phylogenetic influence is stronger than the geographical evolution, at least in the present context.
Neighbor-joining representation, based on Reynolds distances, is also much illustrative. In
Fig 4, Bos taurus and Bos indicus branches resulted clearly separated, showing that the admix-ture between both original branches is still not generalized, despite the current zebuine
expansion across the continent. The definition of the Macabea as a homogenous breed, its geo-evolutionary relation with other Creoles, and the association in its origin with the BC are also supported by these findings. Macabea breed was isolated in respect to the representatives of the European cosmopolitan breeds and zebuines, which currently represent the most important of the Creole genetic erosive effects [2]. In other words, the Amazonian isolation in which deep-jungle native communities are located, have acted as a protection to the extended indiscrimi-nant and anarchical crossbreeding of cattle in the region.
In addition, we obtained conclusive outcomes from the structure analysis, taking into account that this technique evaluates the level of admixture among individuals from a popula-tion based on the individual genetic composipopula-tion; thus, based on the within-variability, esti-mates different levels of influence by other populations. In this analysis, as part of the expected likely value of K around the number of breeds included (S1 Fig), we obtained a higher peak at K = 3, which could be interpreted as the effect of the strong differentiation introduced with the zebuine breed types. A first cluster was formed by the Macabea, HV, and BC breeds, thus, sup-ports previous findings. Here, we did not register any other significant influences on the Maca-bea breed. In addition, we detected a clear sub-structure within the MacaMaca-bea population, consisting in two subpopulations. This should be considered for the development of a genetic management plan that aims to maintain the maximum level of genetic diversity.
Finally, the representation of the interpolation of admixture coefficients (Fig 6) supports the hypothesis of a cattle expansion from the Pacific areas through the Amazon region, conse-quently originating the Macabea breed.
Conclusions
Macabea breed presented molecular genetics parameters that demonstrated genetic stability, typical of differentiated breeds. This finding, together with its position in all the between-popu-lation diversity tests developed, supports the suggestion of the Macabea being an important breed integrated as an Ecuadorian zoogenetic patrimony, in particular for the Shuar-Asuar nationalities. These outcomes justify an urgent call for action to the authorities, NGOs, or the private sector to recognize, protect and to valuate these animals and their products.
In the present study, we demonstrated that the Macabea breed originated from Spanish cat-tle populations located in the Pacific coastal regions of Colombia and Ecuador during the early period of colonization. These cattle populations reached the Amazon along with the first Span-ish attempts of colonization and were further introduced in the local native nationalities during the invasion and interactions that occurred at the end of the 16th century. Nevertheless, these evidences need to be reinforced in the future by means of Y-Chromosome and mitochondrial marker studies.
Macabea breed showed a high level of purity; thus, until now, it has avoided the strong influ-ences of modern exotic breeds that have extended across the region, in particular the zebuines. Finally, we need to highlight the importance of the sub-structure detected in the Macabea. In a population without migrations, this sub structure is a positive finding, because it reflects high level of genetic diversity, which must be considered in further conservation programs.
Supporting Information
S1 Fig. Delta K plot following the Evano et al (2005) method, indicating the most likely number of K in Structure analysis software.
S1 Table. Pairwise Genetic Distances between Populations According to the Model of Rey-nolds (1983) (Upper Diagonal) and FST(Lower Diagonal).
(DOCX)
Acknowledgments
The authors acknowledge the CONBIAND Network, and specially the BIOBOVIS Consortium for their support in supplying data and samples. A special acknowledge to Olivier François (Grenoble INP, La Tronche, France) for his support in GIS statistics and R software programming.
Author Contributions
Conceptualization: JVD JV VL. Formal analysis: AM VL MG. Investigation: VL MEC LAA LA MG. Methodology: VL AM.
Resources: AM JVD VL JV. Visualization: VL MG.
Writing – original draft: VL JVD. Writing – review & editing: VL.
References
1. Delgado JV, Martı´nez AM, Acosta A, Alvarez LA, Armstrong E, Camacho E, et al. Genetic characteri-zation of Latin-American Creole cattle using microsatellite markers. Animal Genetics. 2012; 43(1):2– 10. doi:10.1111/j.1365-2052.2011.02207.xPMID:22221019
2. Martinez AM, Gama LT, Canon J, Ginja C, Delgado JV, Dunner S, et al. Genetic footprints of Iberian cattle in America 500 years after the arrival of Columbus. PLoS One. 2012; 7(11):e49066. Epub 2012/ 11/17. doi:10.1371/journal.pone.0049066PONE-D-12-01789 [pii]. PMID:23155451; PubMed Central PMCID: PMC3498335.
3. Primo AT. El ganado bovino Ibe´rico en las Americas: 500 años despue´s. (The Iberic cattle in the Amer-icas: 500 years later). Archivos de Zootecnia. 1992; 41:421–32.
4. Villalobos-Corte´s A, Martı´nez A, Vega-Pla JL, Landi V, Quiroz J, Marques JR, et al. Genetic Relation-ships Among Five Zebu Breeds Naturalized in America Accessed with Molecular Markers. Italian Jour-nal of Animal Science. 2015; 14(2):3280. doi:10.4081/ijas.2015.3280
5. Clutton-Brock J. A natural history of domesticated mammals. Cambridge: Cambridge University Press; 1999.
6. Bradley DG, Loftus RT, Cunningham P, MacHugh DE. Genetics and domestic cattle origins. Evolution-ary Anthropology: Issues, News, and Reviews. 1998; 6(3):79–86. doi:10.1002/(SICI)1520-6505 (1998)6:3<79::AID-EVAN2>3.0.CO;2-R
7. Rosset E. La conquista del Amazonas: La increı´ble odisea de la expedicio´n de Orellana. Conocido M, editor: Hondarribia; 2000.
8. FAO. The state of the world’s animal genetic resources for food and agriculture. Rome: 2007.
9. Ceccobelli S, Di Lorenzo P, Lancioni H, Castellini C, Monteagudo Iba´ñez LV, Sabbioni A, et al. Phylog-eny, genetic relationships and population structure of five Italian local chicken breeds. 2013. 2013; 12 (3). Epub 2013-07-09. doi:10.4081/ijas.2013.e66
10. Salamon D, Gutierrez-Gil B, Arranz JJ, Barreta J, Batinic V, Dzidic A. Genetic diversity and differentia-tion of 12 eastern Adriatic and western Dinaric native sheep breeds using microsatellites. Animal. 2014; 8(2):200–7. Epub 2014/01/18. S1751731113002243 [pii] doi:10.1017/S1751731113002243
11. Martin-Burriel I, Rodellar C, Canon J, Cortes O, Dunner S, Landi V, et al. Genetic diversity, structure, and breed relationships in Iberian cattle. J Anim Sci. 2011; 89(4):893–906. Epub 2011/03/19. 89/4/893 [pii] doi:10.2527/jas.2010-3338PMID:21415418.
12. Abdul-Muneer PM. Application of microsatellite markers in conservation genetics and fisheries man-agement: recent advances in population structure analysis and conservation strategies. Genet Res Int. 2014; 2014:691759. Epub 2014/05/09. doi:10.1155/2014/691759PMID:24808959; PubMed Cen-tral PMCID: PMC3997932.
13. Tapio I, Varv S, Bennewitz J, Maleviciute J, Fimland E, Grislis Z, et al. Prioritization for conservation of northern European cattle breeds based on analysis of microsatellite data. Conservation Biology. 2006; 20(6):1768–79. doi:10.1111/j.1523-1739.2006.00488.xPMID:17181812
14. Ginja C, Telo Da Gama L, Penedo MC. Analysis of STR markers reveals high genetic structure in Por-tuguese native cattle. J Hered. 2010; 101(2):201–10. Epub 2009/12/08. esp104 [pii] doi:10.1093/ jhered/esp104PMID:19965912.
15. FAO. Secondary guidelines for development of national farm animal genetic resources plans. Roma: FAO, 2004.
16. Park SDE. Trypanotolerance in West African Cattle and the Population Genetic Effects of Selection Dublin: University of Dublin; 2001.
17. Belkhir K, Borsa P, Chikhi L, Raufastey N, Bonhomme F. Genetix: 4.05 Logiciel sous WindowsTM pour la genetique des populations. In: Montpellier U. d. (ed.) Montpellier, France2003.
18. Raymond M, Rousset F. GENEPOP (Version 1.2): Population genetics software for exact test and ecumenicism. Journal of Heredity. 1995; 86(3):248–9.
19. Guo SW, Thompson EA. Performing the exact test of Hardy-Weinberg proportions for multiple alleles. Biometrics. 1992; 48:361–72. PMID:1637966
20. Reynolds J, Weir BS, Cockerham CC. Estimation of the coancestry coefficient: basis for a short-term genetic distance. Genetics. 1983; 105:767–79. PMID:17246175
21. Langella O. Population Genetic Software (Individuals or Populations Distances, Phylogenetic Trees) 1999 [updated 12/5/2002]. Available:http://www.bioinformatics.org/download.php?fileid=430.
22. Excoffier L, Lischer HE. Arlequin suite ver 3.5: a new series of programs to perform population genetics analyses under Linux and Windows. Molecular Ecology Resources. 2010; 10(3):564–7. Epub 2011/ 05/14. doi:10.1111/j.1755-0998.2010.02847.xPMID:21565059.
23. Huson DH, Bryant D. Application of phylogenetic networks in evolutionary studies. Mol Biol Evol. 2006; 23:254–67. doi:10.1093/molbev/msj030PMID:16221896
24. Pritchard JK, Stephens M, Donnelly P. Inference of Population Structure Using Multilocus Genotype Data. Genetics. 2000; 155(2):945–59. PMID:10835412
25. Rosenberg NA. Distruct: a program for the graphical display of structure results. Available:http://www. cmb.usc.edu/»noahr/distruct.html. 2002.
26. Evanno G, Regnaut S, Goudet J. Detecting the number of clusters of individuals using the software STRUCTURE: a simulation study. Molecular ecology. 2005; 14(8):2611–20. doi: 10.1111/j.1365-294X.2005.02553.xPMID:15969739.
27. Jay F, Manel S, Alvarez N, Durand EY, Thuiller W, Holderegger R, et al. Forecasting changes in popu-lation genetic structure of alpine plants in response to global warming. Molecular ecology. 2012; 21 (10):2354–68. doi:10.1111/j.1365-294X.2012.05541.xPMID:22512785.
28. R Core Team. R: A Language and Environment for Statistical Computing. 2012.
29. Canon J, Alexandrino P, Bessa I, Carleos C, Carretero Y, Dunner S, et al. Genetic diversity measures of local European beef cattle breeds for conservation purposes. Genet Sel Evol. 2001; 33:311–32. doi:
10.1051/gse:2001121PMID:11403750 30. Weir BS. Genetic Data Analysis. 1990.
31. Weir BS, Cockerham CC. Estimating F statistics for the analysis of population structure. Evolution. 1984; 38:1358–70.
32. Caño´n J, Garcı´a D, Delgado JV, Dunner S, Telo da Gama L, Landi V, et al. Relative breed contribu-tions to neutral genetic diversity of a comprehensive representation of Iberian native cattle. Animal. 2011; 5(9):1323–34. doi:10.1017/S1751731111000267PMID:22440277
33. Mateus JC, Penedo MCT, Alves VC, Ramos M, Rangel-Figueiredo T. Genetic diversity and differentia-tion in Portuguese cattle breeds using microsatellites. Animal Genetic. 2004; 35:106–13.
34. Liron JP, Peral-Garcia P, Giovambattista G. Genetic characterization of Argentine and Bolivian Creole cattle breeds assessed through microsatellites. Journal of Heredity. 2006; 97(4):331–9. Epub 2006/06/ 24. esl003 [pii] doi:10.1093/jhered/esl003PMID:16793865.
35. Egito A, Paiva S, Albuquerque MdS, Mariante A, Almeida L, Castro S, et al. Microsatellite based genetic diversity and relationships among ten Creole and commercial cattle breeds raised in Brazil. BMC Genetics. 2007; 8(1):83. doi:10.1186/1471-2156-8-83PMID:18067665
36. Villalobos Corte´s AI, Martı´nez AM, Escobar C, Vega-Pla JL, Delgado JV. Study of genetic diversity of the Guaymi and Guabala bovine populations by means of microsatellites. Livestock Science. 2010; 131 45–51.
37. FAO. Secondary Guidelines for Developmen of National Farm Animal Genetic Resources Manage-ment Plans: Managemen of small populations at risk. Rome. Italy: FAO, 2005.
38. Rodero A, Delgado JV, Rodero E. Primitive andalusian livestock an their implications in the discovery of America. Archivos de Zootecnia. 1992; 41 (Extra):383–400.