Abstract – Remifentanil is a new opioid derivative drug characterized by a fast onset and by a short time of action, since it is rapidly degraded by esterases in blood and other tissues. Its pharmacokinetic and pharmacodynamics properties make remifentanil a very interesting molecule in the field of anesthesia. However a complete and versatile pharmacokinetic description of remifentanil still lacks. In this work a three-compartmental model has been developed to describe the pharmacokinetics of remifentanil both in the case in which it is administered by intravenous constant-rate infusion and by bolus injection. The model curves have been compared with experimental data published in scientific papers and the model parameters have been optimized to describe both ways of administration. The ad hoc model is adaptable and potentially useful for predictive purposes.
Keywords – Remifentanil, pharmacokinetics, three -compartmental model.
I. INTRODUCTION
The topic of the development of new opioid anesthetic agents is ma inly to increase potency, and reduce the cardiovascular to xic ity. For this purposes, recently a new kind of opioid derivative drug, re mifentanil, has been synthetized. Re mifentanil is an ultra-short acting opioid and it is subjected to metabolism by esterases in blood and other tissues. In vivo studies demonstrated an e xtensive metabolism of this drug by ester hydrolysis [1]. The prima ry metabolic pathway e xperienced by re mifentanil is the format ion of a carboxy lic acid metabolite (na med GI90291) obtained by de-esterification. The che mica l structures of remifentanil and its primary metabolite are shown in Fig 1. It has been demonstrated on anima ls [1] that the pharmacodynamics of re mifentanil is very similar to the other opioid drugs, this fact, co mbined with the reduced effects on the cardiovascular system makes the use of remifentanil very attractive in anesthesia. Re mifentanil is generally administrated by the intravenous route. Because of the very short half-life of the drug, usually a bolus inject ion is administered to ra ise the blood concentration immed iately, then a slower intravenous infusion is used to ma intain the e ffective plasma concentration. Even if it is recommended to infuse remifentanil only during general anaesthesia procedures, the single/repeated bolus injections could be used in clinica l situation in which a brief period of intense analgesia is required and the set -up of a continuous infusion pump is difficult (i.e. painful diagnostic and therapeutic procedures outside the
operating theater). For th is reason, it is particularly interesting to model what happen in the plasma concentration of re mifentanil a fter the bolus injection or continuous infusion admin istration. Diffe rent kinds of models have been proposed, the simplest of which is the compart mental one [2], alternative ly, the physiologically based approach [3] is more co mple x and potentially more exhaustive.
Fig 1. Chemical structures of remifentanil and its metabolite. The aim of the present work is to develop and validate a new simp le model using the compartmental modeling approach to evaluate the re mifentanil plasma concentration in case of bolus injection and continuous infusion.
II. MODELING
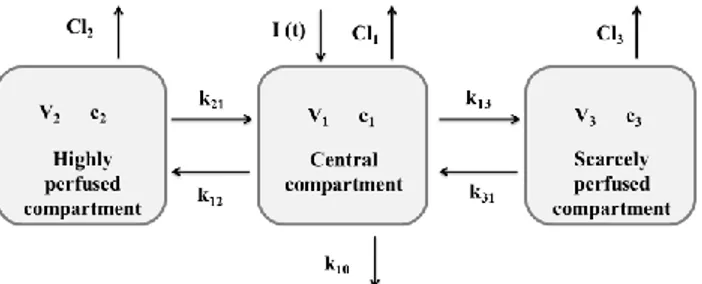
In the three-co mpart mental modeling, three compart ments describe the fate of a drug once administered: the central co mpart ment, which represents the plasma; the highly perfused compart ment, wh ich represents the organs and tissues highly perfused by the blood; and the scarcely perfused compart ment, wh ich represents the organs and tissues scarcely perfused by blood. A schematic of the model is shown in Fig 2.
Fig 2. A schematic of the three-compartmental model.
Pharmacokinetics of Remifentanil:
a three-compartmental modeling approach
Sara Cascone
1, Gaetano Lamberti
*1, Giuseppe Titomanlio
1, Ornella Piazza
2 1Dipartimento di Ingegneria Industriale, 2Dipartimento di Medicina e Chirurgia, Università di Salerno, Fisciano, Italy
To model the pharmacokinetic of re mifentanil, the case of intravenous infusion has been studied. Thus, an amount of drug has been evaluated as inlet in the central compart ment. The processes which cause the variation of the plasma concentration are: the absorption, the distribution, and the e xc retion of the drug. These phenomena have to be taken into account in the modeling.
I(t) is defined as the function which describes the drug
introduction by intravenous infusion (which could be an infusion at constant rate of administration or a bolus) in the central compart ment. The drug concentration in the compart ments could be evaluated solving the mass balance in the compartments, which could be written as:
Central compartment:
12 13 10 1
1 () 3 3 31 2 2 21 1 1 1 t I V C k k k V C k C V k C Cl dt dC V p Highly perfused compartment:
2 2 2 2 21 1 1 12 2 2 dt k C V k C V Cl C dC V
Scarcely perfused compartment:
3 3 3 3 31 1 1 13 3 3 dt k C V k C V Cl C dC V
In which, CP, C2, and C3 are, respectively, the drug concentrations of the central, high ly perfused, and scarcely perfused compart ments . V1, V2, and V3 are, respectively, the volu mes of the central, h ighly perfused, and scarcely perfused compart ments. Cl1, Cl2, and Cl3 are, respectively, the clearances (rates of drug elimination) of the central, h ighly perfused, and scarcely perfused compart ments. k12 and k21 are the transport coefficients between the central and the highly perfused compart ments; k13 and k31 are the transport coefficients between the central and the scarcely perfused compart ments. Finally, k10 is the kinetic constant of drug elimination fro m the central co mpart ment. The kinetics of elimination and transport between the compart ments have been considered first order kinetics. These equations have to be solved coupled with their initial conditions:
0 , 0 @ 0 , 0 @ 0 , 0 @ 3 2 C t C t C t P
The three equations are inter-dependent, thus, they have to be solved simultaneously to evaluate the drug concentration in all the compartments.
Once identified the transport phenomena which take place in the co mpart ments and defined the diffe rential equations able to solve the mass balances in the compart ments, the value of the para meters has to be evaluated. To evaluate the parameters value, the model has been used to fit the e xperimental data taken in literature [4, 5], which refe r both to intravenous infusion
and bolus. Defining an error between the e xperimental data and the model evaluation:
n i Pi i Pm Pi C t C C n 1 log , log log 1 p pIn which n is the number of e xpe rimental data for each experiment,
,pi Pm Pi C t
C is the diffe rence between the experimental plas ma concentration and the model pred iction at the t ime ti, p being the vector of the model para meters. Min imizing this function it is possible to find the values of the para mete rs which better approach the experimental data.
The set of three ODEs constituting the model have been solved by a code developed using Matlab, and the same software was used to find the value of p minimizing the function (p).
III. RESULTS
The model simulat ions obtained are shown in Fig 3 and compared with the e xpe rimental data [5] in the case of intravenous constant-rate infusion. Each curve has been obtained as average values due to the administration to two subjects. During the 20 minutes infusion, a total of 14 blood samples were taken. After stopping the infusion, 16 blood samples were taken, up to 240 min after the stop. Therefore, each history was described by 30 sample data. As could be seen fro m the graphs, the model reproduces satisfactorily the e xpe rimental data. In particular, the plas ma concentration following the administration of a dose of 1 µg∙kg-1∙min-1 is we ll approximated, however, the concentration of higher doses (4 and 8 µg∙kg-1∙min-1) are not well appro ximated for periods longer than 90 minutes, this is probably due to the fact that the supposed elimination kinetic could be still optimized.
Furthermore, the same model has been used to reproduce the remifentanil plasma concentrations in the case of bolus injection and compared with the e xperimental data [4] in Fig 4. In this case the administration has been evaluated as a fast infusion (bolus), thus the plasma concentration immediate ly rise to a high value. Each curve has been obtained as the average value over six patients (three men and three women). Over 360 minutes, 21 blood samples were collected and assayed for re mifentanil. Once again, the model curves satisfactorily approximate the experimental data.
Fig 3. Comparison between the experimental plasma concentration value [5] and the model curves in the case of intravenous constant -rate infusion with an infusion time of 20 minutes. a1) plasma concentration
after a dose of 1 µg∙kg-1∙min-1; a
2) plasma concentration after a dose of
4 µg∙kg-1∙min-1; a3) plasma concentration after a dose of 8 µg∙kg-1∙min-1.
Fig 4. Comparison between the experimental plasma concentration value [4] and the model curves in the case of fast intravenous infusion (bolus).
b1) plasma concentration after a dose of 2 µg∙kg-1;
b2) plasma concentration after a dose of 5 µg∙kg-1;
T ABLE I. Values and dimensions of the three-compartmental model parameters.
Parameter O ptimized value Parameter O ptimized value
V1 7.88 mL k10 0.172 min-1 V2 23.9 mL k12 0.373 min-1 V3 13.8 mL k21 0.103 min-1 Cl1 2.08 mL∙min-1 k13 0.0367 min-1 Cl2 0.828 mL∙min-1 k31 0.0124 min-1 Cl3 0.0784 mL∙min-1
The values of the model para meters obtained after the optimization routine, are shown in Table 1. The model developed has been used to evaluate the plasma concentration both in the case of intravenous constant-rate infusion and intravenous bolus, which has been reproduced simu lating a very fast infusion in the central compart ment. This is a re ma rkable imp rovement to the compart mental modeling: in fact, once the model parameters have been evaluated fo r a certa in
administration, the model is able to predict the drug plasma concentration varying not only the dose, but also the infusion rate of the drug.
Fig 4 (continue). Comparison between the experimental plasma concentration value [4] and the model curves in the case of fast
intravenous infusion (bolus).
b3) plasma concentration after a dose of 15 µg∙kg-1;
b4) plasma concentration after a dose of 30 µg∙kg-1.
IV. CONCLUSIONS
In this work a three-co mpart mental mode l has been developed to reproduce the evolution of re mifentanil plasma concentrations after intravenous constant-rate infusion and intravenous bolus . The main phenomena of absorption, distribution, and metabolis m have been identified and the mass balances for the three compart ments have been written. The model has been then used to reproduce plasma concentrations taken from literature and the best values of the model para meters have been found minimizing the error between model curves and experimental data.
Several studies have been conducted to develop a model which is able to reproduce the remifentanil pharmacokinetics. The aim of these studies is to compare
the measured pharmacokinetic features of re mifentanil after an intravenous infusion to the model predict ion [6]. In particu lar, the co mpart mental analysis has been e xtensively used and compared with the e xperimental data, taken after intravenous infusion [5] or bolus [4]. Blood concentration and time data after a co mputer-controlled infusion of re mifentanil could be analyzed by nonlinear regression using the NONM EM progra m (University of Ca liforn ia) [7] which may p roduce predicted and individually predicted values (post hoc Bayesian estimates). The initia l two-stage analysis comparing one-, two-, and three-compart menta l models found that the two-compartmental mode l shows the best fit to the e xperimental data. This result was also confirmed by a population analysis. A more co mp le x analysis of both pharmacokinetics and pharmacodynamics of re mifentanil has been also approached [8]. The pharmacokinetic/pharmacodynamic relat ionship has been evaluated using non-linear regression analysis. The pharmacokinetics have been described using a one-compart ment intravenous infusion model. Moreover, the pharmacodynamics have been fitted using inhib itory model. A statistical evaluation of the goodness of the models has been carried out following the Akaike Information Crite rion [9]. According to this analysis, the decrease of the SSE using a model with a la rge nu mber of parameters is useful if and only if it overcomes the increase in the nu mber o f para meters with respect to the use of a model with a limited nu mber of para mete rs. In this case, the simp le model has shown the best overall fitting results.
Nevertheless, once the value of the parameters has been evaluated, our simp le mode l was able to describe the re mifentanil concentration on blood for diffe rent ways of administration. This is a re markable imp rovement to the compartimental modelling: in fact once the model parameters have been evaluated for a ce rtain kind o f administration, the model is able to predict the drug plasma concentration varying not only the dose but also the infusion rate of the drug. This feature ma kes the model more versatile than the other available in literature and very useful for predictive purposes.
ACKNOWLEDGM ENT
This work was supported by the Ministero dell'Istruzione dell’Un iversità e della Ricerca (contract grant number PRIN 2010/2011 - 20109PLMH2).
REFERENCES
[1] P. S. Glass, D. Hard man, Y. Ka miya ma, T. J. Quill, G. Marton, K. Donn, C. Grosse and D. Hermann, “ Preliminary Pharmacokinetics and Pharmacodynamics of an Ultra ‐ Short ‐ Acting Opioid Re mifentanil (GI87084B)”, Anesthesia & Analgesia, Vol. 77, no. 5, pp. 1031-1040, 1993
[2] M. Di Muria, G. La mbe rti and G. Tito manlio , “Modeling the pharmaco kinetics of extended release pharmaceutical systems”, Heat and Mass Transfer, Vo l. 45, no. 5, pp. 579-589, 2009
[3] S. Cascone, F. De Santis, G. La mbe rti and G. Tito manlio, “The influence of d issolution conditions on the drug ADME phenomena”, European Journal of
Pharmaceutics and Biopharmaceutics, Vo l. 79, no. 2, pp.
382-391, 2011
[4] C. L. Westmore land, J. F. Hoke , P. S. Sebel, C. C. Hug Jr and K. T. Mu ir, “Pharmacokinetics of remifentanil (GI87084B) and its ma jor metabolite (GI90291) in patients undergoing elective inpatient surgery”,
Anesthesiology, Vol. 79, no. 5, pp. 893, 1993
[5] T. D. Egan, H. Le mmens, P. Fiset, D. J. Hermann, K. T. Muir, D. R. Stanski and S. L. Shafer, “The pharmacokinetics of the new short-acting opioid re mifentanil (GI87084B) in healthy adult male volunteers”, Anesthesiology, Vol. 79, no. 5, pp. 881, 1993 [6] A. Kapila, P. S. Glass, J. R. Jacobs, K. T. Muir, D. J. He rmann, M. Shiraishi, S. Ho well and R. L. Smith, “Measured context-sensitive half-times of remifentanil and alfentanil”, Anesthesiology, Vol. 83, no. 5, pp. 968, 1995
[7] D. R. Drover and H. J. Le mmens, “Population pharmacodynamics and pharmacokinetics of re mifentanil as a supplement to n itrous oxide anesthesia for e lective abdominal surgery”, Anesthesiology, Vo l. 89, no. 4, pp. 869-877, 1998
[8] M. Dershwitz, J. F. Ho ke, C. E. Rosow, P. Michalowski, P. M. Connors, K. T. Muir and J. L. Dienstag, “Pharmacokinetics and pharmacodynamics of re mifentanil in volunteer subjects with severe liver disease”, Anesthesiology, Vol. 84, no. 4, pp. 812-820, 1996
[9] H. Aka ike, “A new look at the statistical model identification”, Automatic Control, IEEE Transactions on, Vol. 19, no. 6, pp. 716-723, 1974
![Fig 4. Comparison between the experimental plasma concentration value [4] and the model curves in the case of fast intravenous infusion (bolus)](https://thumb-eu.123doks.com/thumbv2/123dokorg/7209979.76412/3.893.111.403.106.999/comparison-experimental-plasma-concentration-value-curves-intravenous-infusion.webp)
![Fig 4 (continue). Comparison between the experimental plasma concentration value [4] and the model curves in the case of fast](https://thumb-eu.123doks.com/thumbv2/123dokorg/7209979.76412/4.893.108.406.170.752/continue-comparison-experimental-plasma-concentration-value-model-curves.webp)
