Department of Pharmacy
INTERNATIONAL RESEARCH DOCTORATE PROGRAM IN
MOLECULAR PHYSIOPATHOLOGY, DIAGNOSIS AND
THERAPY OF METABOLIC DISEASES
Coordinator: Prof. Maurizio Bifulco
XII cycle NS
2010–2013
The transcription factor Prep1
regulates adipose tissue functions
Tutor: PhD Student:
I
TABLE OF CONTENTS
LIST OF PUBLICATIONS ... 3 LIST OF ABBREVATIONS ... 5 ABSTRACT ... 7 1.BACKGROUND ... 9 1.1 Adipose Tissue ... 9 1.2 Adipogenesis ... 101.3 Molecular regulators of adipogenesis ... 12
1.3.1 C/EBP family of transcriptional factors ... 13
1.3.2 PPARγ ... 15
1.4 A transcriptional cascade regulates adipocytes differentiation ... 17
1.5 Adipocytes metabolism ... 19
1.5.1 Insulin signaling ... 19
1.6 Adipose tissue and disease ... 21
1.7 TALE proteins ... 23
1.7.1 Prep1 protein ... 24
1.7.2 Prep1 and metabolism ... 26
2.AIM OF THE STUDY ... 29
3.MATERIALS AND METHODS ... 31
3.1 Materials ... 31
3.2 Generation of Prep1 hypomorphic mice ... 31
3.3 Adipose tissue histological and immunohistochemical analysis ... 31
3.4 Mouse mature adipocytes isolation and [U-14C] glucose uptake assay ... 32
3.6 Oil Red-O staining... 33
3.7 Western blot analysis... 33
3.8 Real-Time RT-PCR analysis ... 34
3.9 Statistical procedures ... 34
4.RESULTS ... 35
4.1 Characterization of Prep1 hypomorphic heterozygous mice adipose tissue ... 35
4.2 Prep1 deficiency leads to increased expression of adipogenic markers ... 37
4.3 Insulin signaling and [U-14C] glucose uptake in adipose tissue of Prep1- deficient mice ... 38
4.4 Prep1 protein expression is decreased during 3T3L1 adipocytes differentiation ... 41
4.5 Prep1 stable transfection and Oil Red-O staining in 3T3L1 cells .... 42
4.6 Adipogenic markers expression and insulin signaling in 3T3L1 adipocytes overexpressing Prep1 ... 44
5.DISCUSSION ... 47
6.CONCLUSIONS ... 51
7.ACKNOLEDGEMENTS ... 53
3
LIST OF PUBLICATIONS
This dissertation is based upon the following publications:
Oriente F, Cabaro S, Liotti A, Longo M, Parrillo L, Pagano TB, Raciti GA, Penkov D, Paciello O, Miele C, Formisano P, Blasi F, Beguinot F. PREP1
deficiency downregulates hepatic lipogenesis and attenuates steatohepatitis in mice. Diabetologia. 2013 Dec;56(12):2713-22.
Valentino R, D'Esposito V, Passaretti F, Liotti A, Cabaro S, Longo M, Perruolo G, Oriente F, Beguinot F, Formisano P. Bisphenol-A Impairs Insulin
Action and Up-Regulates Inflammatory Pathways in Human Subcutaneous Adipocytes and 3T3-L1 Cells. PLoS One. 2013 Dec 9;8(12):e82099.
5
LIST OF ABBREVIATIONS
ACC: acetyl CoA carboxylase AMPK: AMP-activated protein kinase
aP2/FABP4: adipocyte protein 2/fatty acid binding protein 4 BAT: brown adipose tissue C/EBPs: CCAAT/enhancer-binding proteins
DXM: Dexamethasone
ERK: extracellular-signal-regulated kinases
FA: fatty acid
FAS: fatty acid synthase FATPs: fatty acid transport proteins
FFA: free fatty acid GC: glucocorticoid
GLUT4: glucose transporter type 4 HSL: hormone-sensitive lipase IL6: interleukin 6
IR: insulin receptor
IRS1-4: insulin receptor substrate 1-4
LAP: liver-enriched transcriptional activator protein
LIP: liver-enriched inhibitory protein
LKB1: liver kinase B1 LPL: lipoprotein lipase LPS: lipopolysaccharide
MAP kinase: mitogen-activated protein kinase
MIX: methylisobutylxanthine MSC: mesenchymal stem cell mTOR: mammalian target of rapamycin
NASH: Non Alcoholic Steotohepatitis
p160MBP: p160 Myb-binding protein
Pbx1: pre-B cell leukemia transcription factor
PGC-1α: PPARγ co-activator 1 PIK: phosphatidylinositol 3-kinase
PKA: protein kinase A PKB/Akt: protein kinase B PKC: protein kinase C
PPARs: peroxisome proliferator-activated receptors
Prep1: Pbx regulating protein 1 PTEN: phosphatase and tensin homolog deleted on chromosome ten
SCD1: stearoyl CoA desaturase SHIP2: SH2-containing inositol 5’-phosphatase 2
SHP1: SH-PTP1 Src homology domain tyrosine phosphatase SREBP: sterol regulatory element-binding protein
SVC: stromal vascular cells SYP: SH-PTP2 Src homology domain tyrosine phosphatase
T2D: type 2 Diabetes
TALE: three-amino acid loop extension
TG: triglyceride
TNFα: tumor necrosis factor alpha UEF-3: urokinase enhancer factor-3
uPA: urokinase plasminogen activator
7
ABSTRACT
Adipose tissue is crucial for maintaining energy and metabolic homeostasis and its functionality is closely related to the adipocytes differentiation state. Adipogenesis is regulated by several transcription factors.
Prep1 is an homeodomain transcription factor belonging to the TALE
proteins, which plays an important role in hematopoiesis, organogenesis and development. Previous studies have indicated that Prep1 hypomorphic heterozygous (Prep1i/+) mice, which express only 55-57% of protein, have a complex metabolic phenotype. In fact, these mice present smaller but otherwise normally structured islets with reduced fasting and post-loading plasma insulin levels and increased insulin sensitivity in skeletal muscle and in liver which is accompanied by protection from streptozotocin-induced diabetes. In addition, Prep1 deficiency in mice induces a reduction of hepatic triglycerides synthesis and a protection from methionine and choline-deficient diet-induced steatohepatitis.
In this study, I focused my attention on the role of Prep1 on the regulation of adipocyte differentiation and on the adipose tissue functionality.
To understand the possible role of Prep1 in adipose tissue, I first evaluated the features of adipose tissue of Prep1i/+ and WT mice. Prep1i/+mice show a reduction of adipose tissue weight, a reduction of the area but no change in the number of adipocytes. In addition, expression of adipogenic markers, C/EBPα, GLUT4 and FABP4, is increased in adipose tissue of Prep1i/+ mice, while PPARγ does not change. Consistent with these data, upon insulin stimulation, insulin receptor (IR), AKT and MAPK phosphorylation is increased in adipose tissue of Prep1 hypomorphic heterozygous mice. In addition, basal and insulin- stimulated glucose-uptake is increased in adipocytes isolated from adipose tissue of Prep1i/+ mice compared to the adipocytes from WT mice. The increased basal uptake is fully consistent with the higher expression of GLUT4 on the plasma membrane of adipocytes of Prep1i/+ mice compared with that of control animals.
To further study the function of Prep1 on adipocyte differentiation, I have analyzed Prep1 expression during different steps of adipogenesis in 3T3L1 murine cells. Levels of Prep1 are progressively reduced during the conversion from 3T3L1 preadipocytes to adipocytes. Moreover, 3T3L1 adipocytes stably transfected with Prep1 cDNA display reduced lipid accumulation, and expression of C/EBPα, GLUT4 and FABP4. Interestingly, insulin molecular signaling pathway is less activated in presence of Prep1.
All together these data suggest that Prep1 regulates adipocyte differentiation, giving a rationale to investigate Prep1 as possible new therapeutic agents in preventing adipose tissue dysfunctions.
SOMMARIO
Il tessuto adiposo è un organo che regola l’omeostasi energetica e metabolica e la sua funzionalità è strettamente correlata allo stato differenziativo degli adipociti.
Prep1 è un fattore di trascrizione ad omeodominio appartenente alla famiglia delle proteine TALE (Three Amminoacid Loop Extension), i cui membri sono coinvolti nella formazione e nello sviluppo di diversi organi. Studi recenti hanno dimostrato che i topi eterozigoti ipomorfi per Prep1 (Prep1i/+), che esprimono tra il 55-57% della proteina, hanno un fenotipo metabolico particolare. Infatti, tali topi mostrano una riduzione delle isole pancreatiche associata alla riduzione dei livelli plasmatici di insulina e all’aumento della sensibilità insulinica nel muscolo e nel fegato. In aggiunta, i ridotti livelli di espressione nel topo Prep1i/+ inducono la riduzione della lipogenesi epatica e la protezione dalla steatoepatite indotta da dieta carente in metionina e colina. In questo progetto, ho focalizzato la mia attenzione sullo studio del ruolo del fattore di trascrizione Prep1 nella regolazione del differenziamento adipocitario e nella funzionalità del tessuto adiposo.
Al fine di comprendere il possibile coinvolgimento di Prep1, ho valutato alcune caratteristiche del tessuto adiposo di topi Prep1i/+ e di controllo. I topi
Prep1i/+ mostrano la riduzione del tessuto adiposo epididimale e dell’area adipocitaria. In aggiunta, l’espressione dei markers di differenziamneto adipocitario, C/EBPα, GLUT4 e FABP4 è aumentata nel tessuto adiposo dei topi eterozigoti per Prep1, invece l’espressione di PPARγ non varia. Coerentemente a questi dati, in seguito a somministrazione intraperitoneale di insulina, la fosforilazione del recettore dell’insulina (IR), di AKT e MAPK è aumentata nel tessuto adiposo dei topi Prep1i/+. In aggiunta, la captazione di glucosio basale e insulino stimolata è aumentata in adipociti maturi isolati da tessuto adiposo di topi Prep1 eterozigoti ipomorfi. L’aumento basale di captazione del glucosio è giustificato da un’ aumentata espressione di GLUT4 sulla membrana plasmatica degli adipociti dei topi Prep1i/+. Per meglio caratterizzare il ruolo di Prep1 nel differenziamento adipocitario, ho valutato il livello di espressione proteica di Prep1 durante il differenziamento adipocitario. Esperimenti di Western Blot mostrano la riduzione significativa del livello proteico di Prep1 durante la conversione di fibroblasti 3T3L1 in adipociti maturi. Inoltre, la sovrespressione di Prep1 in adipociti 3T3L1 causa una significativa riduzione dei vacuoli lipidici intracellulari dopo colorazione con Oil Red-O e dell’espressione di C/EBPα, GLUT4 e FABP4. In aggiunta, adipociti 3T3L1 iperesprimenti Prep1 mostrano una ridotta capacità di risposta allo stimolo insulinico. Da questi dati è possibile supporre un ruolo di Prep1 nella regolazione della stato differenziativo degli adipociti e nella funzionalità del tessuto adiposo.
9
1. BACKGROUND
1.1 Adipose Tissue
Adipose tissue is the most prevalent tissue in the human body. It is commonly found in subcutaneous loose connective tissue and also surrounds internal organs. Mature adipocytes constitute the majority of cells in adipose tissue. Beside adipocytes, fat tissue contains several other cells types, including stromal-vascular cells (SVC) such as fibroblasts, smooth muscle cells, pericytes, endothelial cells and adipogenic progenitor cells or preadipocytes. Recent research shows that adipose tissue plays a more dynamic role than previously recognized in physiological processes of the whole body (Niemelä et al. 2008).
Adipose tissue is divided into two subtypes: white and brown fat. White adipose tissue (WAT), the predominant type of adipose tissue in humans, is characterized by adipocytes with a single lipid inclusion and eccentrically located nucleus (Ahima & Flier 2000). It has long been recognized as the main site of storage of excess energy derived from food intake. White adipocytes store dietary energy in a highly concentrated form as triglyceride. By contrast, brown fat is specialized primarily for non-shivering thermogenesis. Brown adipocytes are characterized by multiple, smaller droplets of triglyceride, which are accessible for rapid hydrolysis and rapid oxidation of the fatty acids. Brown fat depots are present in human infants and recent evidences suggest that dispersed brown adipocytes might persist in adults (Guilherme et al. 2008).
White adipose tissue may be found in subcutaneous and visceral compartments and the respective adipocytes show different molecular and physiological features. In fact, increased visceral adipose tissue is associated with an increased risk of insulin resistance and cardiovascular disease, whereas increased subcutaneous adipose tissue is not. Adipocytes in visceral depots are sensitive to lipolytic stimuli, whereas adipocytes from structural depots (such as around the eyes and in the heel pads) do not easily release stored lipid. In addition, visceral adipose tissue accumulates more macrophages in the inflammatory status and secretes higher levels of pro-inflammatory cytokines (Rosen & MacDougald 2006).
Fat tissue plays an important role in numerous processes through its secretory products and endocrine functions. Adipocytes secrete several factors known to play a role in immunological responses, vascular diseases and appetite regulation. For example, leptin is a peptide hormone primarily made and secreted by mature adipocytes, and it has various biological activities, including appetite, food intake and body weight regulation, fertility,
reproduction and hematopoiesis (Niemelä et al. 2008). In addition, adipose tissue secretory products act in an autocrine and paracrine way to regulate adipocyte metabolism and growth, as well as to regulate energy homeostasis (Figure 1).
Figure 1: The multiple functions of white adipose tissue include the synthesis and secretion of molecules.
WAT produces more than 50 cytokines and other molecules. These adipokines engage, through endocrine, paracrine, autocrine or juxtacrine mechanisms of action, in a wide variety of physiological processes.
Adapted fromLago F et al. Nature 2007. 3: 716–724
Despite the different function and distribution, adipocytes from the two types of white adipose tissue share many common differentiation feature. For example, all adipocytes derive from stem cells in a process known as adipogenesis (Cristancho & Lazar 2011).
1.2 Adipogenesis
Adipocytes derive from pluripotent mesenchymal stem cells (MSCs) having the capacity to develop into several cell types, i.e., adipocytes, myocytes, chondrocytes and osteocytes. These stem cells reside in the vascular stroma of adipose tissue as well as in the bone marrow, and, when
11
appropriately stimulated, undergo a multistep process of commitment in which the progenitor cells become restricted to the adipocyte lineage. Recruitment to this lineage gives rise to preadipocytes that then differentiate into adipocytes (Tang & Lane 2012) (Figure 2).
Figure 2: Stages of adipocytes differentiation.
Multipotent stem cell with the capacity to differentiate along mesenchymal lineages of myoblast, chondroblast, osteoblast and adipocyte, gives rise to preadipocyte. When exposed to appropriate environmental and gene expression conditions, these cells undergo clonal expansion and subsequent terminal differentiation; cells enlarge in size while accumulating lipid vacuoles that coalesce and eventually fill the cells.
Adapted fromRomao JM et al. Exp Biol Med 2011. 236(9):997-1004; Ricoult SJ & Manning BD. EMBO Rep. 2013. 14(3):242-51.
White adipose tissue compartments begin to develop in late gestation and the rate of adipogenesis rapidly surges in response to increased nutrient availability, leading to a marked postnatal expansion of adipose compartments. Whether adipogenesis occurs in the adult adipose tissue remains controversial. In animal studies, white adipocyte numbers increase through puberty but are
relatively steady in mature fat pad. However, within human adult WAT, adipocytes seem to undergo approximately a 10% annual turnover. Thus, adipogenesis takes place in adults to maintain the adipose compartment. (Cristancho & Lazar 2011). Adipogenesis can be divided into two phases:
determination and terminal differentiation. Determination results in the
conversion of the stem cell into a preadipocyte, which cannot be distinguished morphologically from its precursor cell but has lost the potential to differentiate into other cell types. In the second phase, the terminal
differentiation, the preadipocyte takes on the characteristics of the mature
adipocyte that acquires the machinery necessary for lipid transport and synthesis, insulin sensitivity and the secretion of adipocytes-specific proteins (Rosen & MacDougald 2006).
Moreover, the terminal differentiation can be further divided into several sequential steps that have been well characterized. Briefly, the sequence of events includes following: (1) Growth arrest at confluence, (2) clonal expansion which involves synchronous entry of all cells into S phase of the cell cycle, leading to one or two rounds of mitosis, (3) expression of late genes which is accompanied by an exit from the cell cycle and expression of adipocyte markers. All of these sequential steps are controlled by a network of interacting transcription factors operating to coordinate expression of many hundreds of proteins responsible for establishing the mature fat cell phenotype (Louet & O’Malley 2007).
The molecular regulation of terminal differentiation is more extensively characterized than determination because of the use of cell lines that have a restricted potential to differentiate into other cell types i.e., 3T3L1 and 3T3-F442A murine cells. Confluent 3T3L1 preadipocytes can be synchronously differentiated by a defined adipogenic cocktail. Maximal differentiation is achieved upon early hormonal induction for 48 h with a combination of insulin, glucocorticoids (GCs), and methylisobutylxanthine (MIX), which elevates intracellular cAMP levels, in the presence of fetal bovine serum. Dexamethasone (DXM), a synthetic GC agonist, is traditionally used to stimulate the GC receptor. After the first 48 h, insulin alone is required to continue the differentiation program (Moreno-Navarrete & Fernàndez-Real 2012).
1.3 Molecular regulators of adipogenesis
Adipocytes differentiation involves a temporally regulated set of gene-expression events, and understanding the underlying transcriptional networks is of fundamental importance. In particular, Peroxisome Proliferator‑Activated Receptor gamma (PPARγ) and CAAT‑enhancer‑binding protein (C/EBPs)
13
can be considered as principal regulators of adipogenesis (Gregoire et al. 1998).
1.3.1 C/EBP family of transcriptional factors
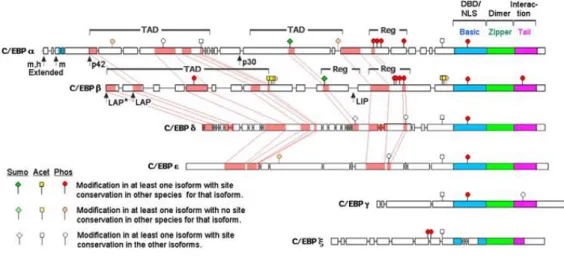
The CCAAT/enhancer-binding proteins (C/EBPs) encompass a family of six transcription factors with structural as well as functional homologies (Figure 3).
Figure 3: Amino acid sequence relationships among C/EBP family members.
The six gene-specific isoforms of C/EBP are presented as scaled graphics that display intra-isoform species homology (open boxes) as well as inter-intra-isoform conservation (pink shaded regions with interconnecting lines revealing relative locations). Homology is not displayed for the bZIP regions, which are generally highly conserved (with the exception of the modifications associated with the basic DBD of C/EBPζ). Stick figures represent sites of post-translational modification, as indicated by the key. The m and h designate murine-and human-specific initiation sites for extended forms of C/EBPα that encode a nucleolar localization sequence (blue shading).
Adapted fromTsukada J et al. Cytokine. 2011.54(1):6-19.
Similarity between C/EBP family members suggests an evolutionary history of genetic duplications with subsequent pressure to diversify. The resulting family of proteins varies in tissue specificity and transactivating ability. The pleiotropic effects of C/EBPs are in part in due to a tissue- and stage-specific expression, leaky ribosomal reading, post-transcriptional modifications, and variable DNA binding specificities. Several works using genetically altered mice to abolish expression of C/EBPs have identified the role that these factors play in normal tissue development and cellular function, cellular
proliferation and functional differentiation (Birkenmeier et al. 1989; Landschulz et al. 1989).
C/EBPs are modular proteins consisting of an activation domain, a DNA-binding basic region and a leucine-rich dimerization domain. The dimerization domain, known as leucine zipper, is a heptad of leucine repeats that intercalate with repeats of the dimer partner, forming a coiled coil of α-helices in parallel orientation.
C/EBPα was the first member cloned. Expression patterns of C/EBPα mRNA are similar in the mouse and human with measurable levels in liver, adipose, intestine, lung, adrenal lung, peripheral blood mononuclear cells and placenta. In liver and adipose compartment, highest levels of C/EBPα mRNA are detected only in differentiated tissue. Two isoforms of C/EBPα are generated from its mRNA by ribosomal scanning mechanism. The full-length protein is 42 kDa and contains three transactivation domains (TEI-III). TEI and TEII mediate cooperative binding of C/EBPα to TBP (TATA box-binding protein) and TFIIB, two components of the RNA polymerase II basal transcriptional apparatus. TEIII contains a negative regulatory subdomain.The shorter 30 kDa C/EBPα isoform retains its dimerization and DNA-binding domains; however, it possesses an altered transactivation potential compared with the 42-kDa isoform.
Constitutive expression of C/EBPβ is highest in liver, intestine, lung and adipose tissue. Stimulation with lipopolysaccharide (LPS), IL-6, IL-1, dexamethasone and glucagon strongly induces C/EBPβ expression, suggesting a role in the mediation of the inflammatory response. Like C/EBPα, two C/EBPβ isoforms are generated from a single mRNA. The full-length 32-kDa protein, also termed LAP, encodes for the conserved activation domains found in other C/EBPs proteins, as well as two regulatory domains, RD1 and RD2, which confer DNA binding inhibition in a cell type-specific manner. The truncated protein, LIP, translated from the third, in-frame AUG, possesses only the DNA-binding and leucine zipper domains.
C/EBPγ is a short, intronless gene, whose mRNA is ubiquitously expressed with highest levels found in non-differentiated, progenitor cells.
C/EBPδ is expressed in intestines, adipose and lung, with high levels of expression in all tissues following LPS stimulation. The 269-amino acid protein encodes a leucine zipper dimerization domain and DNA-binding region.
C/EBPε was originally identified from a rat genomic library. Four mRNA isoforms, expressed primarily in myeloid and lymphoid cells, are generated by the use of alternative promoters combined with differential splicing. The highest level of expression is detected in promyelocyte and late myeloblast-like cell lines.
C/EBPζ, which is induced by DNA damage, possesses a leucine zipper dimerization domain and DNA-binding region. This transcriptional factor
15
functions as a dominant negative inhibitor of C/EBPs transcriptional activation (Lekstrom-Himes & Xanthopoulos 1998).
In the recent years, it has been demonstrated that C/EBPs appear to have different roles in regulation of adipocytes differentiation. After treatment of preadipocytes cell lines (i.e., 3T3L1 and 3T3-F442A) with inducers of differentiation, it is possible to observed a rapid and transient increase in transcription and expression of C/EBPβ and C/EBPδ. After induction of differentiation, preadipocytes undergo approximately two rounds of cell division, and subsequently cell proliferation ceases coincident with the transcriptional activation of C/EBPα. Induction of C/EBPα is followed by transcriptional activation of many genes encoding proteins involved in creating the adipocyte phenotype.
Embryonic fibroblast from mice lacking both C/EBPβ and C/EBPδ expression are unable to differentiate in response to hormonal stimulation. However, ectopic expression of C/EBPβ, but no C/EBPδ, in 3T3L1 preadipocytes is sufficient to cause differentiation in the absence of DEX and MIX.
Works from a several of investigators have suggested a link between expression of C/EBPα and some adipose-specific genes. For example, promoters of adipocytes genes such as GLUT4, SCD1, leptin and ap2/FABP4 are transactivated by C/EBPs, including C/EBPα. In the absence of C/EBPα, adipose-specific genes are not expressed and triacylglycerol accumulation was not detected. Also, the conditional expression of C/EBPα in stably transfected clones of 3T3L1 preadipocytes is sufficient to bring about differentiation as measured by the cytoplasmic accumulation of lipid and the expression of
GLUT4, ap2/FABP4 and endogenous C/EBPα (Darlington et al. 1998).
Animals having a homozygous deletion of C/EBPα gene feature dramatically reduced fat accumulation in WAT and BAT pads. However, these mice succumb to hypoglycemia within the first week of life as a result of a failure to activate gluconeogenesis in the liver (Rosen & Spiegelman 2000).
1.3.2 PPARγ
PPARs are members of the nuclear receptor superfamily and are characterized as adopted orphan receptor, that can be activated by a variety of fatty acids and their derivatives such as prostaglandins. This receptor family is comprised of three different subtypes (PPARα, β/δ, γ), all of which are important regulators of lipid and glucose metabolism in many different tissues including skeletal muscle, liver, adipose tissue and gut. PPARγ is found in two different isoforms termed PPARγ1 and PPARγ2. The latter is almost exclusively expressed in adipose tissue, whereas PPARγ1 is more ubiquitously expressed. PPARs, like other nuclear receptors, are comprised of a non-conserved N-terminal A/B domain containing the activating function 1 (AF-1),
a highly conserved DNA-binding domain (DBD), a hinge region (D domain), and a C-terminal ligand-binding domain (LBD) containing the activating function 2 (AF-2). The DBD anchors PPARs to their binding sites on the DNA template through interactions between the two zinc fingers in this domain and the major groove of the DNA double helix. PPARs bind as obligate heterodimers with the retinoic X receptor (RXR) to direct hexanucleotide repeats spaced by 1 nucleotide (DR-1) termed PPAR response elements (PPREs) (Siersbӕk et al. 2010) (Figure 4).
Figure 4: PPARγ structure.
PPARs present different functional domain: 1- the activation function-1 region (AF-1); 2- the DNA binding domain (DBD) binds specific DNA sequences in the PPREs found in the promoter regions of genes regulated by PPARs; 3- the ligand binding domain (LBD) contributes to the dimerization of the receptor with RXR and binds coactivator and corepressor proteins here.
Adapted from Wadosky KM & Willis MS Am J Physiol Heart Circ Physiol 2012. 302(3):H515-26; Ahmadian M et al. Nature 2013. 19(5):557-66.
There are more evidences that show that PPARγ is a prime mover of fat cell differentiation. This was shown first in gain-of-function experiments that expressed PPARγ in non-adipogenic, fibroblastic cells using retroviral vectors, causing a strong differentiation response. The use of high-affinity selective PPARγ agonists such as thiazolidinediones (TZDs) has greatly improved on these observations. PPARγ agonist-mediated differentiation includes lipid accumulation and expression of many endogenous genes typical of the adipocyte. Interestingly, the ability of PPARγ to promote adipogenesis is not limited to fibroblastic cells. Indeed, myoblastic cell lines can also be converted to adipocytes, particularly when the cells co-express C/EBPα in addition to PPARγ.
The role of PPARγ in adipogenesis is also illustrated in studies that have deleted this gene in mice. The PPARγ homozygous null mutation is lethal relatively early in gestation (e 10-10.5), secondary to a defect in placental development. Interestingly, PPARγ heterozygous animals exhibit resistance to diet-induced obesity, although this results at least in part from elevated serum leptin levels and decreased food intake in these mice. In human, a role for PPARγ in adipogenesis is suggested by the results of clinical trials of PPARγ agonists in liposarcoma, a malignant tissue of adipose origin. These tumors exhibit a strong differentiative response to these agents; whether this leads to
17
improved patient outcome is currently the subject investigation (Rosen & Spiegelman 2000).
1.4 A transcriptional cascade regulates adipocytes differentiation
Adipogenesis, and in particular terminal differentiation, includes a series of transcriptional processes involving the sequential expression of several transcriptional factors, culminating in the activation of C/EBPs and PPARγ (Figure 5).
Figure 5: A complex transcriptional cascade regulates adipogenesis.
The transcriptional control of adipogenesis involves the activation of a variety of transcription factors. These proteins are expressed in a cascade in which C/EBPβ and C/EBPδ are among the earliest seen. These two proteins induce the expression of PPARγ, which in turn activates C/EBPα. C/EBPα feeds back on PPARγ to maintain the differentiated state. ADD-1/SREBP-1 can activate PPARγ by inducing its expression as well as by promoting the production of an endogenous PPARγ ligand. All these factors contribute to the expression of genes that characterize the terminally differentiated phenotype.
Adapted from Louet & O’Malley Cell Cycle 2007. 6(20):2448-52.2006; Ahmadian M et al.
Initially, the transcriptional factor CREB (cAMP response element-binding protein) induces adipocytes differentiation increasing C/EBPβ expression (Reusch et al. 2000; Tang & Lane 2012). C/EBPβ, together with C/EBPδ, promote the expression of C/EBPα and PPARγ; this induction is likely do to be a direct transcriptional effect through C/EBP binding site in the genes promoter (Rosen & Spiegelman 2000).
Subsequently, PPARγ and C/EBPα initiate positive feedback to induce their own expression and also activate a large number of downstream target genes whose expression determines the adipocyte phenotype (Moreno-Navarrete & Fernàndez-Real 2012). Genetic proof of this relationship has been obtained from experiments in which homozygous PPARγ null cells (MEFs or ES cells) have been exposed to a prodifferentiative regimen. These cells do not become adipocytes and fail to express C/EBPα despite normal levels of C/EBPβ and δ. Interestingly, fibroblasts derived from C/EBPα-/- embryos have reduced levels of PPARγ and do not form fat when exposed to hormonal-inducing agents in culture. When C/EBPα is added back to these cells with retroviral vector, the expression of PPARγ and the ability to differentiate is restored (Rosen & Spiegelman 2000).
The activation of these transcriptional factors determines the acquisition of mature fat phenotype. In fact, adipocyte cultures feature markedly increase of
de novo lipogenesis and become sensitive to insulin. The role of adipocyte
determination- and differentiation-dependent factor-1/sterol regulatory element-binding protein-1 (ADD-1/SREBP-1) in adipocyte differentiation has also been indicated in detail. ADD-1/SREBP-1 is induced during adipocyte differentiation stimulating the expression of many genes necessary for lipogenesis in vivo, such as fatty acid synthase (FAS) and adiponectin (Niemelä et al. 2008).
During the adipogenic process it is possible to observe an increase of enzymes involved in TG metabolism including adenosine triphosphate (ATP) citrate lyase, malic enzyme, glycerol-3-phosphate dehydrogenase and fatty acid synthase. Furthermore, adipocytes also synthesize other adipose tissue-specific products that are not directly related to lipid and glucose metabolism. These include FABP4/aP2, an adipocyte specific fatty acid-binding protein, and GLUT4 that have been considered as intermediate markers of adipocytes differentiation. In addition, adipocytes produce various secreted factors including adipsin, angiotensin II and leptin that are regarded as late markers of adipocytes differentiation (Table 1). PPARγ and C/EBPα are involved in the coordinated activation of several of these genes (Niemelä et al. 2008).
19
Table 1: Target genes of key adipocyte transcription factors.
Adapted from White & Stephens Adipose tissue in Health and Disease 2010.
1.5 Adipocytes metabolism
Adipocytes control whole-body metabolism by regulating 95% of total body triglyceride (TG) concentration (Stahl et al. 2002). In fact, these cells store dietary energy in a highly concentrated form as TG, mostly in a single large lipid droplet. These structures are associated with a unique complement of proteins, which enable the sequestration or mobilization of lipids. In times of caloric need, triglycerides can be rapidly hydrolyzed by lipases (a process known as lipolysis) and the resulting fatty acids are transported to other tissues to be oxidized in mitochondria as an energy source. Critical to these functions is the capacity of the adipocytes to respond to insulin (Guilherme et al. 2008).
1.5.1 Insulin signaling
Increased plasma glucose levels induce insulin secretion from pancreatic β cells into the bloodstream where it increases fatty acid and glucose uptake in the liver, muscle and adipocytes and decreases gluconeogenesis in the liver (Badman & Flier 2005; Cheatham & Kahn 1995). In mature adipocytes insulin binds to the insulin receptor (IR), which then phosphorylates IR substrates (Miki et al. 2001; Zhou et al. 1999). This leads to the recruitment and activation of the phosphatidylinositol-3 kinase (PI3K) and Akt (Laviola et al. 2006). Akt signaling induces translocation of GLUT4 from
Adipogenic transcription factors Characterized target genes
C/EBPβ PPARγ, C/EBPα, adiponectin
C/EBPδ PPARγ, C/EBPα
C/EBPα PPARγ, aP2, SCD, GLUT4, insulin
receptor, leptin, adiponectin
SREBP-1 FAS, C/EBPβ, adiponectin
PPARγ aP2, C/EBPα, LPL, HSL, malic
enzyme, acyl-CoA synthetase, FATP, FAT, SCD, perilipin, PEPCK, GLUT4, UCP1, adiponectin
intracellular compartments to the plasma membrane where it facilitates transport of glucose into the cell (Watson et al.2004). Similarly, Akt also induces the translocation of fatty acid transport proteins (FATPs) 1 and 4 to the cell surface for import of fatty acids (Stahl et al. 2002). The increased concentrations of glucose and fatty acids that accumulate due to insulin stimulation rapidly induce synthesis of TG for long-term fat storage. Adipocyte precursor cells, positioned in the WAT, are also affected by insulin signaling. Here, proteins involved in cell proliferation and differentiation, especially the ERK and mTOR, are activated and initiate cell division and differentiation of precursor cells into adipocytes thereby increasing the storage capacity for fatty acids (Laviola et al. 2006) (Figure 7).
Figure 7: Insulin signaling pathway.
In adipocytes, insulin promotes free fatty acid (FFA) esterification into triglycerides (TG, schematically represented as the three-carbon glycerol backbone with three acyl fatty acid chains (wavy lines)) through stimulation of glucose transporter type-4 (GLUT4)-mediated glucose uptake. Glucose can be converted to α-glycerol phosphate, the main source of the glycerol backbone of TG. Insulin signaling downregulates TG lipolysis through hormone-sensitive lipase (HSL). Insulin stimulation of the phosphatidylinositol 3-kinase (PI3K)-AKT/protein kinase B (PKB) pathway leads to activation of the enzyme phosphodiesterase-3 (PDE3). This enzyme catalyzes the breakdown of cyclic AMP (cAMP) which in turn reduces the activation of HSL.
21
Insulin regulates lipolysis, lipogenesis and glucose and fatty acids uptake. Lipogenesis depends on lipoprotein lipase (LPL) that is secreted from adipocytes and acts on the surface of endothelial cells in the WAT where it hydrolyzes the lipoprotein bound TG to FFAs which are then transported into adipocytes by passive diffusion (Hamilton & Kamp 1999) or by fatty acid transporter proteins (FATPs) (Abumrad et al. 1999). Inside the adipocyte, the fatty acids become chaperoned by adipocyte fatty acid binding protein 4 (FABP4/aP2) for re-esterification and conjugation to coenzyme A (coA) catalyzed by acyl CoA synthetases (ACS) (Fantuzzi & Mazzone 2007).
Lipolysis is due to the activity of the hormone-sensitive lipase (HSL), that catalyzes the hydrolysis of TG and is activated by protein kinase A (PKA) mediated-phosphorylation. Insulin inhibits lipolysis reducing adenylate cyclase activity and, in turn, PKA (Madsen & Kristiansen 2010).
In addition, insulin stimulates glucose uptake by inducing GLUT4 translocation. In the absence of insulin, only ~5% of the total transporter pool is found on the cell surface (Leto & Saltiel 2012). Upon binding to its own receptor, insulin induces GLUT4 recruitment to the plasma membrane to promote glucose uptake (Czech et al. 1993).
Insulin plays an important role, also, in adipocytes differentiation. In particular, study using IRS1-/- and IRS2-/- cells suggests that members of IRS family in adipocytes play a role in adipogenesis. In fact, cells lacking both IRS1 and IRS2 cannot undergo adipocytes differentiation and adipose tissue mass is dramatically reduced. Furthermore, PI3K and AKT1 are required for adipocytes differentiation in vitro. However, the molecular mechanism of insulin action on adipocytes differentiation is still under investigation (Madsen & Kristiansen 2010).
1.6 Adipose tissue and diseases
The classical perception of adipose tissue as a storage place of fatty acids has been replaced over the last years by the notion that adipose tissue has a central role in lipid and glucose metabolism and produces a large number of hormones and cytokines, including TNFα, IL-6, adiponectin and leptin (Hajer et al. 2008).
It is clear that adipose tissue is important to several normal processes of the human body, but it can be involved in human disease states such as obesity, type 2 diabetes mellitus (T2DM) and insulin resistance (IR).
Obesity is a chronic, multifactorial disorder that has reached epidemic proportions globally. It is primarily characterized by an increase of fat mass with development of different related disorders. Expansion of adipose organ, in particular of white adipose tissue, is caused by a combination of size increase of preexisting adipocytes (hypertrophy) and de novo adipocytes
differentiation (hyperplasia) (Tedesco at al. 2008). Adipogenesis has probably a role in the pathology of obesity; indeed, when animals are kept on a high-fat diet, adipocyte cell size initially increases, followed by an increase in fat cell number upon prolonged over-nutrition. In addition, short-term overfeeding studies in adults demonstrate increase in adipocyte cell number. By contrast, preclinical and human studies have shown that weight loss is associated with decreased adipocyte cell size but has no effect on adipocyte cell number (Cristancho & Lazar 2011). Adipocytes functionality is lost during obesity and has been related to adipocyte hypertrophy, disequilibrium between lipogenesis and lipolysis, impaired transcriptional regulation of the key factors that control adipogenesis and lack of sensitivity to external signals, as well as a failure in the signal transduction process. Thus, dysfunctional adipocytes contribute to abnormal utilization of fatty acids causing lipotoxicity in non-adipose tissue such as liver and pancreas, that is correlated with insulin resistance (Vázquez-Vela et al. 2008).
T2D accounts for 90% of all forms of diabetes and is most common in people older than 45 who are overweight. However, as a consequence of increased obesity among young people, it is becoming more common in children and young adults. T2D is a heterogeneous syndrome with many possible causes. This is due to the interaction of environmental factors with a genetic susceptibility to the disease, and it is becoming more evident that the relative contribution of genes and environment can differ considerably, even among individual whose clinical phenotype is similar (Diabetes Atlas 2006). The maintenance of normal glucose homeostasis depends on a precisely balanced and dynamic interaction between tissue sensitivity to insulin and insulin secretion. Type 2 diabetes develops because of defects in both insulin secretion and action, both of these with a genetic as well as an acquired component. Thus, T2D is made up of different forms each of which is characterized by variable degrees of insulin- resistance and beta cell dysfunction, and which together lead to hyperglycaemia. Insulin resistance, typically, is an early feature of T2D. It results from a genetically determined reduction in insulin sensitivity, compounded by exposure to the environmental factors, which further impair insulin action. Major sites of insulin resistance include liver and the peripheral tissues, skeletal muscle and fat. In muscle and fat, insulin resistance is manifested by decreased glucose uptake; in the liver, insulin resistance leads to failure of insulin to suppress hepatic glucose production, which is followed by glycogen breakdown and particularly by gluconeogenesis (Pickup & Williams 2005). The disease often remains asymptomatic and undetected for years. People with type 2 diabetes are not completely dependent on exogenous insulin, but may require the hormone for the control of blood glucose levels if this is not achieved with diet alone, regular exercise or with oral hypoglycaemic agents. While several environmental factors have been identified, discovery and characterization of
23
the genes involved in T2D has been an arduous task and has proceeded slowly. In the past 10 years, indeed, geneticists have devoted a large amount of effort to finding T2D genes. Recently, several works suggest that the family of homeodomain-containing transcription factors named TALE (Three Aminoacid Loop Extension) is strongly related to diabetes and insulin-resistance (Kim et al. 2002; Oriente et al. 2008; Oriente et al. 2011)
1.7 TALE proteins
The three-amino acid loop extension (TALE) homeodomain proteins are recognized as transcription factors responsible for regulating growth and differentiation during vertebrate embryogenesis. The genes encoding these proteins are highly conserved and are present in the common ancestor of plants, fungi, and animals.
TALE proteins display a highly conserved DNA binding domain of approximately 60 amino acids called the homeodomain (Gehring et al. 1994). This region is composed of three alpha helices and a flexible N-terminal arm. The homeodomain interacts with the DNA through the third helix making base-specific contacts in the major groove of DNA and through the N-terminal arm which contacts the minor groove of DNA. Between the first and the second alpha helices of the homeodomain there is an extension of three amino acids, virtually represented by a proline (P) – tyrosine (Y) – proline (P) in position 24-26. This domain has been implicated in important protein–protein interactions that are required for fundamental aspects of development. The TALE homeodomain superclass is composed of two groups: the PBC and the MEIS families. The PBC subclass of the TALE homeodomain proteins, referring to the conserved PBC motif N-terminal to the TALE homeodomain (Burglin 1997; Burglin 1998), includes the vertebrate Pbx proteins, fly Extradenticle and worm Ceh-20. The MEIS class includes Homothorax (Hth) in flies and the Meis and Prep proteins in vertebrates (Figure 8) (Moens & Selleri 2006).
Figure 8: Phylogeny of Hox cofactors.
TALE homeodomain proteins are divided into two groups: the PBC family, including the vertebrate Pbx proteins, fly Extradenticle and worm Ceh-20, and the MEIS family, including vertebrate Meis and Prep, fly Homothorax (Hth) and worm Unc-62. Orange letters indicate mouse proteins, purple lettering indicates their zebrafish orthologs. Although in some cases the orthology assignments are not clear (as for pbx2 and pbx4), genetic rescue experiments in zebrafish have suggested that the different pbx genes are functionally identical. Similar information is not yet available with regard to mammalian Pbx genes.
Cooperative function among TALE family members is critical for transcription regulation (Bischof et al. 1998; Chang et al. 1997; Knoepfler et al. 1997), and several members have been shown to function as essential contributors to Hox-mediated developmental programs (Chan et al. 1994; Mann and Chan 1996; Rauskolb and Wieschaus 1994).
1.7.1 Prep1 protein
Prep1 (Pbx regulating protein 1) is a 64 kDa ubiquitary homeodomain transcription factor of the three aminoacid loop extension (TALE) superclass of proteins mapping on the chromosome 21q.22.3. The Prep1 homeodomain is structurally related to the PBC homeodomain class and contains an isoleucine residue in the third position of the conserved WF_N sequence in the homeodomain. Indeed, Prep1 forms DNA-independent dimeric complexes with the Pbx homeodomain transcription factor, enhancing target specificity and regulatory function. Prep1 shares homology with MEIS proteins within
25
the homeodomain and in two well-preserved amino terminal regions termed HR1 and HR2 (Homology Region). HR1 and HR2 bind the N-terminal region of Pbx1 (PBC-A) and are essential for Prep1-Pbx1 heterodimerization, which in turn is required for DNA binding (Berthelsen et al. 1998). Prep1 could be localized both in cytoplasm and in nucleus and the heterodimerization with Pbx1 appears to be essential to translocate Prep1 into the nucleus to bind DNA target. On the other hand, Prep1 dimerization prevents nuclear export and the proteasomal degradation of Pbx1 prolonging its half-life (Berthelsen et al. 1999). Formation of dimeric complex drastically increases binding affinity of Prep1/Pbx1 to the DNA and also broadens the DNA target selectivity of Pbx1 to include sequences containing the TGACAG sequence (Berthelsen et al. 1998). Together Prep1 and Pbx1 form the UEF-3 (Urokinase Enhancer Factor-3) transcription factor, which is important in regulating the activity of the urokinase plasminogen activator (uPA) gene enhancer. The UEF3 DNA target site is a regulatory element in the promoters of several growth factor and protease genes, such as interleukin-3 (IL-3), stromelysin and urokinase plasminogen activator (uPA) (Berthelsen et al. 1996). Prep1 and Pbx1 can form ternary complexes with PDX-1 to regulate somatostatin gene transcription (Goudet et al. 1999).
The role of Prep1 has been in part clarified by the generation of mutant mice. Nevertheless, Prep1 null embryos results in early lethality before gastrulation (E7.5) (Fernandez-Diaz et al. 2010), precluding a study of the Prep1 role in later developmental processes. An insertion of a retroviral vector in the first intron of the Prep1 gene results in a hypomorphic mutation (Prep1i/i) that exhibits variable penetrance. Prep1i/i embryos, expressing 5 to 7% of protein,
die between E17.5 and P0 and present a profound alteration in the hematopoietic development with a deficient radioprotection activity of fetal liver (FL) progenitors and all colony-forming progenitors and profound anemia (Ferretti et al. 2006). However, a small percentage of the Prep1i/i embryos are born alive and subsequently live a normal length-life. The mice escaping embryonic lethality show T-cell development anomalies with a decreased number of circulating CD4+ and CD8+ T cells and increased apoptosis (Penkov et al. 2005). In addition, Prep1i/i feature an impairment of erythropoiesis and angiogenesis accompanied by liver hypoplasia, decreased hematocrit, anemia, and delayed erythroid differentiation together with a decrease in capillary formation (Ferretti et al. 2006). These mice show also alterations in eye development, in fact in most cases the size of the lens is strongly reduced, similar to the phenotype of Pax6-deficient mice. Prep1 deficiency affects the expression of both TALE class partners Pbx and Meis, both required for embryonic hematopoiesis (Azcoitia et al 2005; Di Martino et al. 2001; Hisa et al. 2004). All of these effects are in part evident, although more weakly, also in a Prep1 heterozygous hypomorphic mice (Prep1i/+), expressing 55-57% of protein.
1.7.2 Prep1 and metabolism
In our laboratory we have recently evidenced an important role of Prep1 in pancreas development, glucose homeostasis, regulation of insulin-action in muscle and liver, and in the regulation of hepatic lipogenesis (Oriente et al. 2008; Oriente et al. 2011; Oriente et al. 2013).
Prep1-hypomorphic mice show smaller pancreatic islet but normal
architecture. However, these mice feature islet hypoplasia, accompanied by significantly reduced absolute insulin levels (both basal and postloading). The
Prep1i/i pancreatic phenotype is characterized by also a strong reduction of pancreatic Pbx1 expression, emphasizing the idea that Prep1 hierarchically acts upstream in the network regulating pancreas development by controlling the levels of Pbx1. Moreover, these mice exhibit protection from streptozotocin-induced diabetes and enhanced insulin sensitivity with improved glucose uptake and insulin-dependent glucose disposal by skeletal muscle. This muscular phenotype does not depend on the reduced expression of Pbx1, rather than on the reduced levels of the recently identified novel Prep1 interactor p160 Myb-binding protein (p160MBP), a molecule which is known to inhibit the PGC-1α-mediated glucose transport and compete with Pbx1 to bind Prep1. Consistent with p160MBP decrease, these mice show a muscle-selective increase in mRNA and protein levels of PGC-1α, accompanied by enhanced expression of the GLUT4 transporter and glucose uptake in muscle. Further experiments performed in cells overexpressing
Prep1 have confirmed these results and have indicated that Prep1 stabilizes
p160MBP, inducing p160MBP escape from proteasomal and reduces the levels of PGC-1α and GLUT4.
The mechanisms responsible for Prep1 action in liver differ from those in the skeletal muscle since Pbx1 and p160MBP are expressed at different levels. In fact, while there is a marked reduction of p160MBP in the skeletal muscle of the hypomorphic mice compared to the wild type animals, this difference has not detectable in the liver because in this organ the expression of p160MBP is very low. Thus, at variance with muscle, Prep1 major functional partner in liver appears to be Pbx1 rather than p160MBP.
Prep1 deficiency in animal models improves insulin signaling in liver
increasing hepatic glycogen content and decreasing glucose output and triglyceride levels. Analysis of the initial steps in insulin signaling in the
Prep1-deficient mouse liver revealed increased tyrosine phosphorylation of
both insulin receptor and the major IRSs present in these cells. These effects are paralleled by a significant reduction of expression of SYP and SHP1 tyrosine phosphatases. The functional relevance of Prep1 control of SHP1 versus SYP expression to hepatic sensitivity to insulin has been assessed in HepG2 liver cells stable transfected with Prep1. These cells feature a very significant reduction of insulin effect on glycogen accumulation. In particular,
27
expression of SHP1 in cellular models negatively correlates with insulin signaling. However, antisense silencing of SHP1 rescued insulin effect in these cells, thus establishing SHP1 as the functionally relevant target of Prep1 in the liver. The regulatory region of SHP1 gene contains several Prep1 binding sites in the 4,000 base-pair region upstream SHP1 transcription initiation site and one Prep1/Pbx1 binding site responding to the ectopic expression of Prep1 and Pbx1 in cotransfection experiments in vitro. In these assays, a fragment containing single Prep1/Pbx1 binding site displays a powerful enhancer function. Thus, Prep1-Pbx1 complex enhances SHP1 gene transcription by acting on regulatory sequences upstream the ATG codon.
Prep1 action in liver is not limited to the regulation of glucose metabolism but
also on lipid synthesis (Oriente et al. 2013). In fact, serum triglyceride levels are strongly reduced in Prep1 heterozygous hypomorphic mice, confirming previous data about the reduction of hepatic triglyceride content (Oriente et al. 2011). Indeed, FAS expression, an enzyme that regulates de novo hepatic lipogenesis, is significantly reduced in Prep1 deficient mice. Consistent with these data, the molecular pathway controlling hepatic lipogenesis is downregulated. In fact, in Prep1i/+ mice liver there is an increase of phosphorylation of PKCzeta, LKB1, AMPK and ACC, leading to an inhibition of TG synthesis. This regulation is due to the modulation of expression of SHIP2, a lipid phosphatase, known inhibitor of PI3Kinase/PKCzeta signaling. In the liver of Prep1 deficient mice SHIP2, protein and mRNA expression, is strongly reduced. Accordingly with these data, HepG2 cells overexpressing
Prep1 display increased triglyceride levels and FAS expression, PKCzeta,
LKB1, AMPK and ACC phosphorylation is strongly reduced, while SHIP2 levels are increased. Interestingly, overexpression of Pbx1 cDNA in HepG2 cells mimicks Prep1-induced triglyceride synthesis. At the opposite, Prep1HR1 mutant, which is unable to bind Pbx1, fails to elicit these effects. ChIP and Re-ChIP experiments indicate that Prep1/Pbx1 complex can bind SHIP2 promoter region and regulate its expression. Treatment with a methionine and choline-deficient (MCD) diet induces steatosis in both Prep1i/+ and non-hypomorphic control mice. However, alanine aminotransferase increase, intracellular TG content and histological evidence of liver steatosis, inflammation and necrosis is less evident in Prep1i/+ mice, indicating that
Prep1 silencing protects mice from MCD diet –induced steatohepatitis
(Oriente et al. 2013).
On the basis of the results, Prep1 might be considered as a new gene involved in the pathogenesis of type 2 diabetes, insulin-resistance and steatohepatitis.
29
2. AIM OF THE STUDY
The primary function of adipose tissue is to store energy in the form of triglycerides during period of energy excess and to release the energy during fasting as free fatty acids and glycerol. In addition, adipose tissue secretes a variety of peptides called adipocytokines that have endocrine, autocrine and paracrine effects on the brain, liver and skeletal muscle. These peptides play an important role in the regulation of energy homeostasis and intermediary metabolism. Dysfunction of adipose tissue may result in insulin resistance, type 2 diabetes mellitus and obesity (Garg 2006).
Prep1 is an homeodomain transcription factor that regulates the overall size of
the organism and individual organs as well as major developmental pathways. Data produced in our lab indicate that Prep1 hypomorphic mice (Prep1i/+) have a complex metabolic phenotype characterized by increased insulin sensitivity accompanied by protection from streptozotocin-induced diabetes. In muscle tissue, Prep1 deficiency positively modulates the intracellular pool of GLUT4 by enhancing the transcription of PGC-1α gene. In the liver, the mechanism is independent on PGC-1α and the improvement of insulin signaling is characterized by a reduction of tyrosine phosphatases SHP1, whose transcription is mediated by Prep1 and by an increase of insulin-stimulated insulin receptor and IRS1/2 tyrosine phosphorylation. In addition,
Prep1 deficiency in mice induces a reduction of hepatic triglycerides synthesis
and a protection from methionine and choline-deficient diet-induced steatohepatitis. In fact, in Prep1i/+ mice liver there is an increase of phosphorylation of PKCzeta, LKB1, AMPK and ACC, leading to an inhibition of TG synthesis. This regulation is due to the modulation of expression of SHIP2, a lipid phosphatase, known to be an inhibitor of PI3Kinase/PKCzeta signaling.
Thus Prep1 regulates several aspects of whole body metabolism (Oriente et al. 2008; Oriente et al. 2011; Oriente et al. 2013), but whether and how Prep1 affects adipose compartment is still unknown. The aim of my project is to investigate the role of Prep1 on adipogenesis and adipose tissue function, by analyzing the molecular mechanisms both “in vivo” and “in vitro”.
31
3. MATERIALS AND METHODS
3.1 Materials
Media, sera, antibiotics for cell culture and the lipofectamine reagent were from Invitrogen (Grand Island, NY). The Prep1, actin, C/EBPα, FABP4, PPARγ, pAKT-Ser473 and MAPK antibodies were from Santa Cruz Biotechnology, Inc. (Santa Cruz, CA). The GLUT4 antibody was from Abcam, Inc. (Cambridge, MA). The p-IR-Tyr1146, IR, pMAPK, antibodies were from Cell Signaling Tecnology, Inc. The AKT antibody was from Millipore Corporation (Billerica, MA). Protein electrophoresis and Real Time PCR reagents were purchased from Bio-Rad (Hercules, CA), Western blotting and ECL reagents from Amersham Biosciences (Arlington Heights, IL). Oil Red O stain and all other chemicals were from Sigma (St. Louis, MO).
3.2 Generation of Prep1 hypomorphic mice
Prep1 targeted mice were generated by gene trapping by Lexikon
Genetics, Inc. (The Woodlands, Texas) and have been previously described (Ferretti et al. 2006; Penkov et al. 2005; Fernandez-Diaz et al. 2010). In the experiments reported in this paper, heterozygous mice were backcrossed with wild-type (WT) C57BL/6J for 4 generations. All animal handling conformed to regulations of the Ethics Committee on Animal Use of H. S. Raffaele (IACUC permission number 207). Adipose tissue samples were collected and weighed after mice were sacrificed by pentobarbitone overdose. Tissues were snap frozen in liquid nitrogen and stored at –80°C for subsequent western blotting and Real Time RT-PCR analysis.
3.3 Adipose tissue histological and immunohistochemical analysis
For the histological examination, epididymal adipose tissue from killed mice were immediately incised and weighed. Small pieces were fixed in 10% formalin and stained with haematoxylin and eosin for histological analysis. Image-Pro Plus© program was used for area and cells number measurement. For cells number measurement, HPF means High Power Field that is the area visible under the maximum magnification power of the objective being used. For immunohistochemical examination, frozen sections (6μm) were fixed in acetone at 4°C for 5 min, then blocked for endogenous peroxidase in 0.3%
H2O2 in methanol for 20 min. Adipose sections were further incubated with mouse monoclonal antibody against GLUT4 (dilution 1:50) overnight at 4°C. Slides were washed three times with PBS, incubated with biotinylated anti-mouse and labeled streptavidin biotin (LSAB kit; DakoCytomation, Glostrup, Denmark) for 30 min, followed by incubation with streptavidin conjugated to horseradish peroxidase (LSAB Kit; DakoCytomation, Denmark). Color development was assessed following 5 min of diaminobenzidine treatment (DakoCytomation, Denmark) treatment. Sections were counterstained with Mayer’s haematoxylin. In the corresponding negative control section, the primary antibody was either omitted or replaced with normal mouse serum.
3.4 Mouse mature adipocytes isolation and [U-14C]glucose uptake assay
Isolated mouse adipose cells of epididymal fat pads from male 6-months-old Prep1i/+ and WT littermates were prepared by Type 1 collagenase digestion (1mg/ml) in KRBH-5% BSA buffer (Krebs Ringer Bicarbonate Hepes buffer, pH 7.4 containing 30mmol/L Hepes, 10mM NaHCO3, 0.12M NaCl, 4mM KH2PO4, 1mM MgSO4, 1mM CaCl2, 200nM adenosine and 5% BSA) at 37°C on shaking. After 2 hours of digestion, cells were filtered through a 250μM nylon mesh filter and then washed 3 times with KRBH-5% BSA buffer. After the final wash, cells were ready to use. Cells were counted using TC10 Automated cell counter (Biorad Laboratories, Inc. Hercules, CA) according to the manufacturer's instructions. Aliquots of adipose cells were incubated with or without 10KμU/ml (60nmol/L) insulin for 30 minutes before adding [U-14C]glucose (0.5μCi/ml) at 37°C on shaking. After 30 minutes aliquots of each samples were put in tubes with dinonylphthalate oil and spinned to separate the cells with aqueous phase. Scintillation liquid was added to the collected cells for the measurement of [U-14C]glucose on a beta counter.
3.5 Cell culture procedures and transfection
3T3L1 murine fibroblast cells were available in host laboratory. They were grown in Dulbecco’s modified Eagle’s medium (DMEM) supplemented with 10% calf serum (FCS), 100 IU/ml penicillin, 100 IU/ml streptomycin, and 2% L-glutamine in a 5% humidified CO2 incubator. 3T3L1 cells were differentiated as previously described (Engelman et al. 1998). In brief, after 2 days from confluence (Day 0), the DMEM 10% FCS was changed and new DMEM 10% FBS was added to the cells with the addition of 174nM insulin, 10mM dexamethasone and 0.5mM 3-isobutyl-1-methylxanthine. After 2 days (Day 2), this medium was replaced with fresh DMEM 10% FCS containing
33
only 174nM insulin. After another 2 days, the cells were then propagated in only 10% FCS medium.
3T3L1 stable transfection of Prep1 and PRC/CMV plasmid cDNAs were performed by the Lipofectamine reagent (Invitrogen) according to the manufacturer’s instruction. For these studies, 60-80% confluent cells were washed twice with Optimem and incubated for 8h with 3-5 g of plasmid construct and 45-60 μl of Lipofectamine reagent. In stably transfection individual G418-resistant clones were selected by the limiting dilution technique (G418 effective dose, 0.8 mg/ml).
3.6 Oil Red O-staining
To measure cellular neutral lipid droplet accumulation, 3T3L1 cells were stained by the Oil Red O method. Prep1 stably transfected 3T3L1 cells were differentiated as described above. Mature adipocytes were washed three times with iced PBS and fixed with 4% paraformaldehyde for 30 minutes. After fixation, cells were washed three times and stained with Oil Red O solution (working solution, 0.5g Oil Red O powder Sigma dissolved in 60% ethanol) for 15 min at room temperature. Cells were washed again with phosphate-buffered saline (PBS) to remove unbound staining. The 3T3L1 adipocytes were examined under a light microscope, and the red oil droplets stained in the cells indicate TG accumulation. The ORO was extracted in 100% isopropanol and absorbance was evaluated at 510nm as previously described (Ramirez-Zacarias et al. 1992).
3.7 Western blot analysis
Tissue samples were homogenized in a Polytron (Brinkman Instruments, N.Y.) in 20 ml T-PER reagent/gram of tissue according to manufacture (Pierce, IL). After centrifugation at 10,000 rpm for 5 minutes, supernatant was collected. Cells were solubilized in lysis buffer (50 mmol/l HEPES, pH 7.5, 150 mmol/l NaCl, 10 mmol/L EDTA, 10 mmol/l Na4P2O7, 2 mmol/L Na3VO4, 100 mmol/L NaF, 10% glycerol, 1% Triton X-100, 1 mmol/L PMSF, 10 mg/ml aprotinin) for 1 h at 4C and lysates were centrifuged at 5,000g for 20 min. Total homogenates were separated by SDS-PAGE and transferred on 0.45 m Immobilon-P membranes. Upon incubation with primary and secondary antibodies, immunoreactive bands were detected by ECL according to the manufacturer's instructions.
3.8 Real-Time RT-PCR analysis
Total cellular RNA was isolated from adipose tissue and 3T3L1 cells by using the RNeasy Lipid kit (QIAGEN Sciences, Germany), according to manufacturer’s instructions. 1 μg of tissue or cell RNA was reverse-transcribed using Superscript III Reverse Transcriptase (Invitrogen, CA). PCR reactions were analyzed using SYBR Green mix (Bio-Rad, Hercules, CA). Reactions were performed using Platinum SYBR Green qPCR Super-UDG using an iCycler IQ multicolor Real Time PCR Detection System (Bio-rad, Hercules, CA). All reactions were performed in triplicate and β-actin was used as an internal standard. Primer sequences used were as follows:
C/EBPα F: 5' TTACAACAGGCCAGGTTTCC 3’ R: 5’ CTCTGGGATGGATCGATTGT 3’ GLUT4 F: 5’ CAGAAGGTGATTGAACAGAG 3’ R: 5’ AATGATGCCAATGAGAAAGG 3’ FABP4 F: 5’ AATCACCGCAGACGACAG 3’ R: 5’ ACGCCTTTCATAACACATTCC 3’ PPARγ F: 5’ TGGTGCCTTCGCTCATGC 3’ R: 5’ CTGTGGTAAAGGGCTTGATGTC 3’ PREP1 F: 5' CCTGGGACAATTAGGATCCAGAACT 3' R: 5' TCCTCTGTTGGGTAGGGATGCC 3' β-ACTIN F: 5’ CGCCCTAGGCACCAGGGTGTG 3’ R: 5’ TCGGTGAGCAGCACAGGGTG 3’ 3.9 Statistical procedures
Data were analysed with the Statview software (Abacus-concepts) by two-factor analysis of variance. P values of less than 0.05 were considered statistically significant.
35
4. RESULTS
4.1 Characterization of Prep1 hypomorphic heterozygous mice adipose tissue
To investigate the impact of Prep1 deficiency in adipose compartment, I first evaluated the epididymal adipose tissue weight of wild-type (WT) and
Prep1i/+ mice. As shown in figure 9, a reduction of epididymal fat pad weight in Prep1 hypomorphic heterozygous mice was observed.
Figure 9: Epididymal adipose tissue weight of Prep1i/+and WT mice.
Adipose tissue of Prep1i/+ and WT mice were dissected and weighed. The graphs show percent of epididymal adipose tissue weight/total body weight. Values are means ±SD of six mice for groups of five different evaluation. (*P < 0.05).
Next, I performed an histological analysis of adipose tissue of Prep1i/+ and WT mice. Hematoxylin-eosin staining revealed that Prep1 hypomorphic heterozygous adipocytes had a significantly reduced cell area (6149.25±1070.18 μm2
) compared to the adipocytes of the WT mice (9605.94±2522.07 μm2
Figure 10: Histological analysis of adipose tissue from Prep1i/+ and WT mice.
Sections from epididymal adipose tissue from 6-months-old Prep1i/+ and WT littermates were stained with hematoxylin-eosin (original magnification 40X). The microphotographs shown are representative of findings observation in five Prep1i/+ and seven control animals. Image-Pro Plus© program was used for area measurement. Values were obtained from eight different observation in five Prep1i/+ and seven control animals. (**P < 0.01).
Despite the reduced cell area, there was no significant difference in cell number between WT (57±16 cells/HPF) and Prep1i/+ (72±26 cells/HPF) adipocytes (figure 11).
Figure 11: Adipocytes number of Prep1i/+ mice.
Sections from epididymal adipose tissue from 6-months-old Prep1i/+ and WT littermates were stained with hematoxylin-eosin. Image-Pro Plus© program was used for cells number
37 measurement. Values were obtained from eight different observation in five Prep1i/+ and seven control animals
4.2 Prep1 deficiency leads to increased expression of adipogenic markers
To further study the function of Prep1, I evaluated the expression of some markers of adipocytes differentiation, including C/EBPα, GLUT4,
FABP4 and PPARγ in Prep1 hypomorphic heterozygous and WT mice. In
adipose tissue of Prep1i/+ mice there was a significant increase of C/EBPα,
GLUT4 and FABP4 mRNA expression, while PPARγ expression level did not
change (figure 12).
Figure 12: C/EBPα, GLUT4, FABP4 and PPARγ mRNA levels in Prep1i/+ mice.
The abundance of C/EBPα, GLUT4, FABP4 and PPARγ mRNAs were determined by real-time RT-PCR analysis of total RNA isolated from the adipose tissue of heterozygous and control mice, using β-actin as internal standard. Bar represents the mean ± SD of four independent experiments, in each of which reactions were performed in triplicate using total RNAs obtained from eight mice per genotype. Asterisks denote statistically significant differences (*P<0.05; **P < 0.01).
Consistent with these data, protein expression of C/EBPα, GLUT4 and FABP4 was increased in the adipose tissue of Prep1i/+ mice, while PPARγ protein levels were unchanged (figure 13).
Figure 13: C/EBPα, GLUT4, FABP4 and PPARγ protein levels in Prep1i/+
mice.
Tissues from Prep1 hypomorphic heterozygous and control mice were dissected, solubilized, and protein samples analyzed by Western blot with C/EBPα, GLUT4, FABP4 and PPARγ antibodies. Actin antibody was used for normalization. Blot were revealed by ECL and autoradiograph is representative of three independent experiments.
4.3 Insulin signaling and [U-14C]glucose uptake in adipose tissue of Prep1-deficient mice
To investigate the role of Prep1 in adipose tissue function, WT and
Prep1i/+ mice were intraperitoneally injected with insulin (0,15U/g) and the activation of the downstream molecular effectors were analyzed by Western blot. As shown in figure 14, in adipose tissue of Prep1 hypomorphic heterozygous mice I observed a significant increase of insulin receptor (IR)-tyrosine phosphorylation, upon insulin stimulation, while protein level did not change. Both the downstream effectors, AKT and MAP kinases, were also more activated in the Prep1i/+ mice, with no difference in their expression.
39
Figure 14: Insulin receptor, AKT and MAP kinase phosphorylation in Prep1i/+ mice.
Tissues from Prep1 hypomorphic heterozygous and control mice were dissected, solubilized, and protein samples analyzed by Western blot with pIR-Tyr1146, IR, pAKT –Ser473, AKT, pMAPK, MAPK antibodies. Actin antibody was used for normalization. Blot were revealed by ECL and autoradiograph is representative of three independent experiments.
Next, I measured the insulin-stimulated [U-14C]glucose uptake of mature adipocytes isolated from Prep1i/+ and WT mice adipose tissue. The graph (figure 15) shows a 3- and 2-fold increase of [U-14C]glucose uptake of