Titolo
Validation of a 1D thermal-hydraulic module against Circe experimental data
Ente emittente CIRTEN
PAGINA DI GU
ARDIA
Descrittori
Tipologia del documento: Collocazione contrattuale:
Rapporto Tecnico
Accordo di programma ENEA-MSE: tema di ricerca "Nuovo nucleare da fissione"
Generation IV Reactors Neutronica
Termoidraulica dei metalli liquidi Argomenti trattati:
Sommario
A new multi-physics simulation tool, FRENETIC (Fast REactor NEutronics/Thermal-hydrauI1Cs), has been recently developed, for the quasi-3D analysis of a lead-cooled fast reactor core with the hexagonal fuel element configuration, as currently proposed within the framework ofthe European project LEADER.
The tool, as opposed to popular thermal-hydraulic system codes like, e.g., Relap5, implements coupled neutronic andTH models. Its main aim is to provide solutions for core design and/or safety analysis, ina way which is computationally effective.
Inthe TH module, the hexagonal elements are described by I D(axial) transient heat advection and conduction in thecoolant, coupled to conduction inthe fuel pins; each element isthen thermally coupled to itsneighbors inthe transverse directions, to obtain the full-core evolution of the distribution of the TH variables (axial speed, pressure and temperature 01
the coolant).
Here we present the first validation of the TH model in FRENETIC against data from the ENEA Integrai Circulation Experiment (ICE), using Lead-Bismuth Eutectic as a coolant. In ICE a single hexagonal element is present, including an electrically heated Fuel Pin Simulator. The evolution of the temperature computed at different heights of the FPSwillbe compared withthe values measured in two different campaigns.
Note
PAR2011 LP3-A2.C.
Autori: R. Bonifetto, L.Savoldi Richard, R.Zanino (POLITO)
Copia n. In carico a: NOME APPROVAZIONE 2 FIRMA NOME 1 FIRMA
o
EMISSIONE 18/09/201fNOMEf----+-------+-NAI1+-/+-I/M./-ibr
éK,.~~ino,-+---------NA 1FIRMA Il'\J
,/ V[ST CONVALIDA
Validation of a 1D thermal-hydraulic module against Circe experimental
data
R. Bonifetto, L. Savoldi Richard, R. Zanino
18 September 2012
Index
Abstract ... 3
Introduction ... 4
Short summary of the thermal-hydraulic model in FRENETIC ... 4
Experimental setup ... 5
Boundary conditions... 9
Results from the first campaign ... 9
Results from the second campaign ...10
Effect of pin-LBE heat transfer ...15
Conclusions and perspective...16
References ...16
Nomenclature...16
Abstract
FRENETIC is a recently developed multi-physics code for the analysis of lead-cooled fast reactor cores having the closed hexagonal fuel element configuration, which is the currently proposed configuration for the DEMO-LFR ALFRED within the framework of the European project LEADER. A first validation of the thermal-hydraulic module of this code is presented here. The coolant and pin (surface) temperature computed by the code are compared in this report with data coming from 2 different experimental campaigns in the CIRCE facility at the ENEA Brasimone Research Centre. The agreement between computed and measured coolant temperature at different heights in the test section is very good. The computed pin surface temperature presents on the contrary some disagreement that will require further investigation.
Introduction
A new multi-physics simulation tool, FRENETIC (Fast REactor NEutronics/Thermal-hydraulICs), has been recently developed [1], [2], for the quasi-3D analysis of a lead-cooled fast reactor core with the hexagonal fuel element configuration, as currently proposed within the framework of the European project LEADER.
The tool, as opposed to popular thermal-hydraulic (TH) system codes like, e.g., Relap5, implements coupled neutronic and TH models. Its main aim is to provide solutions for core design and/or safety analysis, in a way which is computationally effective [2].
In the TH module, the hexagonal elements are described by 1D (axial) transient heat advection and conduction in the coolant, coupled to conduction in the fuel pins; each element is then thermally coupled to its neighbors in the transverse directions, to obtain the full-core evolution of the distribution of the TH variables (axial speed, pressure and temperature of the coolant).
Here we present the first validation of the TH model in FRENETIC against data from the ENEA Integral Circulation Experiment (ICE) [3], using Lead-Bismuth Eutectic (LBE) as a coolant. In ICE a single hexagonal element is present, including an electrically heated Fuel Pin Simulator (FPS). The evolution of the temperature computed at different heights of the FPS will be compared with the values measured in two different campaigns.
Short summary of the thermal-hydraulic model in FRENETIC
The thermal hydraulic model in FRENETIC approximates the 3D problem in the full core geometry as 2D thermal coupling of 1D advection-diffusion problems solved along each hexagonal assembly. This approach is justified by the separation of heat transfer timescales discussed in [2]. For each assembly, both the coolant temperature T and the fuel temperature TF are considered to be uniform (but different from each
other) on the cross section. Then T and TF depend only on the axial position z and on the time t.
Along each assembly we solve the transient 1D mass (Eq. 1), momentum (Eq. 2) and energy (Eq. 3) balances, for the coolant axial speed v (z, t), pressure p (z, t) and T (z, t), coupled with 1D heat conduction (Eq. 4) along the fuel pins, for TF (z, t):
β
ρ
cos
1
g
Fv
z
p
z
v
v
t
v
−
−
=
∂
∂
+
∂
∂
+
∂
∂
(1)(
)
+
−
Π
Φ
=
∂
∂
∂
∂
Φ
−
∂
∂
+
∂
∂
+
∂
∂
F
v
T
T
A
H
z
T
k
z
z
p
v
z
v
c
t
p
s F F sρ
ρ
, 2 (2)(
T
T
)
v
F
A
H
z
T
k
z
z
v
T
c
z
T
v
c
t
T
c
F Fs v v vρ
ρ
ρ
ρ
=
Π
−
+
∂
∂
∂
∂
−
∂
∂
Φ
+
∂
∂
+
∂
∂
, (3)(
)
F fuel s F F F F F F F FA
Q
T
T
A
H
z
T
k
z
t
T
c
=
Π
−
+
∂
∂
∂
∂
−
∂
∂
,ρ
(4)where A is the coolant cross section, cF is the fuel specific heat, cs is the sound speed, cv is the coolant
specific heat at constant volume, F accounts for friction effects
h
D
v
f
F
=
2
(5)(f is the Fanning friction factor and Dh is the hydraulic diameter), g is the gravity acceleration, H is the
coolant-pin surface heat transfer coefficient, k is the coolant thermal conductivity, kF is the fuel thermal
conductivity, ΠF is the pin perimeter, Qfuel is the linear power generation (W/m) in the fuel, β (= 0 here) is
the angle between z and vertical direction, ρ is the coolant density, TF,s is the pin surface temperature, Φ is
the Gruneisen parameter
s T T ∂ ∂ = Φ
ρ
ρ
(6)The term H × [TF,s(z, t) – T(z, t)] in (Eq. 2) and (Eq. 3), and its equivalent in (Eq. 4), describes the heat
transfer between the pin surface at temperature TF,s and the coolant. In the model we implement this term
as H* × [TF(z, t) – T(z, t)] , where H* = H × [TF,s(z, t) – T(z, t)] / [TF(z, t) – T(z, t)] and use in H* an approximate
value for TF,s, estimated assuming a parabolic radial temperature distribution inside the pin
TF,s(z, t) = TF(z, t) – Qfuel(z, t)/AF×rpin 2
/(8×kF) (7)
where Qfuel(z, t) is the heat generation rate and rpin is the pin radius.
The heat transfer coefficient H used to compute the pin-coolant heat transfer is obtained from the Nusselt number, whose values as a function of the Reynolds number are reported in Table 1.
Table 1. Reynolds dependence of the Nusselt number.
Re Nu 9157 15.146 19620 17.148 32700 19.157 65410 23.288 130800 30.066
This correlation was obtained from CFD analysis [4] and is implemented in the model as a piecewise linear function.
The thermophysical properties of the LBE coolant are temperature dependent (including the density, in order to capture buoyancy effects) and taken from [5], while f is taken from correlations reported in [6].
Experimental setup
In the frame of the THINS (Thermal Hydraulic of Innovative Nuclear System) Large Scale Collaborative Project (7th Framework Program EU), ENEA assumed the commitment to design, implement and carry out the large scale integral test called ICE.
The objective of this experiment is to characterize the phenomena of mixed convection and stratification in a heavy liquid metal pool in the safety-relevant situation, that is during the transition from nominal flow conditions to the natural circulation typical of Decay Heat Removal (DHR) conditions.
ICE is performed in the CIRCE large scale facility at the ENEA Brasimone Research Centre. CIRCE basically consists of a cylindrical main vessel (S100) filled with about 70 tons of molten LBE and equipped with: argon cover gas and recirculation system, LBE heating and cooling systems, several test sections welded to and hung from bolted vessel heads for separate-effect and integral testing, as well as auxiliary
equipment for eutectic circulation. The facility also includes an LBE storage tank (S200), a small LBE transfer tank (S300) and the data acquisition system, see Fig. 1.
The CIRCE main vessel hosts the ICE test section, which consists of the following main components, see Fig. 2a:
- Downcomer: it is the volume between the test section and the main vessel which allows the hydrodynamic connection between the outlet section of the Heat Exchanger (HX) and the inlet section of the feeding conduit.
Figure 1. Isometric view of the CIRCE facility.
- Feeding Conduit: it is the inlet pipe of the test section which allows the hydrodynamic development of the upward primary flow rate towards the flow meter.
- FPS: shown in Fig. 2b and Fig. 3, it is the part of ICE on which we focus for the validation exercise presented here. It provides the Heat Source (HS) for the test and is instrumented with several thermocouples at different axial and radial locations, as discussed in more detail below. The FPS is connected in the lower section to the flow meter and in the upper section to the insulation volume by the coupling flange. In the upper section, the FPS is hydraulically linked to the fitting volume, ensuring the continuity of the main flow path.
- Fitting Volume: it is placed in the middle part of the test section, allowing the hydraulic connection between the HS and the riser. It contains a pressure sensor.
- Riser: it is a pipe connecting the fitting volume with the separator. In the lower section, a nozzle is installed to allow the argon injection.
- Separator: it is a volume needed to connect the riser with the HX. It allows the separation of the LBE flowing downward into the HX from the Argon flowing in the test section cover gas through the free surface. Moreover, the separator assures that the overall LBE flow rate flows directly into the HX (shell – side) before falling down in the downcomer.
Figure 2. (a) ICE flow path and main components. (b) Zoom on the FPS, highlighting the three sections containing the thermocouples.
- Heat Exchanger: it corresponds to the heat sink of the system.
A first test campaign has already been completed on ICE in 2011 [3]. Several modifications have been implemented on the ICE test section, before the second experimental campaign, which started in June 2012. In particular:
- installation of more suitable instrumentation on the main HX, to better evaluate the power extracted by the component, monitoring the LBE temperature in some sub-channels of the HX, through the bayonet tubes;
- improvement of the thermal-hydraulic coupling of the main HX with the downcomer, adding a suitable flow straightener in the lower part of the shell;
- installation of the decay heat removal heat exchanger into the pool;
- installation of suitable instrumentation for the assessment of mixing and thermal stratification in the pool;
- instrumentation of the FPS (see Fig. 2b and Fig. 4), aiming at the evaluation of the heat transfer coefficient in a rod bundle cooled by heavy liquid metal and of the hot spot factor due to the installed spacer grid along the bundle, by monitoring the evolution of both the LBE bulk temperature and the pin cladding temperature. For that purpose, sections 1 and 3, see Fig. 2b, are equipped each with 3 thermocouples measuring the coolant temperature at different locations and 6 thermocouples measuring the pin surface temperature, see Fig. 4, whereas on section 2, in correspondence of the middle spacer grid, see Fig. 2b, only the pin cladding temperature is measured.
Figure 4. Cross section of the hexagonal FPS with installed TCs (red dots) corresponding to section 1, 20 mm below the middle spacer grid (a), and section 3, 60 mm below the upper spacer grid (b).
Boundary conditions
The computational domain is limited to the heated section of ICE, i.e. the FPS.
The experimental power input, obtained from the calorimetry of the LBE flow in the FPS, is used as driver of the transient.
As boundary conditions for the flow we impose the LBE mass flow rate and temperature at the inlet and the pressure at the outlet.
The heat transfer between the HS and the LBE in the downcomer (assumed to be at T = Tin) is also
taken into account, considering the two wrappers and the stagnant LBE (see Fig. 3) as thermal resistances. At the ends the pins are assumed to be adiabatic in the axial direction.
Results from the first campaign
A first validation has been carried out using data from the full power characterization test performed during the first experimental campaign [3]. The comparison with the (more detailed) data from the second experimental campaign will be presented in the next section.
In the first test campaign, the full-power steady-state enhanced circulation test started with the Argon gas injection through the nozzle installed into the bottom of the riser. After the LBE steady state flow
(a)
(b)
rate (~60 kg/s) was established, the power in the HS was ramped up in ~300 s, from 0 to its nominal value (800 kW); when the full power was reached, also the cooling water supply to the heat exchanger was started.
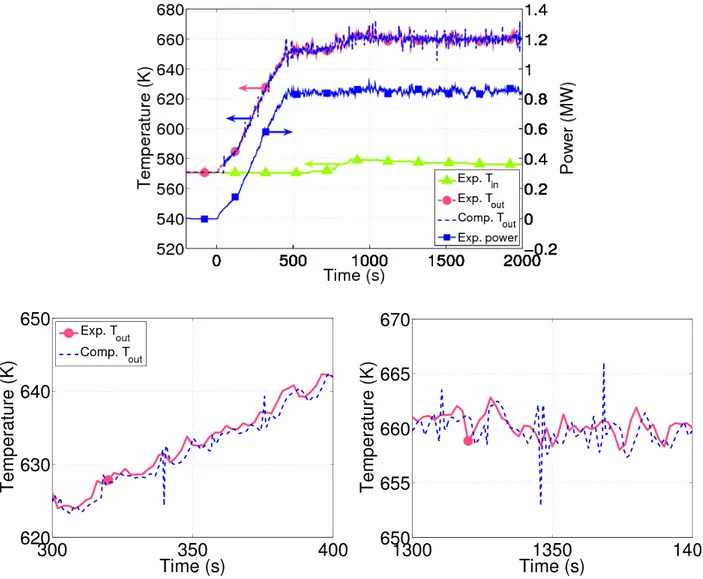
The computed LBE temperature at the outlet of the HS (the only thermocouple available in the FPS during the first experimental campaign) is compared in Fig. 5 with the experimental one, showing a very good agreement both during the ramp-up transient (starting at time t = 0 s in Fig. 5) and at steady state. Oscillations in the outlet temperature are due to oscillations in the experimental input power, as seen in the figure, as well as to oscillations in the mass flow rate, induced by the gas injection system consisting of a set of gas blowers (volumetric compressor).
Figure 5. Computed (blue dashed line) vs. experimental (red solid circles) outlet temperatures during the full power characterization test. The experimental inlet temperature (green solid triangles) and the experimental input power (blues solid squares) are also reported. The zooms between 300 and 400 s and between 1300 and 1400 s show that the discrepancy is at most of 1-2 K, except when spikes are present in
the computed solution.
Results from the second campaign
The encouraging results from the previous section constitute the basis for a more detailed validation effort presented in this section, using the experimental data coming from the second test campaign of ICE. The
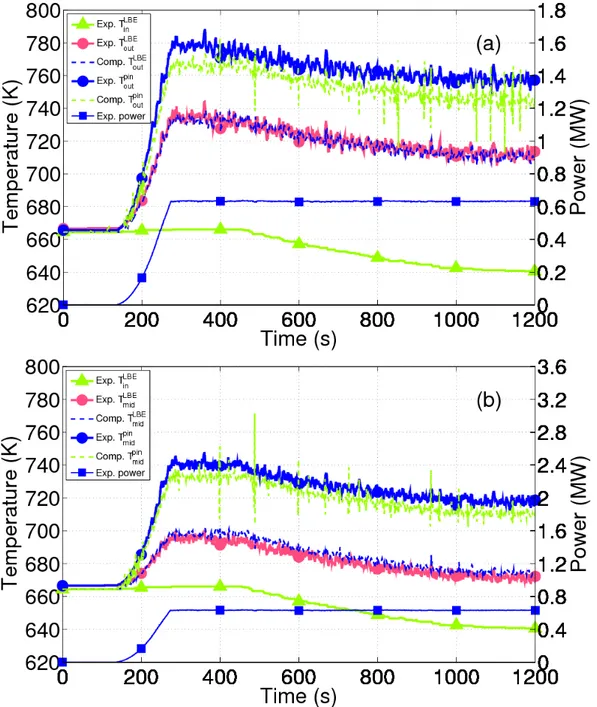
scenario analyzed is again a power ramp-up transient, faster than the one in first campaign, see the input power evolution in Fig. 6. The new instrumentation, described in experimental setup section, includes new thermocouples (see Fig. 4) and allows the comparison between the computed (average) temperature of the coolant and the average of the measured (local) coolant temperatures at the FPS outlet (Fig. 6a) and also in a mid-height section of the FPS (Fig. 6b).
The LBE temperature is captured very well in both sections of the FPS, both during the transient and steady state phases. For each section, the experimental temperature value plotted in Fig. 6 is obtained as average of the 3 sub-channel temperature values, i.e. TC-FPS01, TC-FPS02, TC-FPS03 for the mid-height section and TC-FPS21, TC-FPS23, TC-FPS24 for the top (outlet) section.
Figure 6. Computed (blue dashed line) vs. experimental (red solid circles) coolant temperature and computed (green dashed line) vs. average of the experimental (blue solid circles) pin surface temperatures
experimental inlet temperature (green solid triangles) and the experimental input power (blues solid squares) are also reported.
As to the fuel pins, the comparison between computed and measured values is more delicate: the pin surface temperature is computed in the code assuming a uniform heat generation inside the pin volume, resulting in a parabolic temperature distribution in the pin cross section. The (electrical) input power distribution inside the single pins is instead nonuniform, due to the presence of 2 wires for the electrical power generation (Fig. 7) [6], that induce local peaks in power generation, and this may partly explain the (relatively small) underestimation of the pin surface temperature seen in Fig. 6.
Figure 7. Active zone pin cross section [6].
As for the coolant temperature, also the experimental pin surface temperature value plotted in Fig. 6 is obtained as average of the 3 measured temperature values in each section, i.e. FPS04, FPS05, FPS06, FPS07, FPS08, FPS09 for the mid-height section and FPS16, FPS17, FPS18, TC-FPS19, TC-FPS20, TC-FPS22 for the top (outlet) section. Figs. 8-9 show the comparison between computed surface temperature and all the thermocouple traces at the outlet (Fig. 8) and mid-height (Fig. 9) cross sections of the FPS, respectively.
Figure 8. Pin surface temperature measured by the 6 thermocouples on the outlet cross section, compared with the computed (average) value.
Figure 9. Pin surface temperature measured by the 6 thermocouples on the mid-height cross section, compared with computed average value.
The 2 zooms in Fig. 8 show that difference between the hottest and the coldest (measured) pin surface temperature is ~20 K, while the computed average is slightly (1-5 K) underestimating the lowest measured temperature. The 2 zooms in Fig.9 show that difference between the hottest and the coldest (measured) pin surface temperature is ~40 K, while the computed average is bracketed by the highest and lowest measured temperatures.
The oscillating behavior of the temperature values in Fig. 6 can be explained by oscillations in the FPS inlet mass flow rate (Fig. 10). This mass flow rate, together with inlet temperature (Fig. 6) and outlet pressure (Fig. 10), is used in the model as boundary condition.
Figure 10. Experimental evolution of inlet mass flow rate and outlet pressure, used, together with inlet temperature, as boundary conditions for the numerical simulation.
Effect of pin-LBE heat transfer
The reason for the discrepancy between computed and measured pin surface temperature might of course have to do with the heat transfer between pin surface and LBE.
We investigated this effect parametrically by reducing the heat transfer coefficient between the two by a factor 0.75.
The results in Fig. 11 show that, indeed, this small variation, well within the uncertainty with which the HTC is known, is sufficient to capture adequately also the pin surface temperature with the simulation. The agreement between computed and measured coolant temperatures is still good.
Figure 11. Computed (blue dashed line) vs. experimental (red solid circles) coolant temperature and computed (green dashed line) vs. average of the experimental (blue solid circles) pin surface temperatures at outlet (a) and mid-height (b) sections of the FPS, during the full power characterization test, using a heat transfer coefficient between pin and LBE reduced by a factor 0.75 with respect to Fig.6. The experimental
inlet temperature (green solid triangles) and the experimental input power (blues solid squares) are also reported.
Conclusions and perspective
The first validation of the TH model implemented in the recently developed FRENETIC code is presented against data from the first and second campaign of the ENEA Integral Circulation Experiment, using a correlation for the pin-coolant heat transfer coefficient obtained through CFD analysis. A good agreement between the computed and measured dataset is shown, especially in the coolant temperature, in two different sections of the FPS. Among the possible reasons for the discrepancy between computed and measured pin surface temperature it was shown that a simple reduction by 0.75 of the heat transfer coefficient assumed between the two leads to a good agreement.
References
1. R. Bonifetto, S. Dulla, P. Ravetto, L. Savoldi Richard, R. Zanino, “Progress in multi-physics modeling of innovative lead-cooled fast reactors”, Transactions of Fusion Science and Technology, vol. 61 (2012), pp. 293-297.
2. R. Bonifetto, S. Dulla, P. Ravetto, L. Savoldi Richard, R. Zanino, “A full-core coupled neutronic/thermal-hydraulic code for the modeling of lead-cooled nuclear fast reactors”, submitted to Computers and Structures (2012).
3. M. Tarantino, P. Agostini, G. Benamati, G. Coccoluto, P. Gaggini, V. Labanti, G. Venturi, A. Class, K. Liftin, N. Forgione, V. Moreau, “Integral Circulation Experiment: Thermal-Hydraulic Simulator of a Heavy Liquid Metal Reactor,” Journal of Nuclear Materials, vol. 415 (2011), pp. 433-448.
4. I. Di Piazza, private communication (2012).
5. “Handbook on Lead-Bismuth Eutectic Alloy and Lead Properties, Materials, Compatibility, Thermal-hydraulics and Technologies”, OECD-NEA (2007).
6. G. Bandini, I. Di Piazza, P. Gaggini, A. Del Nevo, M. Tarantino, “CIRCE experimental set-up design and test matrix definition”, ENEA Report IT-F-S-001 (2011).
Nomenclature
A coolant cross section cF fuel specific heat
cs sound speed
cv coolant specific heat at constant volume
Comp computed
D diameter
DHR Decay Heat Removal
EU European Union
Exp experimental
f Fanning friction factor FPS Fuel Pin Simulator
FRENETIC Fast REactor NEutronics/Thermal-hydraulICs g gravity acceleration
H coolant–pin surface heat transfer coefficient HTC Heat Transfer Coefficient
HS Heat Source
ICE Integral Circulation Experiment k thermal conductivity
LBE Lead-Bismuth Eutectic
LEADER Lead-cooled European Advanced DEmonstration Reactor
p pressure
Qfuel linear power generation into fuel
qv volumetric heat generation rate
r radius
T temperature
t time
TCs ThermoCouples
TH Thermal-Hydraulic
THINS Thermal Hydraulic of Innovative Nuclear System
v speed
z axial coordinate
β angle between z and vertical direction ΠF pin perimeter ρ density Φ Gruneisen parameter Subscripts F fuel h hydraulic in inlet out outlet s surface
Short scientific curriculum of the research group
The research group operates at the Energy Department of Politecnico di Torino and is composed by Prof. Roberto Zanino, Dr. Laura Savoldi and Mr. Roberto Bonifetto, a PhD student.
The group has more than 20 years experience in nuclear engineering research, including thermal-hydraulic analysis of magnetic confinement fusion reactor components and in particular the development of computational tools for the superconducting magnet refrigeration system modeling and the application of CFD tools to the blanket/first wall and vacuum vessel analysis.
Further details and the publication lists of the group members can be found on the Politecnico di Torino website:
http://staff.polito.it/roberto.zanino/
http://porto.polito.it/view/creators/Zanino=3ARoberto=3A001876=3A.html http://porto.polito.it/view/creators/Savoldi=3ALaura=3A003575=3A.html http://porto.polito.it/view/creators/Bonifetto=3ARoberto=3A026979=3A.html


![Figure 7. Active zone pin cross section [6].](https://thumb-eu.123doks.com/thumbv2/123dokorg/5628056.68835/13.892.240.641.408.677/figure-active-zone-pin-cross-section.webp)


