UNIVERSITÀ DEGLI STUDI DI CATANIA
Dottorato di Ricerca in Biomedicina Traslazionale
XXX Ciclo
Coordinatore: Prof. Lorenzo Malatino
A
NTONINO
D
I
P
INO
Role of HbA1c in identify subjects with prediabetes and
preclinical cardiovascular risk.
Tesi di Dottorato
Relatore:
Chiar.mo Prof. Francesco Purrello
INDEX
1: Introduction
1.1 Prediabetes: definition and clinical characteristics pag 2 1.2 Comparison of IFG, IGT and HbA1c, criteria pag 6
in predicting type 2 diabetes.
1.3 Comparison of IFG, IGT and HbA1c, criteria pag11
in predicting cardiovascular disease.
1.4 Treatment of prediabetes pag 16
2: Scientific Reports
2.1 Background pag 20
2.2 Cardiovascular Risk Profile in Subjects With Prediabetes and pag 22 New-Onset Type 2 Diabetes Identified by HbA1c According to
American Diabetes Association Criteria.
2.3 Low circulating vitamin D levels are associated with increased pag 38 arterial stiffness in prediabetic subjects identified according to HbA1c.
2.4 Low endogenous secretory RAGE levels are associated with pag 55 inflammation and carotid atherosclerosis in prediabetes.
2.5 HbA1c identifies subjects withprediabetes and subclinical left pag 77
ventricular diastolic dysfunction
2.6 Low advanced glycation end-product diet improves the lipid and pag 95 inflammatory profiles of prediabetic subjects
3 – Conclusions pag 114
4 - Scientific Production pag 116
1 - Prediabetes: definition and clinical characteristics
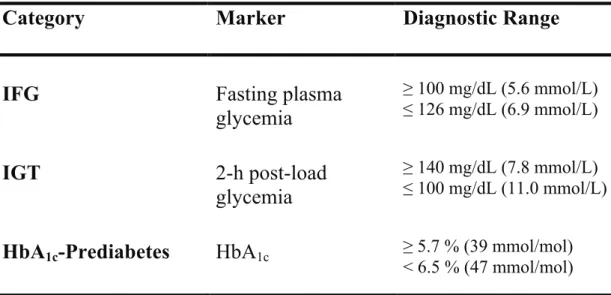
Pre-diabetes is a general term that refers to an intermediate stage between normal glucose homeostasis and overt type 2 diabetes mellitus. There are three diagnostic criteria for pre-diabetes, according to American Diabetes Association (ADA) (Table 1):
• fasting glycemia between 100 and 125 mg/dL (impaired fasting glucose, IFG);
• 2-hours glycemia between 140 and 199 mg/dL after oral glucose tolerance test (impaired glucose tolerance, IGT);
• glycated hemoglobin A1c (HbA1c) between 5.7 e 6.4%.
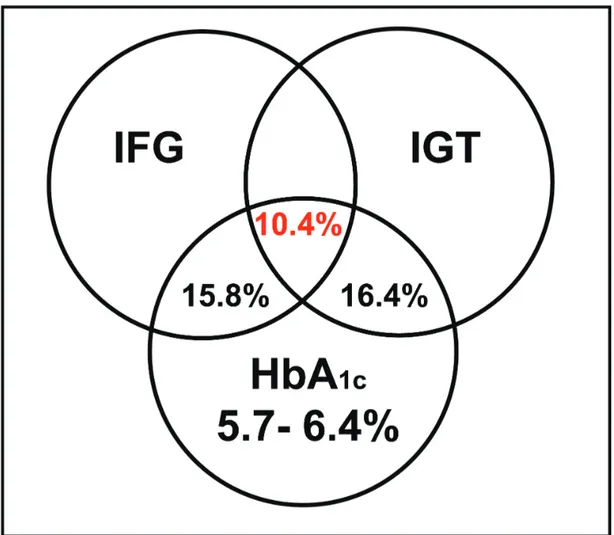
Increasing evidence suggests that the agreement between pre-diabetes diagnoses made by IFG, IGT or HbA1c is scarce and, as pointed out by the ADA, the
characterization of subjects discordantly categorized by the three tests is, to date, pending 1. In a study conducted on a large cohort of Caucasian adults the agreement
between the three diagnostic criteria was only 10.4% (Figure 1)2.
The discordance in the identification of individuals with pre-diabetes using three different diagnostic tests is not entirely unexpected given that measurements of fasting plasma glucose, 2-hours post OGTT, and HbA1c are likely to reflect different
aspects of glucose metabolism, and a diagnosis of pre-diabetes based on IFG, IGT, or HbA1c may represent the different pathophysiologic mechanisms underlying
abnormal glucose homeostasis 2. In fact, subjects with isolated IFG seem to have a moderate liver insulin resistance, impaired first-phase insulin secretion, and normal/near-normal muscle insulin sensitivity, while subjects with IGT should be
Table 1: Diagnostic criteria for categories at increased risk of diabetes.
Category
Marker
Diagnostic Range
IFG
Fasting plasma
glycemia
≥ 100 mg/dL (5.6 mmol/L) ≤ 126 mg/dL (6.9 mmol/L)IGT
2-h post-load
glycemia
≥ 140 mg/dL (7.8 mmol/L) ≤ 100 mg/dL (11.0 mmol/L)HbA
1c-Prediabetes
HbA
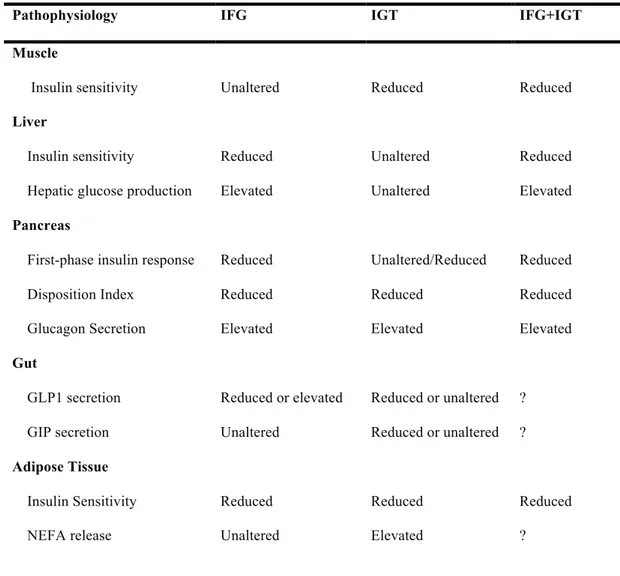
1c ≥ 5.7 % (39 mmol/mol)< 6.5 % (47 mmol/mol) resistance combined with defective late insulin secretion, thus resulting in prolonged hyperglycaemia after a glucose load 3,4. All the pathophysiologic abnormalities
characterizing IFG and IGT status are showed in Table 2. In contrast to the daily glucose picture offered by IFG and IGT, HbA1c is an indicator of the average blood
glucose concentrations over the preceding 2–3 months, accounting for chronic exposure to both basal and postprandial hyperglycaemia and, therefore, may reflect a combination of pathophysiologic defects underlying both IFG and IGT. To date, it is still not clear if these aspects that are strictly bound to the physiopathology of pre-diabetes may have a clinical relevance in view of a possible therapeutic intervention. Cardiovascular disease (CVD) is the leading cause of death among individuals with type 2 diabetes, accounting for 40% to 50% of all deaths 5. Although type 2 diabetes
is frequently associated with other cardiovascular risk factors, such as dyslipidemia and hypertension, it is believed that chronic hyperglycaemia per se is an independent risk for macrovascular complications. Currently, it is well established that macrovascular disease starts before the development of diabetes, and the slight
Figure 1: Agreement between HbA1c pre-diabetes, impaired fasting glucose and impaired glucose
tolerance 2.
or pharmacological intervention to prevent diabetes in these high risk subjects 6;
however, few studies have been conducted with specific focus on CVD prevention in this population. Since many clinical trials have failed to demonstrated a reduction in cardiovascular risk from glucose-lowering interventions in patients with overt type 2 diabetes 7,8, it is noteworthy that several studies have reported benefits in improving
cardiovascular risk factors, as well as absolute CVD event rates, in people with pre-diabetes treated with glucose lowering drugs 9–11.
Since the value of a predictive test for pre-diabetes is also determined by its ability to indicate the risk of macrovascular complication, an important question is whether
Table 2. Pathophysiology of IFG and IGT.
Pathophysiology IFG IGT IFG+IGT
Muscle
Insulin sensitivity Unaltered Reduced Reduced
Liver
Insulin sensitivity
Hepatic glucose production
Reduced Elevated Unaltered Unaltered Reduced Elevated Pancreas
First-phase insulin response Disposition Index Glucagon Secretion Reduced Reduced Elevated Unaltered/Reduced Reduced Elevated Reduced Reduced Elevated Gut GLP1 secretion GIP secretion Reduced or elevated Unaltered Reduced or unaltered Reduced or unaltered ? ? Adipose Tissue Insulin Sensitivity NEFA release Reduced Unaltered Reduced Elevated Reduced ?
risk of CVD. Data on cardiovascular risk comparing IFG, IGT, and HbA1c in the
pre-diabetic range are sparse, have been focused on mortality, and have reached controversial results 12–14.
This thesis highlights recent studies and current controversies in the field. In consideration of the expected increased use of HbA1c as a screening tool to identify
individuals with alterations of glycaemic homeostasis, we thought that it could be interesting, and relevant from the clinical point of view, to evaluate the evidence regarding the ability of HbA1c to identify patients who have increased cardiovascular
1.2 - Comparison of IFG, IGT and HbA1c, criteria in predicting type 2 diabetes
Subjects with pre-diabetes have shown a high conversion rate to overt diabetes and much clinical research has focused on lifestyle or pharmacological intervention to prevent diabetes in these high risk subjects 6. Subjects with an isolated alteration of
glucose homeostasis (IFG, IGT or HbA1c 5.7-6.4%) have an incidence of diabetes of
6% per year, a value that is significantly higher compared with subjects with normoglycemia (0.5% per year) 15. Progression to overt type 2 diabetes is 30-40% in
the next 3-8 years, with an increase of 10% when two alterations of glucose homeostasis are present 6.
Changes in diagnostic and screening criteria may have an important impact on the number and characteristics of patients in whom pre-diabetes is diagnosed and, subsequently, on a population that should be considered for a possible therapeutic intervention. According with these considerations, it is important to identify individuals at high risk for type 2 diabetes to prevent or delay the development of the disease and its complications.
In 2011, the ADA revised the criteria for the diagnosis of type 2 diabetes and the categories at increased risk for diabetes. On the basis of an ample analysis performed by an international expert committee, the use of HbA1c measurement was
recommended as another diagnostic test option already including IFG and IGT 1.
Specifically for the categories of increased risk for type 2 diabetes, the new ADA recommendations state that an HbA1c from 5.7-6.4% identifies individuals at high
risk for diabetes to whom the term pre-diabetes may be applied.
costly, and less reproducible than the measurement of fasting plasma glucose (FPG)
16. HbA
1c can indirectly measure mean blood glucose over the previous 2–3 months
and is correlated with FPG and 2-h plasma glucose 17. HbA
1c is more reproducible
than FPG and within subject coefficients of variation are 1.7 and 5.7%, respectively
17,18. Moreover, measurement of HbA
1c does not require fasting status and could
better integrate chronic hyperglycaemia than FPG (Table 3). Several prospective studies have reported the utility of HbA1c in predicting type 2 diabetes. Morris et al. 19 has shown in a metanalysis conducted on 70 studies that the progression rate to
type 2 diabetes of patients with HbA1c pre-diabetes was similar to that for
ADA-defined IFG and IFG plus IGT. Furthermore, four prospective studies have reported the utility of HbA1c in predicting type 2 diabetes 20–23; of these, one assessed the use
of two glycemic parameters (in particular IFG and HbA1c) for predicting the
incidence of type 2 diabetes; the authors supported the combined measurement of FPG and HbA1c for predicting diabetes incidence in a 4 year follow-up using receiver
operating characteristic curve (ROC) analysis. In all participants, the model including both FPG and HbA1c had a greater ROC curve that those including FPG
alone (0.853 vs 0.818; P<0.001) or HbA1c alone (0.853 vs 0.771; P<0.001).
Furthermore, the authors reported a weak correlation between HbA1c and FPG at
baseline suggesting that HbA1c is not a surrogate marker of FPG 23.
It is necessary to remember that, as far as it is a risk factor for diabetes, HbA1c
between 5.7-6.4% seems to identify a much smaller population with pre-diabetes compared with IFG and IGT 24,25. Conversely, the use of HbA
1c may also lead to the
reclassification of subjects without IFG or IGT as having pre-diabetes 26. On the
Table 3 Main points supporting/not supporting the use of HbA1c as diagnostic tool for diagnosis of
pre-diabetes.
Supporting Not Supporting
HbA1c may better integrate chronic
hyperglycaemia than fasting and 2-h post-load glycaemia.
HbA1c seems to have a lower sensitivity in
pre-diabetes diagnosis. HbA1c predicts microvascular complications
(rethinopathy and nephropathy) similarly to
fasting and 2-h post-load glycaemia. Standardization of HbA1c assay needs to be
improved. HbA1c has a higher predictive value than fasting
plasma glucose in predicting cardiovascular
disease. conditions (haemoglobinophaties, malaria, Common, and not always known, clinical anaemia, blood loss) may significantly interfere
with HbA1c assay.
HbA1c has a greater pre-analytical stability than
blood glucose.
HbA1c assay does not need fasting status.
Ethnic differences in HbA1c assayare not well
characterized.
HbA1c is not affected by acute perturbations
(exercize, stress, diet). little information on pathophysiological processes The low biological variability of HbA1c provides involved in pre-diabetes.
HbA1c biological variability is lower than fasting
and 2-h post-load glycemia.
HbA1c may be an attractiveoption in settings in
which OGTT is not used and rarely repeated. Glucose assessment is cheaper thant HbA1c assay.
diagnosis 27. Contrary to these considerations, Rosella et al. 28 recently reported that
the prevalence of undiagnosed pre-diabetes in a representative sample of Canadians was significantly greater using screening strategies that used HbA1c measures
compared with plasma glucose diagnostic criteria. The authors hypothesized that this “reverse association” may be due to a number of factors, such as ethnic differences and the increased prevalence of pre-diabetes from 11.6% in 2003 to 35.3% in 2011
29. Accordingly, in a study conducted in the Mexican population, Kumar A et al. 30
cardiovascular risk evaluation; although we did not perform an opportunistic procedure during recruitment, the group with high HbA1c and normal fasting glucose
and normal glucose tolerance (NFG/NGT) represented, in this study, approximately 30% of the entire population and is, therefore, not a rare subset 32. These
observations may not be surprising; in fact, although subjects with NFG and NGT have a lower relative risk for progression to diabetes than subjects with either IFG or IGT, in several studies 30–40% of all subjects who developed diabetes had NFG and NGT at baseline 33,34. This indicates that, although subjects with NFG and NGT have
a lower risk of developing diabetes compared with IFG and IGT in absolute terms, among these subjects there is also a subgroup at increased risk of developing diabetes and, consequently, cardiovascular diseases. From these considerations stems the need to add HbA1c,as a diagnostic tool to identify a new category of high-risk individuals 35. Further epidemiological data are needed to characterize the real percentage of this
group in the overall pre-diabetic population.
To date, it is unclear why the prevalence of pre-diabetes diagnosed by OGTT and HbA1c criteria is substantially discordant. The concentration of HbA1c depends
on glucose concentrations and on factors affecting the glycation rate such as systemic oxidative stress. Previous studies reported that some characteristics, such as obesity, are associated with increased oxidative stress 36; thus, HbA
1c may not reflect the real
concentration of glucose and be disproportionately high in obese subjects. Several studies investigated the effects of phenotypic characteristics such as obesity on the agreement between OGTT and HbA1c. Li et al. 37 in a recent study conducted on a
large cohort of Chinese subjects without a previous diagnosis of diabetes reported a poor agreement between HbA1c criteria and OGTT in patients independently from
were reported: 5.6% for normal weight, 5.7% for overweight, and 6% for obese subjects.
Also other studies recommend a different cut-off point of HbA1c for diagnosis
of pre-diabetes. In particular, longitudinal epidemiological studies have reported that demographic and ethnic factors may contribute to complications in using HbA1c for
the diagnosis of diabetes, and the optimal diagnostic HbA1c value is debated and
varies because of genetic and biological differences. Yan ST et al. 38 identified
optimal HbA1c cut-off points for pre-diabetes in two diverse population-based
cohorts with different ages. The optimal HbA1c cut-off point for pre-diabetes
diagnosis was 5.6% in the young and middle-aged population, whereas, the optimal cut-off for diagnosing pre-diabetes increased to 5.7%, in the elderly population. Furthermore, many studies have shown that racial disparities affect the performance of HbA1c for diagnosing pre-diabetes 39. In summary, it is possible that diagnostic
tests for glycemic homeostasis should be used and interpreted considering the individual phenotypic characteristics of the patients; further studies are needed to investigate the clinical usefulness of personalized cut-off values.
1.3 - Comparison of IFG, IGT and HbA1c, criteria in predicting cardiovascular
risk
The value of a predictive test for pre-diabetes and type 2 diabetes is also determined by its ability to identify the risk of micro- and macro-vascular complications and from this point of view, the high reproducibility and simplicity may make HbA1c
dosage an attractive option. Previous observational studies documented that determination of HbA1c, fasting glucose and OGTT significantly predicted the
development of retinopathy and nephropathy but no variables had a significant advantage for detecting the incidence or prevalence of either complication 40,41.
However, fasting glycaemia has a low predictive value in terms of cardiovascular disease, while 2-h post-load glycaemia and HbA1c have a higher predictive value for
this chronic complication of diabetes 42.
The question whether HbA1c is a better indicator of cardiovascular disease
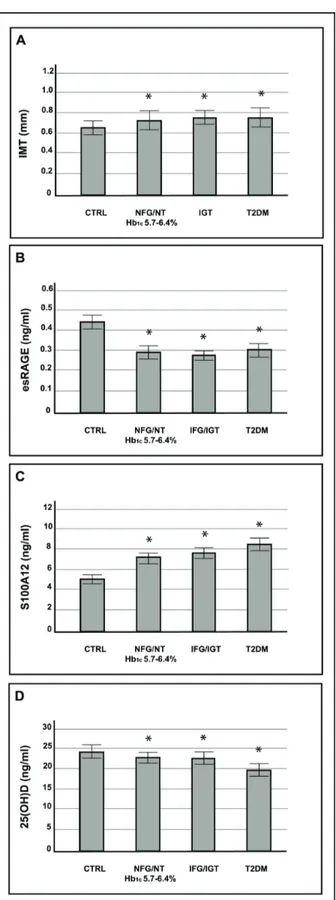
compared with the other glucose homeostasis parameters still remains debated. In a recent work, we showed that arterial stiffness and carotid intima-media thickness were altered in subjects with higher HbA1c levels and increased to a similar extent as
that observed in subjects with new onset type 2 diabetes 43. Furthermore, when we
analyzed our population including only subjects with NFG/NGT we found that the NFG/NGT subjects with HbA1c 5.7-6.4% showed an alteration of subclinical markers
of cardiovascular risk compared with NFG/NGT with lower HbA1c and there were no
significant differences compared with IGT and type 2 diabetic patients (Figure 2). According to these data, a reproducible and simple marker such as HbA1c seems to
similar data reporting a positive association between the pre-diabetic stage, echogenic plague and progression of coronary artery calcification 44,45. A recent
study has analysed the routine use of HbA1c for diagnosis of pre-diabetes in patients
with ST-segment elevation myocardial infarction. The study showed a similar in-hospital and long-term mortality in these patients with pre-diabetes as those with known diabetes. The authors discussed that the difficulty in performance and the presence of stress hyperglycaemia in an acutely ill patient with myocardial infarction make OGTT a rarely used diagnostic test in this setting. The use of a simple, one– time HbA1c test allowed them to identify a substantial proportion of patients with
previously undiagnosed diabetes or pre-diabetes who could be targeted for risk factor modification with lifestyle interventions and tailored medical therapy 46.
The links between alteration of glucose homeostasis and vascular damage in this population is still unclear, however, several studies have emphasized that the interaction of advanced glycation end products (AGE) with their cell-surface receptor (RAGE) is implicated in triggering inflammatory processes strictly connected with cardiovascular disease 47. A RAGE soluble form termed endogenous
secretory RAGE (esRAGE) may contribute to the removal of circulating ligands, thus competing with cell-surface RAGE for ligand binding 48. Low levels of esRAGE
have been associated with cardiovascular disease and, in a recent study, we found that subjects with pre-diabetes showed low esRAGE plasma levels suggesting a decreased scavenger capacity of these subjects (Figure 2). Further analysis conducted on mononuclear cells isolated from peripheral blood samples of these patients revealed a decreased esRAGE mRNA expression 32. The regulatory
molecular mechanism underlying esRAGE regulation will provide potential targets for the prevention and/or treatment of cardiovascular disease.
Our research team has further investigated the characterization of the population with HbA1c pre-diabetes (5.7-6.4%) also investigating other markers closely
associated with metabolic abnormalities and cardiovascular risk; in a previous study we highlighted a reduced insulin response in combination with impaired suppression of glucagon secretion in subjects with pre-diabetes according to HbA1c undergoing
isoglycaemic intravenous glucose infusion 49. Other data published in 2014 indicated
that the presence of pre-diabetes according to HbA1c is associated with hepatic
steatosis and with an alteration in the lipid profile known to be predisposing to cardiovascular and liver diseases 50. Moreover, we showed that the levels of 25
hydroxyvitamin D are reduced and associated with vascular damage in subjects with pre-diabetes by HbA1c with NFG/NGT (Figure 2) 51. Based on these data, we
suggest that among subjects with NFG and NGT, HbA1c may identify subjects with
different cardiovascular and glycometabolic risks.
These considerations are, furthermore, supported by previous studies. Indeed, it is important to remember that many authors have documented a significant increase in the incidence of cardiovascular events with HbA1c values substantially lower than
those used for diagnosis of diabetes 12. A recent meta-analysis of six prospective
cohort studies in subjects without diabetes mellitus showed a linear association of HbA1c levels with primary cardiovascular events. The observed effect estimates for
increased HbA1c levels and was strongly attenuated by adjustment for cardiovascular
Figure 2: Intima media thickness, esRAGE, S100A12 and 25(OH)D according to glucose tolerance
The majority of randomized controlled trials in non-diabetic subjects with increased HbA1c failed to observe significant effects when aiming to reduce the
cardiovascular risk and mortality of these individuals. In the recent IRIS trial, which involved patients without diabetes but with a recent history of ischemic stroke or transitory ischemic attack and who had insulin resistance, the rate of the primary outcome (fatal or non-fatal stroke or fatal or non-fatal myocardial infarction) was lower in the pioglitazone group compared with placebo 11. These results, although in
contrast, at least in part, with other trials conducted on patients with type 2 diabetes (BARI-2D and Pro-active), are of great interest suggesting a favourable effect of pioglitazone on the progression of subclinical atherosclerosis 53,54. The mechanism
that was responsible for the lower rates of stroke and myocardial infarction in the pioglitazone group remains unclear. A recent meta-analysis of prospective, randomized clinical trials has shown a non-significant trend towards reduced risk of fatal and non-fatal myocardial infarction, and fatal and non-fatal stroke were only reduced to borderline. However, the short average follow-up time of 3.75 years was a limitation of previous trials and further RCTs, with a larger sample size and longer follow-up, are required to explore the efficacy of non-drug and drug based approaches to reduce the cardiovascular risk of non-diabetic subjects with increased HbA1c55.
These findings are in agreement with other studies and suggest the importance of HbA1c as an early marker of cardiovascular risk, although the metabolic alterations
that lead to an increased cardiovascular risk are multiple and complex, and no single laboratory test can adequately identify or classify an individual’s cardiovascular risk
1.4 - Treatment of prediabetes
Several studies investigated the efficacy of different interventions (lifestyle or pharmacological) on end-points such as progression to type 2 diabetes and cardiovascular outcome in subjects with prediabetes. In Diabetes Prevention Program trial (DPP) lifestyle intervention decreased the incidence of new diabetes cases by 58% compared to placebo in patients with IGT in 3.2 years follow up. Follow-up of other three large lifestyle intervention studies for has shown similar reduction in the rate of conversion from prediabetes to type 2 diabetes: 43% reduction at 7 years in the Finnish Diabetes Prevention Study; 43% reduction at 20 years in the Da Qing study, and 34% reduction at 10 years in the U.S. Diabetes Prevention Program Outcomes Study 57–59. In post-hoc analysis of these studies, weight loss was the most
important contributor to diabetes prevention. Unfortunately, weigh loss achieved with diet and exercise is difficult to maintain in a long period; patients from DPP trial gained weight after the end of the trial 60.
Several pharmacologic agents have each been shown to decrease incident diabetes to various degrees in patients with prediabetes. Metformin has the strongest evidence base and demonstrated long-term safety as pharmacologic therapy for diabetes prevention and current guidelines recommend metformin therapy for prevention of type 2 diabetes should be considered in those with prediabetes, especially for those with BMI >35 kg/m2, those aged <60 years, women with prior gestational diabetes mellitus, and/or those with rising HbA1c despite lifestyle
intervention 61. Other drugs have been tested as therapy in patients with prediabetes;
in a recent studies Le Roux et al reported that Liraglutide, a GLP-1 receptor agonist, might provide health benefits in terms of reduced risk of diabetes in individuals with
prediabetes and obesity (-80% compared with placebo). Furthermore, a high rate of regression from prediabetes to normoglycemia was observed (-66%).
Thiazolidinediones (PPAR-Gamma activators) improve two of the main defects in prediabetes pathophysiology: insulin resistance and beta cell function, so they seem to be an attractive option in prediabetes treatment. In DPP IGT-type 2 diabetes progression was reduced by 23% with troglitazone within 2 years, even if the drug was stopped after ten months. After 1.5 years the incidence of diabetes for every 100 persons/year was reduced compared with placebo (3 vs 12 cases), metformin (3 vs 6.7 cases) and lifestyle intervention (3 vs 5.1 cases) 62. In Actos Now trials IGT
conversion to type 2 diabetes was reduced by 72% in pioglitazone group; similar results were reported in DREAM trial with a reduced conversion rate of 62% in patients in rosiglitazone therapy 63,64.
People with prediabetes often have other cardiovascular risk factors, including hypertension and dyslipidemia, and are at increased risk for cardiovascular disease. According with these considerations, increased vigilance is needed to identify and treat these and other cardiovascular risk factors. In the management of patients with prediabetes is needed to consider and treat aggressively the following cardiovascular risk factors:
Blood pressure <140/85;
LDL-cholesterol <100 mg/dL in patients with prediabetes and no history of cardiovascular disease;
• LDL-cholesterol <70 mg/dL patients with prediabetes and overt cardiovascular disease;
• Consider aspirin therapy as a primary prevention strategy in patients with high cardiovascular risk and use aspirin therapy as a secondary prevention strategy in those with a history of atherosclerotic cardiovascular disease; • Smoking cessation.
Despite the elevated CVD risk among people with prediabetes, it has been difficult to document CVD risk reduction as a result of diabetes prevention strategies. The Finnish Diabetes Prevention Study failed to show beneficial effects of lifestyle intervention on CVD outcomes even although a significant reduction in diabetes risk. In the 10-year follow-up of the Finnish Diabetes Prevention Study, total mortality and CVD incidence were not different between the intervention and control groups, but the study participants who had IGT at baseline had lower all-cause mortality and CVD incidence, compared with a Finnish population-based cohort of people with IGT, suggesting that regular follow-up of individuals at high risk may improve long-term outcomes 65. The Diabetes Prevention Program showed improvements in both
lipid levels and blood pressure in prediabetic individuals who regressed to normal glucose tolerance during the study period, and the largest improvements were seen in the intensive lifestyle intervention group 66
Several pharmacologic trials have shown beneficial effects on diabetes risk reduction in individuals with IGT. The ORIGIN study examined the effect of insulin glargine on CVD outcomes, but also showed no difference compared with placebo treatment in people with IFG and/or IGT 67. The NAVIGATOR trial did not find any effect of
renin-study, a significant 49 % reduction in major CVD events was found in participants with IGT who were randomized to the α- glucosidase inhibitor acarbose and followed for 3–4 years 69. In IRIS trial involving patients without diabetes who had a
recent history of ischemic stroke or transiet ischemic attack and who had insulin resistance, the rate of the primary outcome was lower among patients who received pioglitazone than among those who received placebo 11.
More studies are needed before a hypoglycemic agent should be recommended for primary prevention of CVD.
2 - SCIENTIFIC PROJECTS 2.1 Background
A number of studies reported that the process portending to atherosclerosis begin before of a formal diagnosis of diabetes and from this consideration the value of a predictive test for pre-diabetes and type 2 diabetes is also determined by its ability to identify individuals with subclinical alterations of early markers for cardiovascular risk. Previous observational studies documented that determination of HbA1c, fasting
glucose and OGTT significantly predicted the development of retinopathy and nephropathy but no variables had a significant advantage for detecting the incidence or prevalence of either complication. The high reproducibility and simplicity may make HbA1c dosage an attractive option, however, the question whether HbA1c is a
better indicator of cardiovascular disease compared with the other glucose homeostasis parameters still remains debated.
The aim of my scientific projects was to study the ability of HbA1c in identify
subjects with early alteration of cardiovascular risk that would not be identified with fasting glucose and oral glucose tolerance test. According with these considerations the scientific production was focused on the characterization of the cardiovascular risk profile of subjects with HbA1c in prediabetic range (5.7-6.4%) but with normal
glucose tolerance and normal fasting glucose without overt cardiovascular disease. We studied early markers of subclinical cardiovascular damage:
• Carotid IMT; • Arterial stiffness;
inflammation strictly bounded with cardiovascular risk such as: • Carboxy-methyl-lysine;
• Soluble Receptors for advanced glycation end-products; • S100A12;
• 25(OH)D.
Finally, according to current guidelines, there are no drugs with a specific indication for prevention of progression to type 2 diabetes and cardiovascular risk in subjects with prediabetes, and the first step in the management of this condition should emphasize therapeutic lifestyle modifications. According with these data we investigate the effect of a controlled dietary intervention that compared the chronic effects of a low dietary AGE (L-dAGEs) with a standard dietary AGE (S-dAGEs) regimen on lipid profile, inflammatory markers and plasma levels of esRAGE in individuals with prediabetes. Furthermore, we examined the effects of an L-dAGE regimen on early markers of cardiovascular disease.
2.2 Cardiovascular Risk Profile in Subjects With Prediabetes and New-Onset Type 2 Diabetes Identified by HbA1c According to American Diabetes
Association Criteria
In 2011, the American Diabetes Association (ADA) proposed that glycated hemoglobin A1c (HbA1c) should be used as a diagnostic test for diabetes and prediabetes. An HbA1c value ≥ 6.5% (48 mmol/mol) was recommended for the diagnosis of diabetes, and an HbA1c of 5.7-6.4% (39 to 46 mmol/mol) was identified as a new indicator of prediabetes in addition to impaired fasting glucose (IFG) and impaired glucose tolerance (IGT) 70. Evidence indicates that subjects who are at high
risk for type 2 diabetes also have an increased cardiovascular risk; therefore, the value of a predictive test for type 2 diabetes is also determined by its ability to indicate a high risk of cardiovascular disease (CVD) 71.
The ADA recommendations are mainly based on the relationship between HbA1c and microvascular complications, especially retinopathy 70,72. The association
of macrovascular diseases, which are the primary causes of mortality in patients with type 2 diabetes, with HbA1c compared with other glucose homeostasis parameters (fasting, one-hour and two-hour post oral glucose tolerance tests [OGTT]) is currently less conclusive 73.
Glycosylation of the arterial wall might play a role in vascular damage by affecting arterial stiffness, a progressive process that is accelerated by many age-associated disorders, including diabetes, hypertension and metabolic syndromes. In large arteries, aging is characterized by the decreased turnover of collagen and elastin and increased levels of advanced glycation end products (AGEs) and cross-links.
collagen and other matrix components 74. These events cause a loss of elasticity and
induce stiffening. Moreover, recent data have shown that the interaction between AGEs and their receptor (RAGE) plays an important role in the development of diabetes complications and accelerated atherosclerosis 75,76. RAGE is upregulated in
the atherosclerotic plaques of diabetic subjects, and interaction with its ligands induces pro-inflammatory gene activation and contributes to tissue injury and arterial stiffening 77.
Our first aim was to investigate the cardiovascular risk profile of subjects with prediabetes (HbA1c 5.7-6.4% [39 to 46 mmol/mol]) and new-onset type 2 diabetes (HbA1c ≥ 6.5 [48 mmol/mol]) according to HbA1c. We studied early markers of atherosclerosis, such as arterial stiffness (pulse wave analysis [PWA] and its central hemodynamic correlates, such as augmentation pressure [Aug], augmentation index [AugI] and pulse wave velocity [PWV]) and intima-media thickness (IMT). In addition, we characterized the association between serum soluble RAGE (sRAGE) and early markers of cardiovascular damage. Our second aim was to investigate whether HbA1c is a better indicator of cardiovascular risk compared with other glucose homeostasis parameters, such as fasting and one- or two-hour post-OGTTs.
Materials and methods
Study subjects
274 subjects with no previous diagnosis of diabetes were recruited from patients attending our University Hospital for diabetes and cardiovascular risk evaluation. The inclusion criteria were an age range of 18-65 years. All patients were Caucasian and underwent a physical examination and review of their clinical history, smoking status and alcohol consumption. None of them had lost weight or changed dietary habits during the three months preceding the study. The exclusion criteria were a previous history of diabetes, previous history of overt cardiovascular events (stroke, ischemic heart disease, chronic obstructive peripheral arteriopathy or heart failure), anemia or hemoglobinopathies, use of medications known to affect glucose metabolism, positivity for antibodies to hepatitis C virus (HCV) or hepatitis B surface antigen (HBsAg), clinical evidence of advanced liver or renal disease, chronic gastrointestinal diseases associated with malabsorption, rheumatic diseases and/or recent history of acute illness, malignant disease, drug or alcohol abuse.
Body weight and height were measured, and BMI was calculated as weight kg/[height (m)]2. Waist circumference was measured in a standing position at the
level of the umbilicus. Blood pressure (BP) was measured with a calibrated sphygmomanometer after the subject had rested in the supine position for 10 min. Venous blood samples were drawn from the antecubital vein on the morning after an overnight fast. Baseline venous blood samples were obtained for the measurement of plasma glucose, total cholesterol, HDL cholesterol, triglycerides, high sensitivity C-reactive protein (hs-CRP) and sRAGE. LDL cholesterol concentrations were estimated using the Friedewald formula. All subjects underwent a 75-g OGTT with
According to their two-hour glucose levels, the subjects were classified into the following categories: normal glucose tolerance (NT), IGT or type 2 diabetes. NT was defined as a hour plasma glucose level < 140 mg/dl. IGT was defined as a two-hour plasma glucose level of 140 to 200 mg/dl. Type 2 diabetes was defined as a two-hour plasma glucose level ≥ 200 mg/dl 70.
Biochemical analyses
Plasma glucose, serum total cholesterol, triglycerides, HDL cholesterol and hs-CRP were measured using available enzymatic methods as previously described 78. A
commercially available ELISA kit (Human sRAGE ELISA: Biovendor, Brno, Czech Republic) was used according to the manufacturer’s instructions to quantify the plasma concentration of sRAGE.
HbA1c was measured via high-performance liquid chromatography using a National Glycohemoglobin Standardization Program (NGSP) and standardized to the Diabetes Control and Complications Trial (DCCT)79 assay reference.
Chromatography was performed using a certified automated analyzer (HPLC; HLC-723G7 hemoglobin HPLC analyzer Tosoh Corp.) (normal range: 4.25-5.9% [23-41 mmol/mol]).
Pulse wave analysis
All measurements were made from the right radial artery by applanation tonometry using a Millar tonometer (SPC-301; Millar Instruments, Houston, TX)80. The
measurements were performed by a single investigator with the subject in the supine position. The data were collected directly with a desktop computer and processed
has two systolic pressure peaks, the latter of which is caused by wave reflection from the periphery. With arterial stiffening, both the pulse wave velocity and the amplitude of the reflected wave are increased such that the reflected wave arrives earlier and adds to (or augments) the central systolic pressure. The aortic waveform in pulse wave analysis was subjected to further analysis for the calculation of the aortic Aug, AugI (calculated by dividing augmentation by pulse pressure), central BP, ejection duration (duration of the systolic period in milliseconds) and Buckberg’s subendocardial viability ratio (SEVR, area of diastole divided by area of systole during one cardiac cycle in the aorta). Pulse pressure is the difference between the systolic and diastolic blood pressures.
Pulse wave velocity
The SphygmoCor CvMS (AtCor Medical, Sydney, Australia) system was used for the determination of the PWV. This system uses a tonometer and two different pressure waves obtained at the common carotid artery (proximal recording site) and at the femoral artery (distal recording site). The distance between the recording sites and suprasternal notch was measured using a tape measure. An electrocardiogram (ECG) was used to determine the start of the pulse wave. The PWV was determined as the difference in travel time of the pulse wave between the two different recording sites and the heart, divided by the travel distance of the pulse waveform. The PWV was calculated on the mean basis of ten consecutive pressure waveforms to cover a complete respiratory cycle.
Carotid ultrasound examinations
Ultrasound scans were performed using a high-resolution B-mode ultrasound system (MyLab 50 XVision, Esaote Biomedica SpA, Florence, Italy) equipped with a 7.5-MHz linear array transducer. To exclude interobserver variability, all ultrasound examinations were performed by a single physician who was blinded to the clinical and laboratory characteristics of the patients. The subjects were examined in the supine position. Longitudinal images from the angle with the best visibility were displayed bilaterally for the common carotid artery. Scans were performed, and measurements were conducted at a total of six plaque-free sites 1 cm proximal to the carotid bulb. The obtained values were averaged and are presented as the mean of the IMT of the common carotid artery. Plaques, defined as a clearly isolated focal thickening of the intima-media layer with a thickness of 1.4 mm, were not observed in any individuals. All measurements were obtained in diastole, assessed as the phase in which the lumen diameter is at its smallest and the IMT is at its largest.
The study was approved by the local ethics committee. Informed consent was obtained from each participant.
Statistical analyses
The sample size was calculated based on AugI using a level of significance (α) set to 5% and a power (1- β) set to 80%. Statistical comparisons of the clinical and biomedical parameters were performed using Stat View 6.0 for Windows. The data are presented as the means ± SD. The distributional characteristics of each variable, including normality, were assessed by the Kolmogorov-Smirnov test. The statistical analyses were performed with the unpaired t test and ANOVA for continuous
considered statistically significant. When necessary, numerical variables were logarithmically transformed for statistical analysis to reduce skewness (triglycerides, hsCRP, HOMA-IR, sRAGE, IMT), and values were expressed as median and interquartile range.
Simple regression analysis was performed to relate AugI and IMT to the following variables: HbA1c, fasting glucose, one-hour post-load glucose and two-hour post-load glucose. Subsequently, variables reaching statistical significance were inserted into a multivariate regression model to identify independent relationships between cardiovascular risk factors (age, sex, smoking status, systolic and diastolic BP, total cholesterol, HDL cholesterol, tryglicerides, hs-CRP, HOMA-IR and sRAGE) and variations in AugI and IMT. The variance inflation factor (VIF) was used to check for the problem of multicollinearity among the predictor variables in multiple regression analysis.
Results
In total, 274 subjects participated in the study. The study population was divided into the following three groups (based on HbA1c levels) according to the ADA recommendation 70: 97 controls (HbA1c < 5.7% [39 mmol/mol]), 117 patients with
prediabetes (HbA1c 5.7-6.4% [39 to 46 mmol/mol]) and 60 patients with type 2 diabetes (HbA1c ≥ 6.5% [48 mmol/mol]). Of the subjects who were prediabetic based on the HbA1c levels, 80 (68%) showed NT after the OGTT, and only 8 showed IFG. Therefore, many of these subjects should be classified as normal according to fasting glycemia and OGTT.
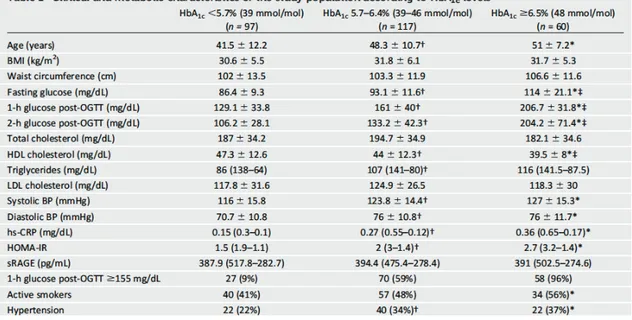
As shown in Table 1, BMI, waist circumference and total cholesterol were not significantly different among the three groups. Subjects with an HbA1c of 5.7-6.4% (39 to 46 mmol/mol) were older and had higher systolic BP, diastolic BP, fasting glucose, triglycerides, HOMA-IR and hs-CRP but lower HDL cholesterol than the controls. Moreover, these subjects had anthropometric and metabolic characteristics similar to patients with diabetes, except for the higher HDL cholesterol and lower fasting glycemia. No differences were observed in the sRAGE levels among the three groups.
Because a one-hour post-load glucose level ≥ 155 mg/dl has been reported as a key marker for cardiovascular and type 2 diabetes risks 81,82, we also stratified all subjects
according to their one-hour glucose plasma levels. We found that 82% of patients with a one-hour glucose ≥ 155 mg/dl presented HbA1c > 5.7%.
Table 1: Data are presented as mean±SD or as median (interquartile range) for continuous variables
and percentage for the categorical variables: HbA1c,glycated haemoglobin; BP, Blood pressure; Hs-CRP, high sensitivity C-reactive protein; HOMA-IR, homeostasis model assessment-insulin resistance, sRAGE soluble receptor for advanced glycation end-products. Smoking was quantified (number of cigarettes and years smoked) and smoking status was classified in active and nonsmokers Hypertension was defined as systolic blood pressure >135 mmHg or diastolic blood pressure >85 mmHg or taking any hypertension medications.
†P<0.05 HbA1c<5.7% vs HbA1c 5.7-6.4%; *P<0.05, HbA1c <5.7% vs HbA1c ≥6.5%; ‡P<0.05 HbA1c 5.7-6.4% vs HbA1c≥6.5%
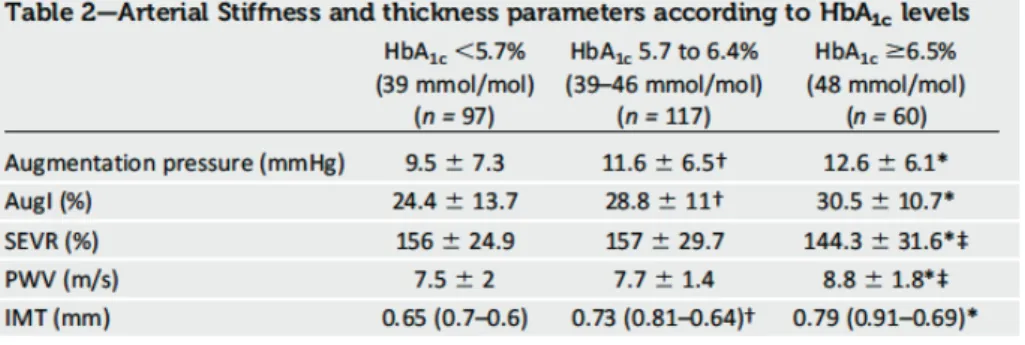
Arterial stiffness according to HbA1c levels
Aug and AugI were significantly higher in the prediabetic group (HbA1c 5.7-6.4% [39 to 46 mmol/mol]) than in the control group (HbA1c <5.7% [39 mmol/mol]) (11.6 ± 6.5 vs. 9.5 ± 7.3, P <0.05; 28.8 ± 11 vs. 24.4 ± 13.7, P<0.05; respectively). In contrast, SEVR and PWV were similar between these two groups. In individuals with type 2 diabetes, Aug and AugI were significantly increased compared with the control subjects. No difference was observed between the subjects with prediabetes and with type 2 diabetes (HbA1c ≥ 6.5% [48 mmol/mol]). Furthermore, in the subjects with diabetes, SEVR was impaired, and PWV was significantly increased compared with the normal and prediabetic individuals (Table 2).
Table 2: Data are presented as mean±SD:
†P<0.05 HbA1c<5.7% vs HbA1c 5.7-6.4%; *P<0.05, HbA1c <5.7% vs HbA1c ≥6.5%; ‡P<0.05 HbA1c 5.7-6.4% vs HbA1c≥6.5%
To minimize the impact of glucose tolerance alteration as a confounding factor, we examined the analysis.
As shown in Figure 1, AugI remained significantly higher in the NT group with HbA1c > 5.7 (39 mmol/mol) compared with the NT subjects with HbA1c < 5.7% (39 mmol/mol). We found no difference between the NT group with HbA1c > 5.7 (39 mmol/mol) and the subjects with IGT or type 2 diabetes.
Figure 1: Augmentation index (AugI) (mean±SD) (Panel A) and intima-media thickness (IMT)
(mean±SD) (Panel B) by normotolerant (NT) with glycated hemoglogin (HbA1c) <5.7% (n= 86), NT with HbA1c >5.7% (n= 80), impaired glucose tolerance (IGT) (n= 62) and type 2 diabetes (n= 46).
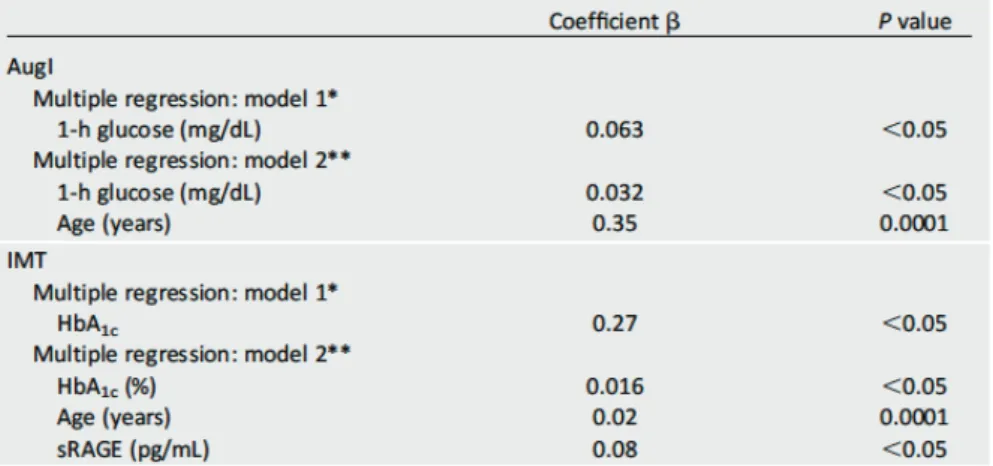
Both simple and multiple regression analyses were performed to evaluate the independent contributions of the glycemic parameters and other cardiovascular risk factors to AugI.
The simple regression analysis included HbA1c, fasting glucose, one-hour post-load glucose and two-hour post-load glucose. AugI was significantly correlated with HbA1c (r=0.15, P<0.05), one-hour post-load glucose (r=0.24, P<0.05) and two-hour post-load glucose (r=0.19, P<0.05). Then, we performed multiple regression analysis using two models. The first model included HbA1c and one- and two-hour post-load plasma glucose and showed a significant (P<0.05) correlation between AugI and one-hour post-load glucose. The second model included a variety of atherosclerosis risk factors (age, sex, smoking status, systolic and diastolic BP, total cholesterol, HDL cholesterol, triglycerides, hs-CRP, HOMA-IR and sRAGE) and showed that the only variables that remained significantly associated with AugI were, age (P<0.0001) and one-hour post-load glucose (P<0.05) (Table 3).
Table 3: *Model 1 was adjusted for HbA1c, fasting glucose, one-hour and two-hour glucose.
**Model 2 was adjusted for age, sex, smoking status, systolic BP diastolic BP, total cholesterol, HDL cholesterol, triglycerides, hs-CRP, HOMA-IR and sRAGE
Intima-media thickness according to HbA1c levels
The IMT was significantly higher (P<0.05) in patients with prediabetes and type 2 diabetes than in subjects with low HbA1c (Table 2). We found that the IMT was higher in the NT subjects with HbA1c 5.7-6.4% than in the NT subjects with HbA1c < 5.7% (39 mmol/mol) (0.73 ± 0.11 vs. 0.68 ± 0.13, P<0.05).
In the simple regression analysis, the IMT was associated with HbA1c (r=0.32, P<0.01), fasting glucose (r=0.29, P<0.01), one-hour post-load glucose (r=0.23, P<0.01) and two-hour post-load glucose (r=0.24, P<0.01). To estimate the independent contributions of the glycemic parameters (HbA1c, one-hour post-load glucose and two-hour post-load plasma glucose), we performed multivariate regression analysis with two models: the first model included the glycemic parameters (HbA1c and one- and two-hour post-load plasma glucose), and the second model included several CVD risk factors (age, sex, smoking status, systolic and diastolic BP, total cholesterol, HDL cholesterol, triglycerides, hs-CRP, HOMA-IR and sRAGE). The first model showed a significant correlation between IMT and HbA1c (P<0.05). In the second model, the only variables that remained significantly associated with IMT were HbA1c (P<0.05), age (P<0.0001) and sRAGE (P<0.05) (Table 3).
Discussion
In this study, we investigated the impact of ADA diagnostic criteria on the cardiovascular risk profile in a population without a previous history of diabetes 83–85.
We evaluated arterial stiffness and arterial thickness, known as early markers of atherosclerosis and predictive of cardiovascular events.
We found that arterial stiffness was altered in subjects with higher HbA1c levels. Both Aug and AugI were significantly increased in the subjects with prediabetes compared with the controls. Additionally, in type 2 diabetes subjects (HbA1c ≥ 6.5% [48 mmol/mol]), Aug and AugI were also increased to a similar extent as that observed in the individuals with prediabetes. Furthermore, the IMT was higher in both prediabetes and type 2 diabetes subjects compared with the controls.
When we divided our study population into NT patients and those with altered glucose tolerance (including subjects with IGT and diabetes), we noted several interesting and original observations. Our data showed that Aug and AugI were increased in the NT subjects with HbA1c 5.7-6.4% compared with their levels in the NT individuals with HbA1c <5.7%; however, these values were similar to those of the IGT and type 2 diabetes patients. Moreover, the NT subjects with HbA1c 5.7-6.4% showed higher IMT values compared with the NT subjects with low HbA1c, and there were no significant differences with respect to the IMT values of the IGT and type 2 diabetes patients. These results suggest that an HbA1c cut-off of 5.7% is more sensitive for the identification of subjects at high cardiovascular risk as many of these subjects (72 out of 117) were classified as NT after the OGTT with a normal fasting glucose level.
The relationship between hyperglycemia and cardiovascular risk in diabetic patients has been well established 73,86,87. The risk of CVD is increased before
glycemia reaches diabetic levels, as previously observed in IFG and IGT subjects and as recently demonstrated in NT individuals with a one-hour post-load glucose >155 mg/dl 88. However, which among the glucose homeostasis parameters (fasting
plasma glucose, one-hour post-load glucose, two-hour post-load glucose and/or HbA1c) could be a better predictor of CVD in prediabetic patients remains unclear. In the present study, HbA1c was initially associated with AugI in an unadjusted model. After adjustment for conventional risk factors, fasting and post-load glucose (including one- and two-hour plasma glucose), the association with HbA1c disappeared, and only one-hour post-load glucose remained significantly associated with AugI, suggesting that one-hour post-load glucose may be a better glycemic marker of vascular damage. This finding thus might highlight the importance of undergoing OGTT and obtaining intermediate values during glucose load, as previously indicated 89. However, we found that most subjects with a one-hour
glucose exceeding 155 mg/dl are included in the group with HbA1c in the 5.7-6.4 (39 to 46 mmol/mol) range, leading to the conclusion that HbA1c could be used to identify subjects at a higher cardiovascular risk. Furthermore, only HbA1c was associated with the IMT after a multiple regression analysis in two models, including glucose homeostasis parameters and multiple atherosclerosis risk factors. These findings are in agreement with previous studies 56 and suggest the importance of
HbA1c as an early marker of cardiovascular risk, although the metabolic alterations that lead to an increased cardiovascular risk are multiple and complex, and not a single laboratory test can adequately identify or classify an individual cardiovascular
We did not find any differences in the sRAGE levels among our three groups. However, sRAGE was significantly associated with the IMT in the simple and multiple regression analyses, suggesting the adverse effect of sRAGE on the CV profile.
Previous studies reported that higher sRAGE levels are associated with cardiovascular events and all-cause mortality in subjects with type 1 diabetes; however, the findings regarding the circulating total sRAGE levels in both type 1 and type 2 diabetes are controversial 47,90. sRAGE reflects the total pool of soluble RAGE
in the plasma. Splice variants, including endogenous secretory RAGE (esRAGE), appear to act as decoys, binding inflammatory RAGE ligands such as AGEs. In contrast, cleaved-type soluble RAGE, derived from the cell surface, appears to be modulated by the RAGE-ligand interaction, leading to increased receptor expression
91. In this work, we measured the total pool of plasma sRAGE; therefore, we could
not discern whether the variants of sRAGE might have different associations with the morphological and functional markers of cardiovascular disease.
Our findings are in good agreement with previously published data. In a longitudinal study in a population without diabetes at intermediate-to-high cardiovascular risk, glycated hemoglobin predicted all-cause and cardiovascular mortality independently of fasting glucose 92. Furthermore, Juan Liang et al. reported
that HbA1c was related to high PWV independently of conventional cardiovascular risk factors in a healthy Chinese population 93. In our study, we found a significant
and strong correlation between HbA1c and AugI, Aug and IMT; in contrast, no correlation was observed with the PWV. This discordance could be due, at least in part, to ethnic differences in the study population or differences in the sample size.
were differentially affected in subjects with diabetes 94. Thus, the discordance
between PWV and AugI is not surprising. Previous studies have also showed that wave reflection indices and aortic stiffness do not always change in parallel. AugI is primarily determined by the magnitude and timing of the reflected pressure waves, which depend on the tone and elasticity of the small muscular arteries at the major sites of pressure wave reflection; PWV is a measure of elastic-type large artery stiffness and is inversely related to aortic distensibility and compliance 95. Therefore,
AugI may be changed independently of PWV due to alterations in vascular smooth muscle tone that do not affect the elastic aorta. Increases in oxidative stress and reduced endothelial nitric oxide availability may impact the peripheral arteries more than the aorta.
In this study, SEVR, which is an estimate of myocardial perfusion, was not significantly different when we compared prediabetic subjects with controls. These findings are in agreement with those we reported in a recent study 80, in which SEVR
was affected by metabolic syndrome but not by altered glucose tolerance.
Our study has several limitations. Our results could be affected by age, although such an effect would not be surprising, considering that aging is strongly correlated with arterial stiffness 96. However, previous studies have indicated that the
deterioration of glucose tolerance is associated with increased arterial stiffness and that many of these changes occurred before the onset of type 2 diabetes 97. In
addition, the OGTT was performed once; thus, intra-individual variation in plasma glucose levels cannot be taken into account.
In conclusion, our data suggest that a simple, reproducible and less expensive marker such as HbA1c may be better able to identify prediabetic subjects at high
2.3 Low circulating vitamin D levels are associated with increased arterial stiffness in prediabetic subjects identified according to HbA1c
In 2011, the American Diabetes Association (ADA) recognized a new method to identify prediabetic subjects in addition to impaired fasting glucose (IFG) and impaired glucose tolerance (IGT): a glycated hemoglobin (HbA1c) value between
5.7–6.4% 70.
The clinical relevance of HbA1c and its agreement with fasting plasma glucose and
2-h glucose post-OGTT for the diagnosis of prediabetes remain controversial. In a recent study, we analyzed the cardiovascular risk profile in subjects with prediabetes identified according to HbA1c (5.7-6.4%), normal fasting glycemia and normal
glucose tolerance (NFG/NT) after an oral glucose tolerance test (OGTT). These subjects would not have been classified as prediabetic on the basis of fasting or post-OGTT values.
We found that these subjects with prediabetes identified by only HbA1c
presented with increased arterial stiffness and carotid intima-media thickness (IMT) in a similar manner to those with new onset type 2 diabetes 98
The pathogenic mechanism leading to vascular damage in this population is unknown. To further characterize the cardiovascular risk profile of these subjects, we decided to study their vitamin D levels.
Growing evidence indicates that suboptimal vitamin D levels play a role in the development of various clinical conditions, including cardiovascular disease 99– 101. A regulatory role for vitamin D in the cardiovascular system has been clearly
demonstrated in animal studies examining activation of the systemic and local cardiac renin-angiotensin system. A study in knockout mice confirmed that the
angiotensin system, with the development of hypertension and left ventricular hypertrophy102,103.
A strong association of vitamin D deficiency with increased all-cause and cardiovascular mortality has been described in the general population 9. Moreover,
suboptimal vitamin D status appears to be involved in impaired glucose homeostasis, insulin resistance and obesity, and this condition may predispose people to type 2 diabetes. Clinical cross-sectional studies have shown a significant inverse relationship between HbA1c and serum 25(OH)D levels in diabetic subjects 104,
furthermore, other studies have observed low serum 25(OH)D levels in individuals with prediabetes identified according to ADA recommendations (IFG, IGT and HbA1c 5.7-6.4%) 70. However, recent literature has indicated that the association
between 25(OH)D with cardiovascular and metabolic disease could be weaker in special populations 105,106. Then, the exact role of vitamin D in these diseases needs
to be clarified in randomized clinical trials.
The purpose of this study was to evaluate the levels of vitamin D in patients with prediabetes, particularly in those identified by HbA1c with NFG and NT after
OGTT, and whether these values are associated with alterations of arterial stiffness and IMT, early markers of atherosclerosis.
Materials and methods
Study subjects
Subjects (n=286, age range of 18–65 years) with no previous diagnosis of diabetes were consecutively recruited from patients attending our University Hospital for diabetes and cardiovascular risk evaluation during the winter months (November-March). The exclusion criteria were the following: a previous history of diabetes; previous history of overt cardiovascular events (atrial fibrillation, stroke, ischemic heart disease, chronic obstructive peripheral arteriopathy, or heart failure); primary hyperparathyroidism; clinical evidence of advanced liver or renal disease; anemia or hemoglobinopathies; use of medications known to affect glucose metabolism; positivity for antibodies to hepatitis C virus or hepatitis B surface antigen; chronic gastrointestinal diseases associated with malabsorption or chronic pancreatitis; rheumatic diseases; and/or recent history of acute illness, malignant disease, and drug or alcohol abuse. All patients were Caucasian and underwent a physical examination and review of their clinical history and alcohol consumption. Smoking status was assessed in all the patients. During the visit we ask the number of cigarettes and years smoked in order to obtain a categorical variable (active smokers or nonsmokers). Those who reported smoking cigarettes regularly during the year before the exam were considered active smokers. None were taking calcium or vitamin D supplements.
Body weight and height were measured, and BMI was calculated as weight (kg)/[height (m)]2. Waist circumference was measured in a standing position at the
level of the umbilicus. Blood pressure (BP) was measured with a calibrated sphygmomanometer after the subject had rested in the supine position for 10 min.
overnight fast. All subjects underwent a 75-g OGTT with 0-, 30-, 60-, 90- and 120-min sampling for plasma and insulin as previously described 107. Glucose tolerance
status was definited on the basis of OGTT according to ADA recommendations 70.
The study was approved by the local ethics committee. Informed consent was obtained from each participant.
Biochemical Analyses
Plasma glucose, serum total cholesterol, triglycerides, HDL cholesterol, and hs-CRP were measured using available enzymatic methods as previously described 78 LDL
cholesterol concentrations were estimated using the Friedewald formula. Serum calcium and phosphorus levels were measured in all subjects.
Serum 25(OH)D was measured using a chemiluminescent microparticle immunoassay; the interassay and intra-assay coefficient of variation were ≤10% (ARCHITECT; ABBOTT, Wiesbaden, Germany). PTH was measured using a chemiluminescent assay (PTH LIAISON N-TACT; DiaSorin, Saluggia [VC]). Estimated glomerular filtration rate (e-GFR) was calculated with the Cockcroft-Gault formula.
HbA1c was measured via high-performance liquid chromatography using a
National Glycohemoglobin Standardization Program and standardized to the Diabetes Control and Complications Trial (DCCT) assay reference79
Chromatography was performed using a certified automated analyzer (HPLC; HLC-723G7 hemoglobin HPLC analyzer; Tosoh Corp.) (normal range 4.25–5.9% [23–41 mmol/mol]; intra- and inter-assay CVs were 1.7% and 2.6%, respectively).
Pulse Wave Analysis
Evaluation of arterial stiffness was performed with the patients in fasting status and explicity expressed the recommendation to avoid coffee intake in the morning of the procedure. All measurements were made from the right radial artery by applanation tonometry using a Millar tonometer (SPC-301; Millar Instruments, Houston, TX)80.
The measurements were performed by a single investigator with the subject in the supine position. The data were collected directly with a desktop computer and processed with SphygmoCorCvMS (AtCor Medical, Sydney, Australia). The aortic waveform in pulse wave analysis was subjected to analysis for the calculation of the aortic Aug and AugI (calculated by dividing augmentation by pulse pressure). Pulse pressure was calculated as the difference between the systolic and diastolic BPs.
Carotid Ultrasound Examinations
Ultrasound scans were performed using a high-resolution B-mode ultrasound system (MyLab 50 XVision; Esaote Biomedica SpA, Florence, Italy) equipped with a 7.5-MHz linear array transducer. All ultrasound examinations were performed by a single physician who was blinded to the clinical and laboratory characteristics of the patients. Scans were performed and measurements were conducted at a total of six plaque-free sites 1 cm proximal to the carotid bulb. The obtained values were averaged and are presented as the means of the IMT of the common carotid artery. All measurements were obtained in diastole, assessed as the phase in which the lumen diameter is at its smallest and the IMT is at its largest.
Statistical Analyses
We based the power calculation on previous studies examining vitamin D differences among patients with cardioscular risk factors and control subjects; the level of significance (α) was set to 5%, and power (1-β) was set to 80%108. The estimated
sample size was 284 patients. Statistical comparisons of the clinical and biomedical parameters were performed using Stat View 6.0 for Windows. The data are presented as the means ± SD. The distributional characteristics of each variable, including normality, were assessed by the Kolmogorov-Smirnov test. Independent t-test was performed to compare the differences in 25(OH)D levels between men and women. ANOVA for clinical and biological data was performed to test the differences among groups. When ANOVA P-value was <0.05 the Bonferroni post hoc test for multiple comparisons was further performed. The χ2 test was used for categorical variables.
A P value less than 0.05 was considered statistically significant. If necessary, numerical variables were logarithmically transformed for statistical analysis to reduce skewness [25(OH)D, triglycerides, hs-CRP, homeostasis model assessment of insulin resistance (HOMA-IR) and IMT], and values were expressed as the medians and interquartile ranges.
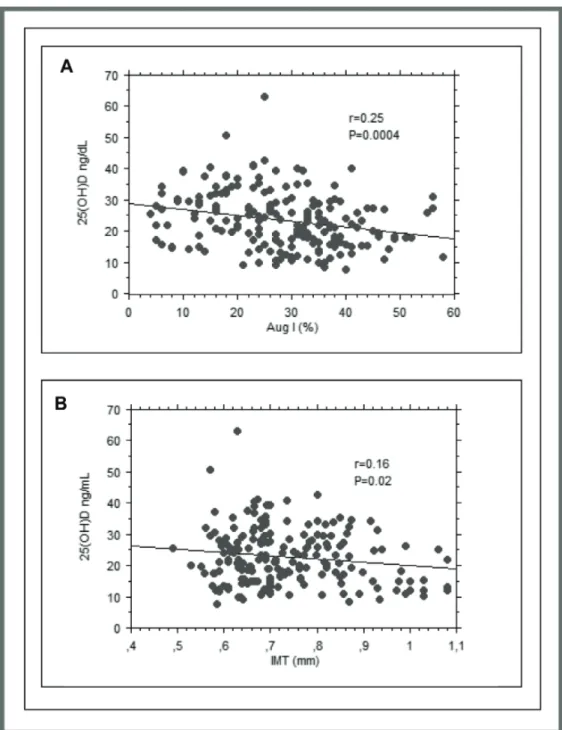
Simple regression analyses were performed to identify the association between 25(OH)D, AugI, the IMT and the following variables: age, BMI, waist circumference (WC), sex, smoking status, systolic and diastolic BP, total cholesterol, HDL cholesterol, triglycerides, hs-CRP, HbA1c, fasting glycemia, PTH and
HOMA-IR. Then, we performed a multiple regression analysis including the variables reaching a P value <0.10 in simple regression analysis.
used a maximum VIF value of 4 that is recommended in the literature for exclusion of a covariate 18. Any variable with a VIF that exceeded 4 was excluded from the
Results
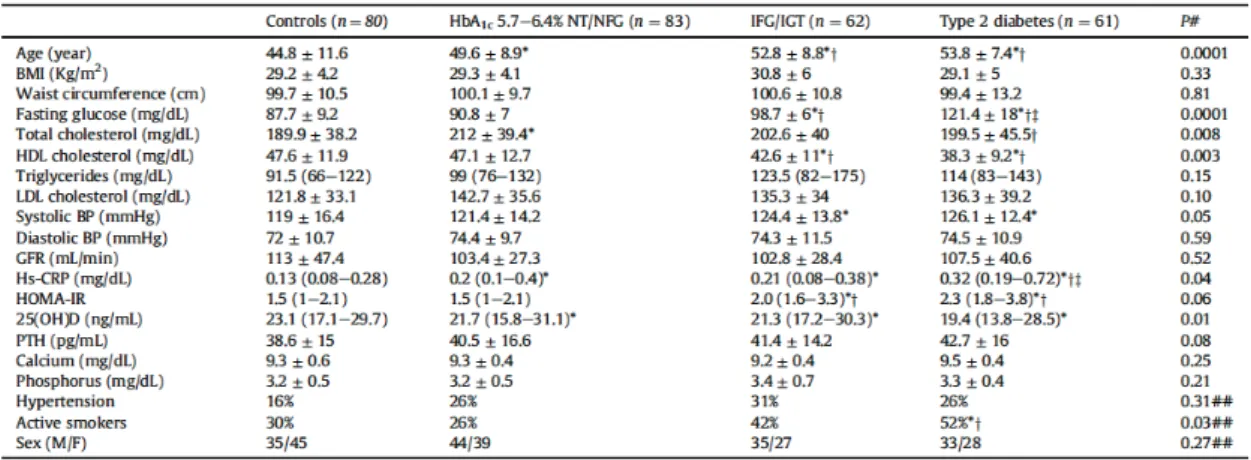
In total, 286 subjects participated in the study. The study population was divided into the following four groups based on fasting glucose, OGTT and HbA1c levels,
according to the ADA recommendations: 80 control subjects (NFG and NT with HbA1c <5.7%), 83 patients with NFG/NT and HbA1c 5.7–6.4%, 62 patients with
IFG/IGT and 61 patients with new onset type 2 diabetes (HbA1c ≥6.5%).
The baseline characteristics of the study subjects are presented in Table 1.
Table 1: The data are presented as the mean±SD or median(IQR). Continuous and categorical
variables were compared by ANOVA and χ2 test respectively. Bonferroni post hoc test was further
performed.
NT/NFG, normotolerant and normal fasting glucose; IFG/IGT, impaired fasting glucose and impaired glucose tolerance; HbA1c, glycated hemoglobin; BP, blood pressure; GFR, glomerular filtration rate;
Hs-CRP, high sensitivity C-reactive protein; HOMA-IR, homeostasis model assessment-insulin resistance; 25(OH)D 25-hydroxyvitamin D; PTH, parathyroid hormone.
Smoking was quantified (number of cigarettes and years smoked), and smoking status was classified in active and nonsmokers.
Hypertension was defined as systolic blood pressure ≥135 mmHg, diastolic blood pressure ≥85 mmHg or taking any hypertension medications.
# By ANOVA; ## By χ2;*P<0.05 vs controls; †P<0.05 vs ≥5.7% NT/NFG; ‡P<0.05 vs IFG/IGT
Compared with controls, individuals with NFG/NT and HbA1c 5.7–6.4% were
more likely to be older (44±11.6 vs 49±8.9 years, P=0.005), to present higher levels of total cholesterol (189.9±38.2 vs 212±39.9 mg/dL, P=0.001) and to have higher hs-CRP serum levels (0.13 [0.08-028] vs 0.2 [0.1-0.4] mg/dL, P=0.048). These subjects
and new onset type 2 diabetes, except for lower fasting glucose and HOMA-IR and higher HDL cholesterol. Plasma levels of calcium and phosphorus were similar among the four groups (Table 1).
25(OH)D according to HbA1c levels
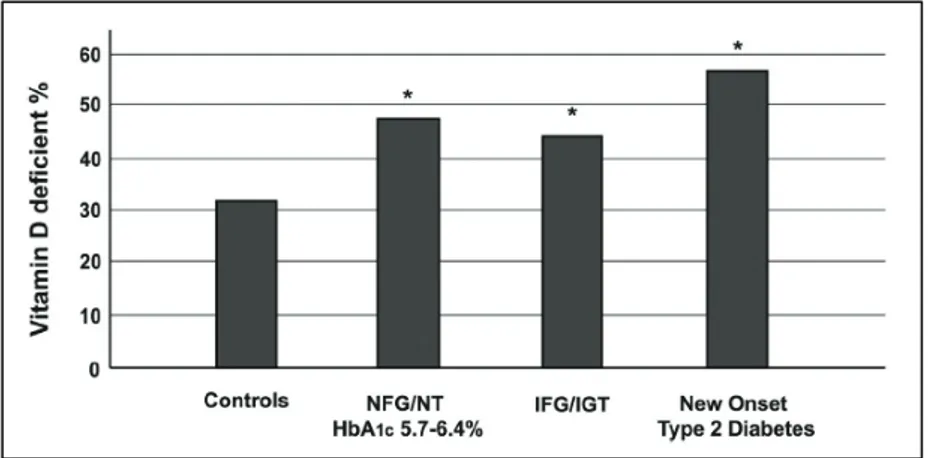
Our data demonstrate lower levels of 25(OH)D in diabetic patients compared to controls (Table 1). Accordingly, we found higher PTH levels in the diabetic patients compared to the controls, but PTH levels were not significantly different among the four groups. Although there is no consensus on optimal serum levels of 25(OH)D, vitamin D deficiency is defined by most experts as a 25(OH)D level of less than 20 ng per milliliter 19. In the control group, the prevalence of 25(OH)D deficiency (≤20
ng/mL) was 32%; in the IFG/IGT group, the prevalence of 25(OH)D deficiency was 44%; similarly, subjects with NFG/NT and prediabetes according to the new ADA criterion (HbA1c 5.7–6.4%), showed a prevalence of 25(OH)D deficiency of 47%. In
the new onset type 2 diabetic group, the prevalence of 25(OH)D deficiency 57% (Figure 1).
Figura 3: Vitamin D deficiency according to HbA1c and glucose tolerance. Variables were compared
by χ2 test. NGT/NT: normal fasting glycemia and normotolerant; IFG/IGT: impaired fasting glucose