PAPER • OPEN ACCESS
Extreme Energy Events: an extended multi purpose cosmic ray
observatory
To cite this article: I. Gnesi et al 2020 J. Phys.: Conf. Ser. 1468 012103
View the article online for updates and enhancements.
Extreme Energy Events: an extended multi purpose
cosmic ray observatory
I. Gnesi1,7,22, M. Abbrescia1,2, C.Avanzini1,3, L. Baldini1,3, R. Baldini Ferroli1,4, L. G. Batignani1,3, M. Battaglieri1,17, S. Boi1,8, E. Bossini1,5, F. Carnesecchi1,6, C. Cicalo1,8, L. Cifarelli1,6, F. Coccetti1, E.
Coccia1,9, A. Corvaglia1,10 , D. De Gruttola1,11, S. De Pasquale1,11, L. Fabbri1,4, L. Galante1,7, P. Galeotti1,7, M. Garbini1,6, G. Gemme1,17, S. Grazzi1, D. Hatzifotiadou1,6,15, P. La Rocca1,18, Z.Liu1,14,15, G. Mandaglio1,19, G. Maron13, M. N. Mazziotta1,20, A.Mulliri1,8, R. Nania1,6, F. Noferini1,6, F. Nozzoli1,21, F. Palmonari1,6 , M. Panareo1,10, M. P. Panetta1,10, R. Paoletti1,5, C. Pellegrino1,6, L. Perasso1,17, C.Pinto1,18, G. Piragino1,7, S. Pisano1, F. Riggi1,18, G. C. Righini1, C. Ripoli1,11, M.Rizzi1,2, G. Sartorelli1,6, E. Scapparone1,6, M. Schioppa1,22, A. Scribano1,3, M. Selvi1,6, G.Serri1,8, S. Squarcia1,17, M. Taiuti1,17, G.Terreni1,3, A. Trifir1,23, M. Trimarchi1,23, M. C.
Vistoli13, L. Votano1,12, M. C. S. Williams1,6,15, A. Zichichi1,6,15, R. Zuyeuski1,15
1 Museo Storico della Fisica e Centro Studi e Ricerche Enrico Fermi, Roma, Italy 2 INFN and Dipartimento Interateneo di Fisica, Universit`a di Bari, Bari, Italy 3 INFN and Dipartimento di Fisica, Universit`a di Pisa, Pisa, Italy
4 INFN, Laboratori Nazionali di Frascati, Frascati (RM), Italy
5 INFN Gruppo Collegato di Siena and Dipartimento di Fisica, Universit`a di Siena, Siena, Italy
6 INFN and Dipartimento di Fisica e Astronomia, Universit`a di Bologna, Bologna, Italy 7 INFN and Dipartimento di Fisica, Universit`a di Torino, Torino, Italy
8 INFN and Dipartimento di Fisica, Universit`a di Cagliari, Cagliari, Italy
9 INFN and Dipartimento di Fisica, Universit`a di Roma Tor Vergata, Roma, Italy 10 INFN and Dipartimento di Matematica e Fisica, Universit`a del Salento, Lecce, Italy 11 INFN and Dipartimento di Fisica, Universit`a di Salerno, Salerno, Italy
12 INFN, Laboratori Nazionali del Gran Sasso, Assergi (AQ), Italy 13 INFN CNAF, Bologna, Italy
14 ICSC World Laboratory, Geneva, Switzerland 15 CERN, Geneva, Switzerland
16 JINR Joint Institute for Nuclear Research, Dubna, Russia
17 INFN and Dipartimento di Fisica, Universit`a di Genova, Genova, Italy
18 INFN and Dipartimento di Fisica e Astronomia E.Majorana, Universit`a di Catania, Catania, Italy
19 INFN Sezione di Catania and Dipartimento di Scienze Chimiche, Biologiche, Farmaceutiche e Ambientali, Universit`a di Messina, Messina, Italy
20 INFN Sezione di Bari, Bari, Italy
2
E-mail: [email protected], [email protected]
Abstract. EEE is an extended cosmic ray observatory, covering more than 10 degrees in latitude and longitude. The relative distances between clusters of telescopes reached the 1200 km, allowing the search for rare long distance correlations between cosmic showers. On the other side each EEE telescope is capable of measuring the flux of secondary particles, opening to the study of low energy phenomena such as solar activity and Forbush decreases. An introduction to the observaotry and updates on the main scientific results are presented. Last updates on the searches for rare correlated showers, with a set of long distance correlation candidate events are also reported.
1. Introduction
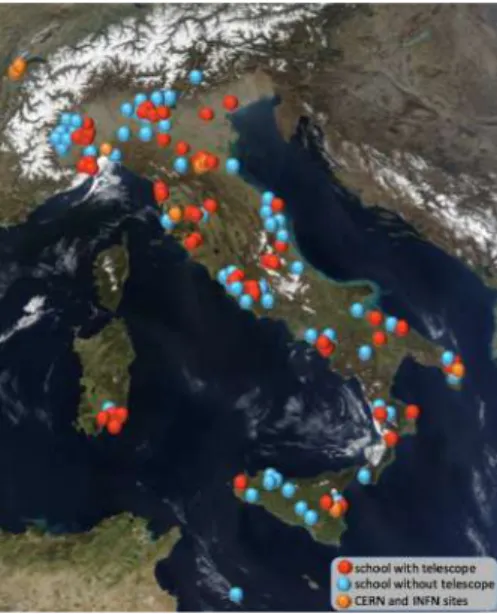
The Extreme Energy Events (EEE) Project [1, 2] is aimed to the study of Cosmic Rays (CR) and Cosmic Rays-related phenomena, via a synchronous sparse array of 56 tracing detectors, deployed over a broad area covering more than 10 degrees in latitude and 11 in longitude. In figure 1 the present position of the EEE stations is shown. 50 stations out of 56 are installed inside High School buildings, where teachers and students contribute to the experiment activities while also addressing Modern Physics by participating to a real CR observatory [3].
The EEE array is composed by both clusters and stand-alone stations, each made of three Multigap Resistive Plate Chambers (MRPC), a CR dedicated version of the module used as the Time Of Flight (TOF) detector at the ALICE experiment[4, 5]. The result is a sparse array where each detection site is made of few detectors at 30 m - 2 km distance from the others. Currently the largest distance between the EEE telescopes is about 1200 km (between CERN laboratories and Catania). Data collected by the single stations are sent to the CNAF center, the biggest computing facility of the Italian National Institute of Nuclear Physics (INFN), where they are stored, reconstructed and made available for being analysed. At present the experiment has closed the ”RUN 5”, in June 2019; the whole data set collected since fall 2014 has already exceeded 100 billions of muon tracks.
Figure 1. Distribution of the 56
EEE stations. Red points:
sta-tions installed inside High School buildings. Orange point: stations installed in research laboratories (CERN and INFN sections). Blue points: High Schools in waiting list for a station.
2. The EEE technology and data treatment
The EEE stations and their performances have been already described in [6, 7]. Here, we give a brief description of both chambers technology, data transmission, validation and reconstruction. 2.1. The telescopes
Each EEE telescope is made of three Multigap Resistive Plate Chambers (MRPCs), mounted on a frame at a typical distance of 0.5 m. An MRPCs consists of six gas gaps, as shown in figure 2. The structure consists of two thicker glass plates (1.9 mm thick), coated with resistive paint, and five thinner glass plates (1.1 mm thick), spaced by 300 µm by means of commercial nylon fishing line; the typical glass resistivity is⇠ 1013⌦cm. The MRPC readout is obtained through 24 copper readout strips, 2.5 cm-wide and 3.2 cm pitch, on the top and bottom fiberglass panels. The active area is finally 0.82 ⇥ 1.58 m2. Each chamber is flushed with 98% C
2H2F4 plus 2% SF6gas mixture. The chambers are operated in avalanche mode with a typical operating voltage around 18 kV supplied by DC/DC converters. The measured MRPC efficiency is typically 95%. The signal induced on the copper strips is processed by a fast discriminator-amplifier Front-End card (FEA) at the two ends of the chamber. Particle hits coordinates are determined by the strips and by the left to right time di↵erence measured by the FEA, respectively. The time is measured by two multi-hit TDCs (CAEN Mod. V1190A/B), operated at 100 ps bin width, providing an overall spatial resolution of about 1 cm along the two coordinates. The absolute time of each event is recorded and synchronized by means of Global Positioning System (GPS) modules. A picture of a EEE telescope is shown in figure 3.
Figure 2. The internal structures of a MRPC plane (see description in the text)
Figure 3. The TORI-04
tele-scopes. The three MRPC planes
are shown. The VME crate on the right houses the TDC modules, the trigger card and the USB bridge card for the communication to the DAQ PC.
2.2. Reconstruction and Data validation
The data-processing infrastructure for the EEE experiment is provided by CNAF (Centro Nazionale Analisi Fotogrammi), the central computer facility of the Italian National Institute for Nuclear Physics (INFN). Each run of 50,000 events is automatically transferred to CNAF and processed. The Reconstruction and the Data Quality Monitor (DQM) pipelines run in parallel,
4 3. Results overview
The EEE main fields of investigation extend over a broad energy range and topics. From the study of local muon flux dependance on solar activity to the investigation of the upward-going component of muon looking for rare signals; from the search for anisotropies at various scales to the observation of EAS. Finally, thanks to the broad and non-uniform distribution of EEE telescope clusters, the search for possible long distance EAS correlations (LDC) can be addressed. 3.1. Galactic Cosmic Ray flux Decreases (Forbush e↵ect)
The monitoring of Galactic Cosmic Ray flux Decreases (GCRD) is of interest for understanding phenomena occurring on the solar heliosphere, as well as on other observable stars. As it is known, they are related to the emission of mass from star corona and often to solar flares, even if such relation is not completely understood, especially the interplay with interplanetary structures [9, 10].
The long term survey of cosmic ray flux fluctuations has been historically performed by neutron monitors (NM), showing usually higher angular acceptance and lower energy threshold than EEE muon tracking detectors. On the other side the overall acceptance of each EEE station, the timing resolution better than 30 ns and the tracking capabilities allow for the study of the muon component of the GCRDs, opening to comparison with NM and to a deeper understanding of such phenomena.
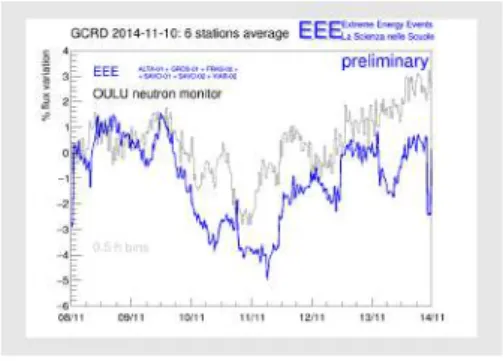
Four variations have been already observed by the EEE telescopes in 2011, 2012, 2014 and 2015, by correcting the absolute flux for the known sources of systematic uncertainties, mainly due to pressure fluctuations above the telescopes. The results show that the EEE array has the capability of becoming a stable survey for GCRDs over a broad latitude and longitude range. In Figure 4 a GCRD occurred in November 2014 and observed by 6 EEE stations is shown in comparison with the OULU NM.
Figure 4. Blue: GCRD observed by 6 EEE telescopes. Black: OULU Neutron Monitor data.
4. Search for long distance correlated EAS
Several physical mechanisms that are able to produce LDC events have been proposed [9, 13, 14, 15, 16]. Among them, one of the most reliable theory was proposed by Gerasimova and Zatsepin [12], involving a high energy cosmic nucleus fragmenting by interacting with a photon coming from a nearby star. The opposite electrical charges of the two remnants provides the interplanetary magnetic field are drifted apart. If both remnants reach the earth’ s atmosphere, they will start two separate air showers, with short time and spatial separation. This mechanism, even if widely accepted in the scientific community, has not yet been experimentally confirmed. Since the current rate expectations range from 103 to 1 event per km2 per year, large exposure sparse arrays are required. Some experimental hints about the observation of large-scale coincidences between extensive air showers have been observed in recent years by LAAS [17] and CZELTA-ALTA [18] Collaborations. The Extreme Energy Events (EEE) experiment,
thanks to its sparse and extended topology, can give a contribution on the search for long-distance correlations.
Two main approaches were used to investigate the phenomenon.
The first consists in limiting the analysis on the correlation between EAS detected by local clusters of telescopes. The observed frequency of detection of extensive air showers is between 0.001 and 0.04 Hz, depending on the relative distance (ranging from 15 m to few kilometers). The spurious coincidence rate within a 1 ms time window is about a few events per year. At present 10 EEE local clusters are able to detect EAS, resulting in 45 possible cluster pairs combinations. The distances between these sites range between 86 km and 1200 km. A dataset corresponding to a period of 3968 days time exposure was analyzed. 5 candidate events with low p-value were observed. The complete analysis results can be found in [19, 20].
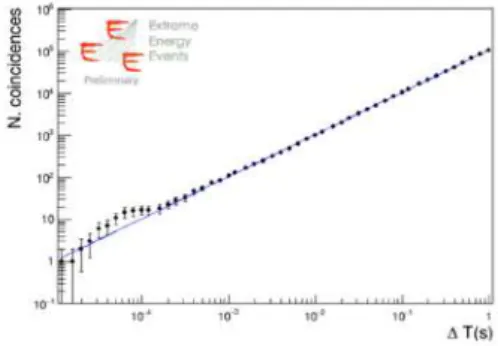
The second alternative approach is based on the search of coincidences among multitrack events in distant EEE telescopes. Multitrack events can be produced by particles belonging to the same shower or by particles originated from nuclear interactions in the building surrounding the detector. The experimental multitrack count rate is about 0.01 Hz, suppressing the amount of spurious coincidence events between far detectors, down to few events per year in a time window of 1 ms. Figure 5 shows the event multiplicity distribution reconstructed by the 39 EEE telescopes involved in the analysis. The number of events with a large number of tracks per event is not negligible and could be partially due to chamber noise. Once the multi-track events were selected in each telescope, all possible pair combinations between the 39 telescopes were considered (741 in total). The largest light distance among the telescopes is 4 ms. An excess starts to be visible for T<0.2 ms. In principle, this result can be improved applying corrections on the arrival time di↵erence of the two showers, which depends on the arrival direction with respect to the vertical. The most significant excess was observed selecting events with ntracks>4, the result is shown in Figure 6. The most significant p-value, 4·10 3, was obtained for a time window of 60µs: 11 events were observed against 5 spurious expected.
Figure 5. Overall distribution of track multiplicity. (Sum over all
the EEE telescopes. High tracks
multiplicity can also be due to telescope noise.)
Figure 6. Number of coincidence as a function of the time window for track multiplicity higher than 4. An excess is visible for 10 4 s windows.
5. Conclusions
The EEE observatory is an extended observatory for studying low and high enrgy cosmic ray related phenomena. Among the several topics addressed, its main focus is the study of
6
results is strongly supporting the search of LDC by increasing the exposure and applying more sophisticated analysis techniques.
References
[1] Centro Studi e Ricerche “E. Fermi” web site: http://www.centrofermi.it/eee. [2] M. Abbrescia et al., Nucl. Instrum. Meth. A 588 (2008) 211.
[3] A. Zichichi, Progetto “La Scienza nelle Scuole” - EEE: Extreme Energy Events (Societ`a Italiana di Fisica, Bologna, 2004) 2nd edition (2005), 3rd edition (2012).
[4] ALICE Collaboration, Addendum to TOF Technical Design Report, CERN/LHCC, 2002-016. [5] A. Akindinov et al., Nucl. Instrum. Methods Phys. Res. A 661, S98 (2012).
[6] M. Abbrescia, et al., (EEE collaboration), Nuclear Instruments and Methods in Physics Research Section A 593 (2008) 263.
[7] M. Abbrescia, et al., (EEE collaboration), Nuclear Instruments and Methods in Physics Research Section A 588 (2008).
[8] F. Anghinolfi et al., Nucl. Instrum. Meth. A 533 (2004) 183. [9] Badruddin, Nuovo Cimento C 23, 217 (2000).
[10] J. A. Lockwood and W. R. Webber, J.Geophys.Res.Space Phys. 89, A1 (1984) 17. [11] A.H. Compton, I.A. Getting, Phys. Rev. 47, 817 (1935)
[12] N.M.Gerasimova and G.T.Zatsepin, Sov. Phys. JETP 11(1960)899. [13] . Medina-Tanco, A. Watson, Astropart. Phys. 10 (1999) 157. [14] S. Stecker et al., Astrophys. J. 512(1999) 521.
[15] P. L. Rocca, F. Riggi, Report INFN/AE-08/01,https://doi.org/10.15161/oar.it/1448969588.25 (2008). [16] K. Andersen, S. Klein, Phys. Rev. D 83 (2011) 103519
[17] A. Iyono, et al., Astro-phys. Space Sci. Trans. 7 (2011) 327. [18] P. Blaschke, et al., Astrophys. Space Sci. Trans. 7(2011) 69. [19] M. Abbrescia, et al., Eur.Phys. J. Plus 133 (2018) 34. [20] F. Riggi, et al., Il Nuovo Cimento C 40 (2017) 196.