Aftershocks’ Effect on Structural Design Actions in Italy
1Iunio Iervolino,1 Eugenio Chioccarelli,2 and Massimiliano Giorgio.3 2
1Dipartimento di Strutture per l’Ingegneria e l’Architettura, Università degli Studi di Napoli Federico II, via
3
Claudio 21, 80125, Naples, Italy. [email protected] 4
2Università Telematica Pegaso, piazza Trieste e Trento 48, 80132 Naples, Italy.
5
3Dipartimento di Ingegneria Industriale e dell’Informazione, Università degli Studi della Campania Luigi
7
Vanvitelli, via Roma 29, 80131, Aversa (CE), Italy. [email protected] 8
Abstract
9
Although earthquakes generally form clusters both in space and time, only mainshocks, usually the 10
largest magnitude events within a cluster, are considered by probabilistic seismic hazard analysis 11
(PSHA; Cornell, 1968). On the other hand, aftershock probabilistic seismic hazard analysis (APSHA), 12
based on the modified Omori law, allows the quantification of the aftershock threat (Yeo and Cornell, 13
2009). Classical PSHA often describes event occurrence via a homogeneous Poisson process, whereas 14
APSHA describes occurrence of aftershocks’ via cluster-specific nonhomogeneous Poisson processes, 15
the rate of which is a function of the mainshock magnitude. It is easy to recognize that clusters, each of 16
which is made of the mainshock and the following aftershocks, occur at the same rate of mainshocks. 17
This recently allowed the generalization of the hazard integral to account for aftershocks in PSHA (i.e., 18
Iervolino et al., 2014), which resulted in the formulation of the so-called sequence-based probabilistic 19
seismic hazard analysis (SPSHA). In the present study, SPSHA is applied to Italy countrywide, using 20
the same source model (Stucchi et al., 2011) lying at the basis of the official PSHA used for structural 21
design, to quantitatively assess the increase in seismic design actions for structures when accounting for 22
the aftershocks. 23
Introduction
24
The state-of-the-art in structural engineering codes is such that design seismic accelerations are derived 25
from probabilistic seismic hazard analysis (PSHA; Cornell, 1968, McGuire, 2004). The latter provides, 26
for a site of interest, the ground motion intensity measure (IM) value that corresponds to a given rate of 27
exceedance. The IM is typically an ordinate of a pseudo-acceleration response spectrum, and structures 28
must be designed against values corresponding to rates that are functions of the desired seismic 29
performance. 30
Even if seismic events generally occur in time-space clusters, classical PSHA describes the 31
occurrence of earthquakes via a homogeneous Poisson process or HPP. (This model is used to determine 32
seismic design actions in Italy, that is the case investigated herein; however, other occurrence processes 33
can be used for PHSA, see for example Beauval et al., 2006). From the HPP assumption of earthquake 34
occurrence, it follows that the events causing the exceedance of an IM-value at a site of interest occur 35
according to a HPP (Cornell, 1968). To be compatible with this modeling hypothesis, only mainshocks, 36
typically the largest magnitude earthquakes within each cluster, are considered via procedures generally 37
known as catalog declustering (e.g., Gardner and Knopoff, 1974). 38
For short-term risk management purposes during seismic sequences, aftershock probabilistic seismic 39
hazard analysis (APSHA) has been developed (Yeo and Cornell, 2009). APSHA models the occurrence 40
of aftershock via cluster-specific nonhomogeneous Poisson processes (NHPP), the rate of which is a 41
function of the magnitude of the mainshock that has triggered the sequence, via the modified Omori law 42
(Utsu, 1961). Because earthquake sequences, made of mainshocks and following aftershocks, occur at 43
the same rate of the mainshocks, it is possible to combine HPP-based PSHA and APSHA to include the 44
effect of aftershocks in probabilistic seismic hazard analysis, still working with a declustered catalog. 45
The mathematics of this stochastic model, named sequence-based probabilistic seismic hazard analysis 46
(SPSHA), was presented in Iervolino et al. (2014). 47
For any given IM-value, SPSHA provides the rate of mainshock-aftershock clusters that cause its 48
exceedance at the site, and its main advantages are: (i) it is probabilistically rigorous in the framework 49
of PSHA and APSHA, (ii) it allows the retention of the HPP hypothesis for their occurrence, and (iii) it 50
avoids the issues of non-declustered catalogs such as completeness (see also Marzocchi and Taroni, 51
2014). It should also be noted that SPSHA, although stimulated by the work of Boyd (2012), is different 52
mainly because it does not consider foreshocks, makes recourse to APSHA to describe aftershocks, and 53
provides an analytical framework extending the classical PSHA integral. 54
To quantify the effect of aftershocks on design accelerations, SPSHA is applied herein to Italy to 55
develop maps of two spectral (pseudo) accelerations corresponding to four return periods, those that are 56
most common for design of structures according to the Italian seismic code (Stucchi et al., 2011). To 57
this aim, the same source model (i.e., Meletti et al., 2008) of the current official seismic hazard of Italy 58
is considered. The obtained SPSHA maps are compared with those based on the same source model, yet 59
from classical PSHA, to help in quantitatively assessing the effects of aftershocks for structural design, 60
a relevant issue from the earthquake engineering perspective. 61
The remainder of the paper is structured such that the essentials of SPSHA are recalled first. Then, 62
disaggregation of SPSHA, not originally provided in Iervolino et al. (2014) is formulated. It allows the 63
assessment of how much the exceedance of a ground motion IM-value is contributed by aftershocks 64
with respect to mainshocks, and is helpful for the scopes of this study. Subsequently, after introducing 65
the considered source model for Italy, SPSHA results, in terms of countrywide maps of spectral 66
accelerations for given return periods of exceedance, are presented along with the PSHA counterpart. 67
Moreover, two sites, exposed to comparatively low and high hazard according to PSHA, are also 68
considered for more detailed discussions. The modeling consistency between PSHA and SPSHA allows, 69
finally, the direct comparison of the obtained results and the discussion of the engineering significance 70
of accounting for aftershocks in seismic hazard assessment in Italy. 71
Sequence-based probabilistic seismic hazard analysis
72
The main result of PSHA for a site of interest is the average number of earthquakes in one year (i.e., the 73
rate) causing exceedance of a given IM threshold, say im. The rate of exceedance of im, herein indicated 74
as im E, , is typically obtained via Equation (1), which is written, for simplicity, for the case of a single 75
seismic source zone. 76
( )
,max ,max ,min ,min , | , , , E E E E E E r m im E E E M R r m P IM im x y f x y dx dy =
(1) 77In the equation, E is the rate, from a declustered catalog (e.g., Reiter, 1990), of earthquakes above a
78
minimum magnitude of interest
(
mE,min)
and below the maximum magnitude(
mE,max)
of the considered 79seismic source. The term P IM
E im x y| ,
, provided by a ground motion prediction equation (GMPE), 80represents the probability that the intensity threshold is exceeded given an earthquake of magnitude 81
E
M =x, from which the site is separated by a distance RE =y, where RE
(
rE,min,rE,max)
. The term fME,RE82
is the joint probability density function (PDF) of mainshock magnitude and distance random variables 83
(RVs). If these two RVs may be considered stochastically independent,
E M
f can be, for example, 84
described by a truncated exponential distribution, derived by the Gutenberg-Richter (GR) relationship 85
(Gutenberg and Richter, 1944), and
E R
f is obtained on the basis of the source-site geometrical 86
configuration. The integral limits are the magnitudes bounding the magnitude PDF and the distances 87
defining the domain of possible RE values.
88
Because E is from a declustered catalog, and fME,RE refers to mainshocks, then the subscript
89
( )
E was added to distinguish the obtained rate, im E, , from the one by SPSHA, to follow. Finally, in the 90case of multiple seismic source, say s in number, Equation (1) is computed one source at a time and the 91
results summed up: , 1 , ,
s
im E i im E i
=
= . 92SPSHA aims to evaluate the average number of seismic sequences (mainshocks and following 93
aftershocks) that in one year cause at least one exceedance of im at the site. This rate, called im, is still
94
that of a HPP. It was demonstrated in Iervolino et al. (2014) that, under the hypotheses for aftershock 95
hazard of Yeo and Cornell (2009), im can be computed via Equation (2); i.e., a generalization of
96 Equation (1). 97
|( ) , , ( )( )
, 0, | , , , , 1 | , , A x A A MARAMERE MARA E E E E E N T P IM im w z f w z dw dz im E E M R M R P IM im x y e f x y dx dy = − −
(2) 98The terms: E , P IM
E im x y| ,
= −1 P IM
E im x y| ,
, and fME,RE(
x y,)
are the same as defined in99
Equation (1). Also ME
(
mE,min,mE,max)
and RE(
rE,min,rE,max)
; i.e., the integral limits are also the same. 100The exponential term within the integral refers to aftershocks and is worth of a description. It is the 101
probability that none of the aftershocks, following the mainshock of features
ME =x R, E =y
, cause 102exceedance of im. This probability depends on P IM
Aim w z| ,
that is the probability that im is 103exceeded given an aftershock of magnitude MA=w and source-to-site distance RA =z. The term
104
, | ,
A A E E
M R M R
f is the distribution of magnitude and distance of aftershocks, which are conditional on the 105
features
ME,RE
of the mainshock. This distribution can be written as fMA,R MA| E,RE = fMA|ME fR MA| E,RE,106
where fMA|ME is the PDF of aftershock magnitude (i.e., GR-type), and fR MA| E,RE is the distribution of the
107
distance of the site to the aftershocks. The aftershock magnitude is bounded by a minimum magnitude, 108
min
m , and the mainshock magnitude; i.e., MA
(
mmin,x)
. (Note that mmin may coincide with the 109minimum mainshock magnitude; i.e., mminmE,min.) Given the location of the site, the aftershock 110
distance, RA
(
rA,min,rA,max)
, depends on the magnitude and location of the mainshock (see Iervolino et 111al., 2014, for details). E N A x|
(
0,TA)
is the expected number of aftershocks, to the mainshock of112
magnitude ME =x, in the TA time interval, which is the considered length of the aftershock sequence
113
(assuming that the mainshock occurred at t =0). This number, consistent with APSHA, can be 114
computed as in Equation (3), where
a b c p, , ,
are the parameters of the modified Omori law (Yeo and 115 Cornell, 2009). 116(
)
( min)(
)
1 1 | 10 10 0, 1 a b x m a p p A x A A E N T c T c p + − − − − = − + − (3) 117In fact, Equation (2) represents a hazard integral for aftershocks (exponential term), conditional to 118
E
M =x and RE = y, nested in a classical PSHA integral. It is easy to recognize that it must be imim E, 119
; i.e., accounting for aftershocks necessarily increases the hazard. Moreover, Equation (2) precisely 120
degenerates in Equation (1) in case aftershocks are neglected; i.e., 121
(
)
(
)
| 0, 0, ,min, ,max
A x A E E
E N T = x m m . Thus, the latter equation generalizes the former. 122
Finally, it should be noted that, for design, earthquake engineering is interested in the probability 123
that at least one exceedance of a ground motion intensity measure is observed during the design-life of 124
the structure, T . In SPSHA, because the computed rate is still that of an HPP, such a probability can 125
be computed via 1−e−imt, exactly as in the PSHA case. Thus, design seismic actions can be updated
126
accounting for the aftershock effect within the classical probabilistic framework. 127
Aftershock disaggregation 128
A side result of SPSHA formulation, is the probability that exceedance of im is caused by an aftershock 129
rather than by a mainshock. This probability, which quantifies the contribution of aftershocks to hazard, 130
can be regarded as a disaggregation in much the same way classical hazard disaggregation (e.g., 131
Iervolino et al., 2011) provides the probability that exceedance of design accelerations is caused by 132
specific magnitude-distance pairs, or other random variables possibly involved in the hazard assessment. 133
SPSHA disaggregation is defined in Equation (4) as
134
A E A E
P IM imIM im IM imIM im. The symbol IME represents the mainshock IM, while
135
A
IM is the maximum IM of the following aftershock sequence. Then, the sought probability is the 136
probability that, given that exceedance of im has been observed during the mainshock-aftershock 137
sequence due to the mainshock or at least one of the aftershocks, that is
(
IME imIM A im)
, it was138
in fact an aftershock to cause it, while the mainshock was below the threshold: i.e., 139
(
IM AimIME im)
. 140
|( ) , , ( )( )
, 0, | , , , , | , 1 , A x A A MARAMERE MARA E E E E E A E A E N T P IM im w z f w z dw dz E E M R im M R P IM im IM im IM im IM im P IM im x y e f x y dx dy − = −
(4) 141The equation, the derivation of which is given in the appendix, uses terms already introduced to define 142
SPSHA. It will be useful for the scope of this work, as illustrated in the following countrywide 143
application to Italy. 144
SPSHA for Italy
145
Mainshock model (classical hazard) 146
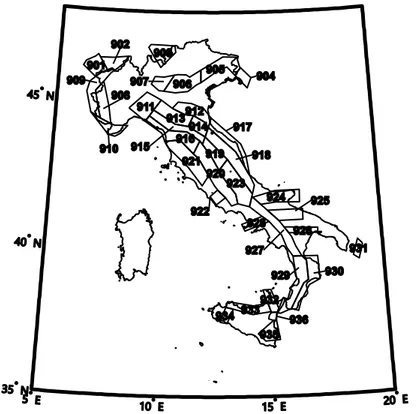
The source model considered herein for Italy is the one by Meletti et al. (2008), which features thirty-147
six seismic source zones (Figure 1) and lies at the core of the Italian hazard study described in Stucchi 148
et al. (2011). The latter, in turn, provides uniform hazard spectra (UHS) to define engineering structural 149
seismic actions according to the enforced code. 150
The seismic hazard study of Stucchi et al. (2011) features a fairly-complex logic tree. Herein, the 151
branch named 921 is considered; it is the single branch producing the hazard results claimed to be the 152
closest to those of the full logic tree (this is for simplicity only, as modeling uncertainty can be 153
considered in SPSHA in analogy to what done in PSHA). Branch 921 considers the mentioned zones 154
and the GMPE by Ambraseys et al. (1996) to compute P IM
E im x y| ,
on rock soil conditions. 155Herein, the GMPE is applied within its definition ranges of magnitude and distance: these are 156
magnitudes between 4.0 and 7.5 and the closest horizontal distance to the surface projection of the fault 157
plane up to 200 km. The effects of earthquakes with magnitude and distance outside these intervals are 158
neglected. Assuming a uniform epicenter distribution in each seismogenic zone, epicentral distance is 159
converted into the metric required by the GMPE according to Montaldo et al. (2005). The style-of-160
faulting correction factors proposed by Bommer at al. (2003) are also applied to the GMPE, consistent 161
with the rupture mechanism associated to each seismic source zone by Meletti et al. (2008). 162
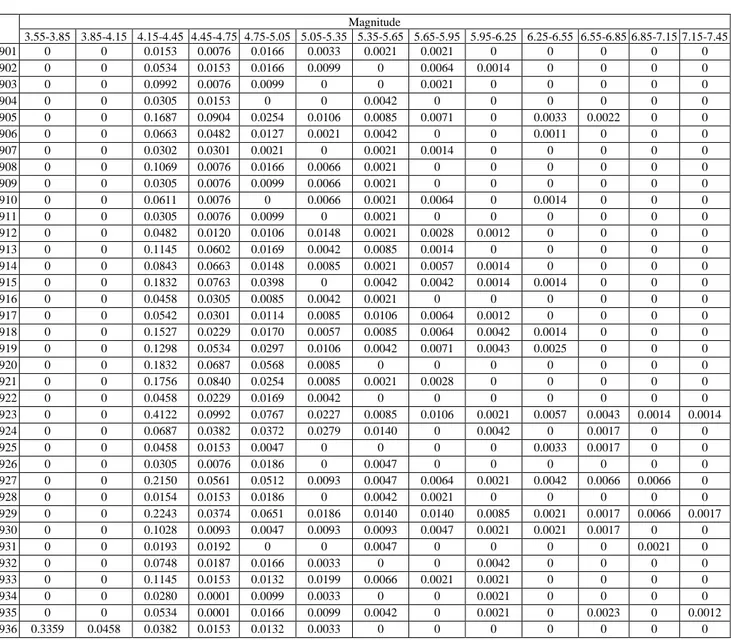
As it regards the mainshock rates of the zones, in branch 921 of Stucchi et al. (2011) they are not 163
provided as GR relationships, but for surface-wave magnitude bins. These, provided by Carlo Meletti 164
(see Data and Resources), are given in Table 1. The central magnitude of the lowest bin is generally 4.3 165
(apart from the zone 936 which is the Etna’s volcanic area and has a central magnitude of the lower bin 166
equal to 3.7), while the maximum depends on the zone of interest (as it can be inferred from the largest 167
magnitude bin with rate larger than zero in Table 1). 168
This model is used either to compute PSHA for the country (to provide a point of comparison), as 169
well as to compute SPSHA, which considers the same mainshock rates and zones. 170
Aftershock model 171
The parameters used in the modified Omori law, Equation (3) are from Lolli and Gasperini (2003) for 172
generic Italian aftershock sequences: a = −1.66, b =0.96, c =0.03 (in days), p =0.93. The minimum 173
magnitude of generated aftershocks
(
mmin)
corresponds to the minimum mainshock magnitude of the 174seismic source zones: that is, 4.15 for all the seismogenic zones, except zone 936 for which it is 4.0. 175
Indeed, zone 936 is able to generate earthquakes with magnitude lower than 4.0; however, the GMPE is 176
applied within its definition range, which constrains the aftershocks’ minimum magnitude to 4.0. 177
It is assumed that aftershocks are located, with uniform probability, in a circular area centered 178
on the mainshock location. The size of this area, SA, depends on the magnitude of the mainshock
179
(
ME =x)
via Equation (5), in squared kilometers (Utsu, 1970). 180 4.1 10x A S = − (5) 181 Working hypotheses 182Some working hypotheses that were taken mostly for simplicity, are believed not to affect the general 183
conclusions; nevertheless, they could be possibly refined in more detailed studies. 184
The aftershock area is considered circular for simplicity, although an elliptical shape, for 185
example along the Apennines mountain chain (in central Italy) that is the typical strike orientation in the 186
region, would better reflect knowledge of seismicity. Within the aftershock area, locations are uniformly 187
distributed, while their probability is zero outside. On the other hand, an aftershock probability gradually 188
decreasing as the distance from the mainshock increases is often preferred (it was verified in Iervolino 189
et al., 2014, that this hypothesis negligibly affects the results). Moreover, the limits of the aftershock 190
area can exceed the boundaries of the seismic source zone. 191
Equation (5) was originally calibrated for 5.5ME 7.5; in the applications shown in this 192
paper, it is extended to the minimum magnitudes considered. The Ambraseys et al. (1996) GMPE is 193
used for both P IM
A im w z| ,
and P IM
E im x y| ,
terms of Equation (2); i.e., for both mainshock 194and aftershocks, also keeping the same style of faulting recommended for the zone in question by Meletti 195
et al. (2008). 196
Finally, following Yeo and Cornell (2009), the duration of the aftershock sequence
(
TA)
was197
considered arbitrarily equal to ninety days since the occurrence of the mainshock, although, in principle, 198
this duration could be mainshock-magnitude-dependent. In any case, it has been verified that assuming 199
365
A
T
= days leads to negligible differences in results compare to TA=90 days. 200
Analysis and results
201
In the following sections, SPSHA results for Italy are presented along with their PSHA counterpart (all 202
calculations are carried out via a recent version of the software described in Iervolino et al., 2016). First, 203
hazard maps are reported for several return periods and two spectral ordinates. Then, considering two 204
specific sites, hazard curves, uniform hazard spectra and aftershock disaggregation are provided and 205
discussed. 206
Hazard maps 207
To compute hazard maps, a uniformly-spaced grid of more than four-thousand points covering the inland 208
Italian territory is considered. Peak ground acceleration (PGA) and spectral accelerations at 1 second 209
natural vibration period, Sa(1s), on rock, are considered as the IMs. The hazard maps refer to four return 210
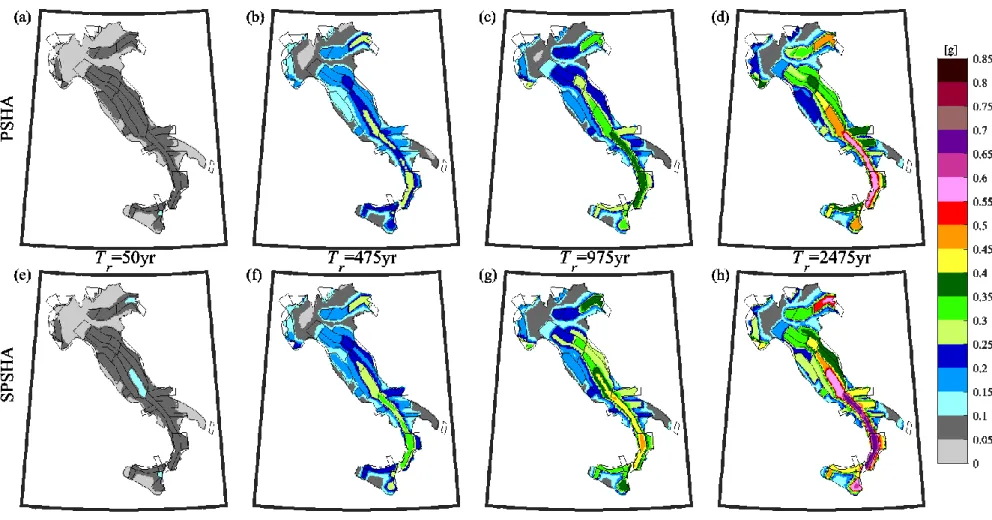
periods
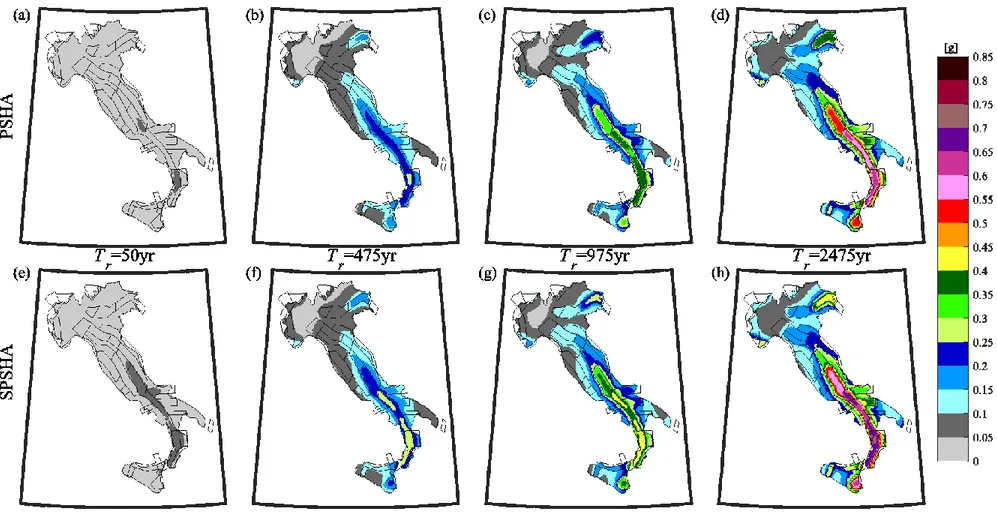
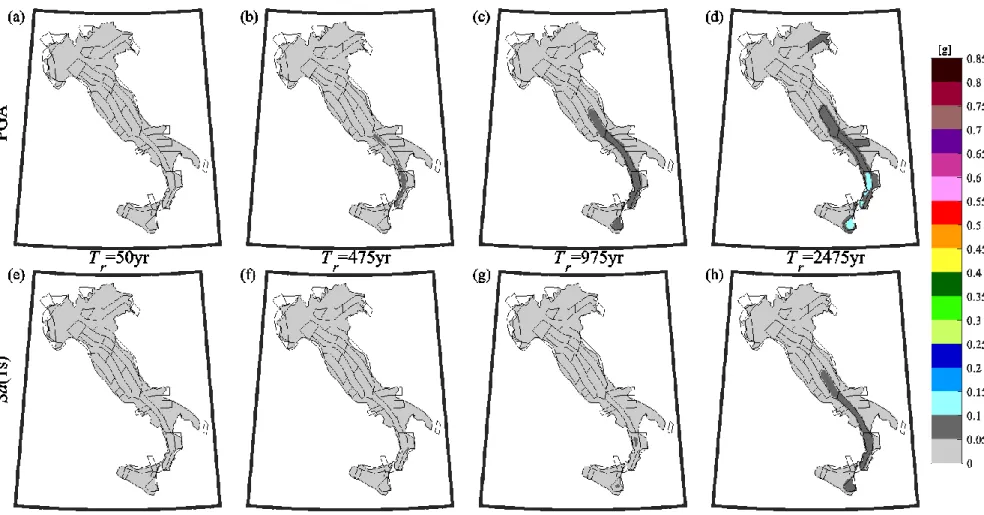
( )
Tr : 50yr, 475yr, 975yr and 2475yr. Results are reported in Figure 2 and Figure 3, for PGA211
and Sa
( )
1s respectively. In each figure, the upper line of panels, that is maps from (a) to (d), result from 212PSHA. The lower line, maps from (e) to (h), are the corresponding results from SPSHA. To compare 213
PSHA and SPSHA for the same return period in both figures, one should consider panels: (a) and (e) 214
for T =r 50yr, (b) and (f) for T =r 475yr, (c) and (g) for T =r 975yr, (d) and (h) for T =r 2475yr. It can be
215
preliminary observed that, in general, the effect of aftershocks tends to be more relevant in areas exposed 216
to comparatively high hazard according to classical PSHA; i.e., areas with larger acceleration values in 217
the top panels of Figure 2 and Figure 3. 218
To more quantitatively assess the hazard increase due to aftershocks, Figure 4 shows absolute 219
differences between SPSHA and PSHA in terms of IMs that, at the same site, correspond to the same 220
return period (for example, panel (a) of Figure 4 is the map obtained subtracting the map in panel (a) 221
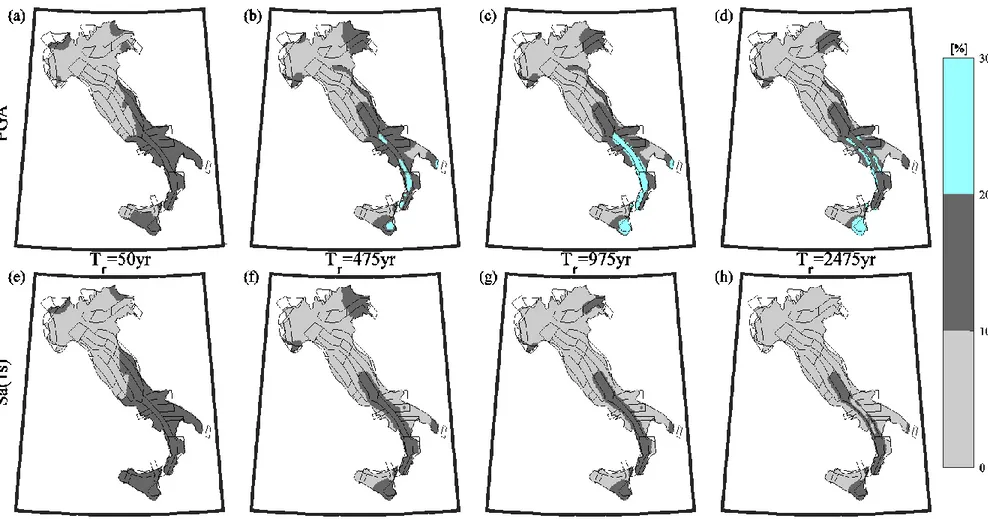
from that of panel (e) in Figure 2). Figure 5 reports the percentage increase; i.e., it is obtained by dividing 222
the maps in Figure 4 by the corresponding PSHA maps of Figure 2 and Figure 3. It can be observed 223
that: (i) absolute differences are generally larger for larger return periods; (ii) considering the same 224
return period, differences in terms of PGA are larger than those in terms of Sa
( )
1s ; (iii) considering the 225same return period and the same intensity measure, largest differences are recorded at the sites enclosed 226
into the zone with highest maximum magnitude, that is zones 923, 927, 929 and 935; (iv) percentage 227
increases are not monotonic as a function of Tr; (v) also percentage increases in terms of PGA are
228
generally larger than those in terms of Sa
( )
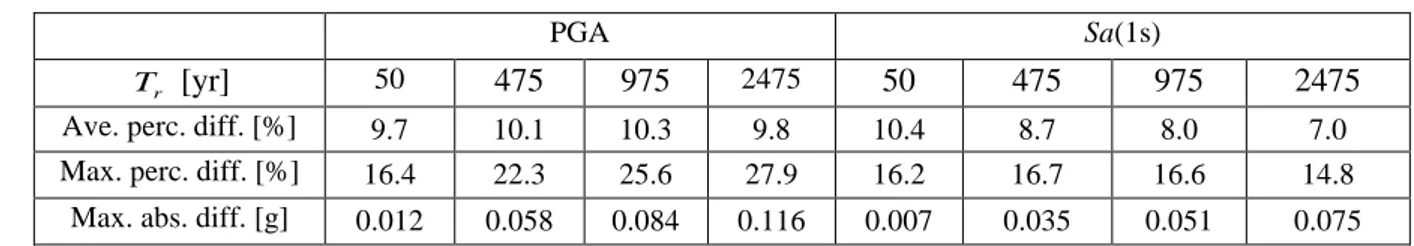
1s . 229Table 2 summarizes average and maximum percentage differences (ave. perc. diff. and max. 230
perc. diff., respectively) over the country and maximum absolute differences (max. abs. diff.) from the 231
maps of Figure 4 and Figure 5. Average percentage increases for Sa
( )
1s , as a function of the return 232period, are between 10.4% and 7%, with the largest value occurring for T =r 50yr. The range for PGA 233
is similar, that is around 10%, yet narrower. The maximum percentage increases are about 28% for PGA 234
at T =r 2475yr and 17% for Sa
( )
1s at T =r 475yr. The former occurs just outside zone 935, while the235
latter within it. It is interesting to note that, for Sa
( )
1s , maximum increase does not correspond to the 236largest return period. This issue is looked at deeper in the following sections in which two specific sites 237
are considered and site-specific hazard curve, uniform hazard spectra and aftershock disaggregation are 238
reported and discussed. Maximum absolute differences for PGA are equal to 0.012g, 0.058g, 0.084g 239
and 0.116g for return periods equal to 50yr, 475yr , 975yr and 2475yr , respectively. Maximum 240
differences in terms of Sa
( )
1s are equal to 0.007g, 0.035g, 0.051g and 0.075g for return periods equal 241to 50yr, 475yr, 975yr and 2475yr, respectively. For PGA, the maximum differences for return periods 242
up to 975yr correspond to sites located within zone 929, while the maximum difference for T =r 2475yr 243
occurs at a site enclosed into zone 935; for Sa
( )
1s , maximum differences for T =r 50yr and T =r 475yr244
occur within zone 929, while they occur within the 935 zone for T =r 975yr and T =r 2475yr(see Figure
245 1). 246
Site-specific hazard analysis and aftershocks disaggregation 247
Two sites have been selected to analyse in more details the aftershocks effect on the hazard assessment. 248
The sites are L’Aquila in central Italy (13.40°E, 42.35°N) and Milan in Northern Italy (9.18°E, 249
45.47°N): they are selected to be representative of the high (L’Aquila) and low (Milan) PSHA hazard 250
according to classical PSHA (see Figure 2 and Figure 3). 251
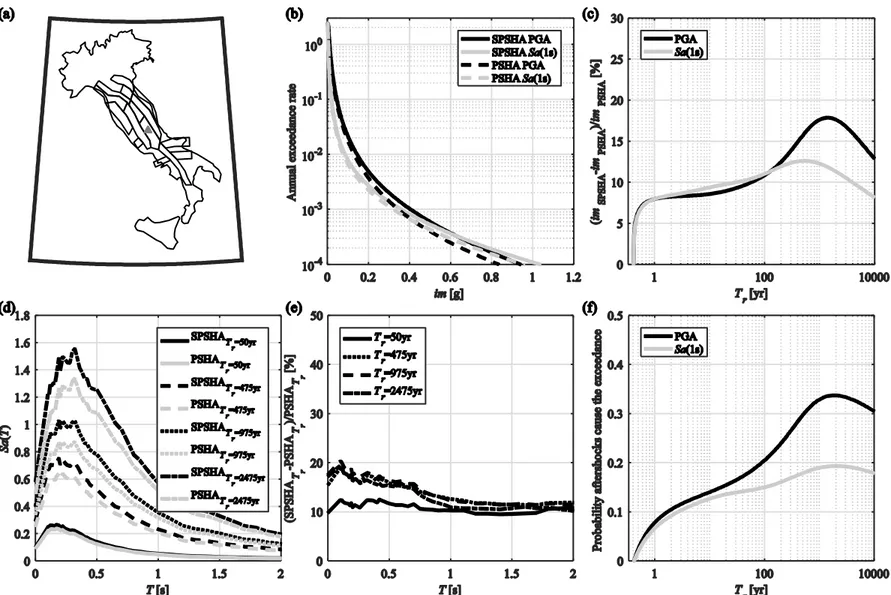
Results for L’Aquila are given in Figure 6. More specifically, Figure 6a shows the site location 252
and the fifteen seismogenic zones contributing to the hazard (i.e., within 200 km). The zone in which 253
the site is enclosed is the 923, which is one of the three zones from Meletti et al. (2008) with largest 254
maximum magnitude (the others are 929 and 935; see Table 1). In Figure 6b, the hazard curves for PGA 255
(black lines) and Sa
( )
1s (grey lines) are reported (dashed is PSHA and solid is SPSHA). The range of 256IM in which the analyses are performed is such that the maximum return period is equal to ten thousand 257
years. On the other hand, the maximum rate is 2.41, that is, the rate of mainshocks (then also clusters) 258
occurring within 200km from the site; i.e., the rate of exceedance when IM tends to zero, see Equation 259
(1) and Equation (2). Figure 6c reports the increase of im between SPSHA and PSHA as a function of 260
the decreasing rate of exceedance (i.e., increasing return period). These differences are non-monotonic 261
for both PGA and Sa
( )
1s . Maximum increase for PGA is 17.9% and it occurs for a return period of 2621350 years whereas the maximum increase for Sa(1s), equal to 12.6%, corresponds to a return period 263
of about 530 years. The non-monotonic trend of hazard increase motivates the evidence that maximum 264
increase for Sa
( )
1s at a national scale occurs at a 475yr return period (see Table 2). Uniform hazard 265spectra for the four return periods of 50yr, 475yr, 975yr and 2475yr are reported in Figure 6d. The 266
spectra, indicated as PSHA
r
T and SPSHATr, are computed considering the forty-seven natural vibration
267
(spectral) periods, T, between zero and two seconds provided by the adopted GMPE. Increase between 268
SPSHA and PSHA for the selected return periods is reported in Figure 6e as a function of the spectral 269
period. When the return period is 50yr, hazard increase is about 10% for all the vibration periods. On 270
the other hand, for return periods of 475yr, 975yr and 2475yr, hazard increase is between 15% and 271
20% for spectral periods lower than 0.7s, and are between 10% and 15% for spectral periods larger than 272
0.7s. Finally, aftershock disaggregation is reported in Figure 6f as a function of the increasing return 273
period. As discussed above, SPSHA disaggregation according to Equation (4) provides the probability 274
that, once exceedance of im is observed, it is caused by an aftershock rather than a mainshock; in this 275
sense, it may help in assessing the contribution of aftershock to hazard. Also these curves show a non-276
monotonic trend. The probability that exceedance of the IM threshold of interest is caused by aftershocks 277
initially rises with the rising return period. The maximum values of probability from aftershock 278
disaggregation are equal to 0.34 for PGA and 0.19 forSa
( )
1s , and correspond to T =r 1900yr and 2792000yr
r
T = , respectively. For longer return periods, aftershock disaggregation decreases. The difference 280
in disaggregation curves for PGA and for Sa
( )
1s is such that at the lower return periods the contribution 281of aftershocks is similar for the two spectral ordinates, while at the larger return periods is larger for 282
PGA than Sa(1s). This may provide insights for the trends observed in Figure 6e. 283
Figure 7 shows the analogous results for Milan. The site is not enclosed in any seismogenic 284
zone and its hazard is affected by the zones reported in Figure 7a. The rates of earthquake occurrence 285
above minimum magnitude (i.e., the value hazard curves tend to when IM tends to zero) is 1.40 and the 286
considered maximum return period is, similarly to the previous case, ten-thousand years. Hazard curves 287
for PGA and Sa
( )
1s are reported in Figure 7b while increases are in Figure 7c. In the latter, maximum 288values equal to 8.5% and 9.0% for PGA and Sa(1s), respectively. The corresponding return periods are 289
six and ten years. Figure 7d shows the UHS for the four return periods. Hazard increase (Figure 7e) due 290
to SPSHA with respect to PSHA is, for this site, between about 4% and 10% for all the vibration periods 291
and return periods here considered. However, the largest increases are observed for the lower return 292
periods, which is explained by the trend observed in Figure 7c for PGA and Sa
( )
1s . Hazard 293disaggregation is reported in Figure 7f: maximum probability value for PGA is 0.22 and it corresponds 294
to a return period of 1200 years whereas maximum Sa
( )
1s is 0.16 for an im threshold with 60 years 295exceedance return period. It should be noted that the maximum values of the probability that an 296
aftershock is causative for exceedance in Milan are significantly lower with respect to the case of 297
L’Aquila, mainly because the former site is outside any seismic source zone, while the latter is within 298
one of the most seismically relevant, as per Table 1. To deepen how the trends, observed at this and the 299
other site considered, depend on an interplay of source-site configuration, the interested reader is 300
referred to Chioccarelli et al. (2018). 301
Conclusions
302
Sequence-based probabilistic seismic hazard analysis (SPSHA) includes the aftershock’s effect in 303
probabilistic seismic hazard assessment. The modified hazard integral relies on the modified Omori law 304
and is probabilistically rigorous in the framework of the considered models. The SPSHA stochastic 305
model was introduced in 2014; herein it is applied at a national scale using Italy as a case-study. The 306
hazard increase due to aftershocks is evaluated considering the same source model lying at the basis of 307
the official seismic hazard of Italy used for structural design. Comparison was carried out in terms of 308
maps of two spectral ordinates with four return periods of exceedance between 50yr and 2475yr on rock 309
site conditions, as well as full hazard curves and SPSHA disaggregation for two sites differently exposed 310
to seismic hazard according to classical PSHA. Beyond the obvious fact that accounting for the 311
aftershocks’ effect increases the hazard in Italy, the analysis allowed pointing out the following issues: 312
• increase of im for a given return period can be as high as about 30%; in absolute terms, up to 313
0.12g for PGA when the return period of the exceedance is 2475 years (the site for which the 314
percentage increase is maximum is not the one for which the absolute increase is the largest); 315
• as expected, increase due to aftershocks tends to be more significant within or around areas 316
exposed to comparatively higher hazard according to classical PSHA; however, increases are 317
not analogous for different IMs; e.g., PGA and Sa
( )
1s ; as expected by the fact that magnitudes 318and source-to-site distances contribute differently to hazard of different spectral ordinates; 319
• disaggregation of sequence-based probabilistic hazard, at least in the considered examples, 320
shows that the contribution of hazard is not monotonic with the increasing return period of 321
exceedance (the specific trend at each site depends on the source-site configuration). 322
It may be concluded that, notwithstanding the working hypothesis behind this application, which could 323
be refined in more detailed studies, introducing Omori-type aftershock sequences can have a non-324
negligible effect on design actions in Italy. 325
Data and resources
326
All data and resources used in this study are from the listed references, except magnitude rates, which 327
were kindly provided by Carlo Meletti (Istituto Nazionale di Geofisica e Vulcanologia, Italy). 328
Acknowledgements
329
This work was developed within the Rete dei Laboratori Universitari di Ingegneria Sismica (ReLUIS) 330
2014-2018 framework programme. Authors thank Ms. Racquel K. Hagen (Stanford University, CA) for 331
having proofread the manuscript. 332
References
333
Ambraseys, N. N., K. A. Simpson, and J. J. Bommer (1996). Prediction of horizontal response spectra
334
in Europe, Earthq. Eng. Struct. D.25, 371-400.
335
Beauval, C., S. Hainzl, and F. Scherbaum (2006). Probabilistic seismic hazard estimation in
low-336
seismicity regions considering non-Poissonian seismic occurrence, Geophys. J. Int. 164, 543-550
337
Bommer, J. J., J. Douglas, and F. O. Strasser (2003). Style-of-faulting in ground-motion prediction
338
equations, Bull. Earthq. Eng. 1, 171–203.
339
Boyd, O. S. (2012). Including foreshocks and aftershocks in time‐independent probabilistic seismic‐
340
hazard analyses, Bull. Seismol. Soc. Am. 102, 909-917.
341
Chioccarelli, E., P. Cito, and I. Iervolino (2018). Disaggregation of sequence-based seismic hazard. 342
Proc. of 16th Conference on Earthquake Engineering, 16ECEE, Thessaloniki, Greece, 18-21 June.
343
Cornell, C. A. (1968). Engineering Seismic Risk Analysis, B. Seismol. Soc. Am. 58, 1583-1606. 344
Gardner, J. K, L. Knopoff (1974). Is the sequence of earthquakes in southern California, with aftershocks
345
removed, poissonian?, Bull. Seismol. Soc. Am. 60(5), 1363–1367.
Gutenberg, B. and C. F. Richter (1944). Frequency of earthquakes in California, B. Seismol. Soc. Am. 347
34, 185-188.
348
Iervolino, I., E. Chioccarelli, and P. Cito (2016). REASSESS V1.0: a computationally-efficient software
349
for probabilistic seismic hazard analysis. Proc. of VII European Congress on Computational
350
Methods in Applied Sciences and Engineering, ECCOMAS, Crete Island, Greece, 5–10 June. 351
Iervolino, I., M. Giorgio, and B. Polidoro (2014). Sequence-based probabilistic seismic hazard analysis.
352
Bull. Seismol. Soc. Am. 104, 1006-1012. 353
Iervolino, I., E. Chioccarelli, and V. Convertito (2011). Engineering design earthquakes from 354
multimodal hazard disaggregation, Soil Dyn. Earthq. Eng. 31(9), 1212–1231. 355
Lolli, B., and P. Gasperini (2003). Aftershocks hazard in Italy Part I: Estimation of time-magnitude
356
distribution model parameters and computation of probabilities of occurrence, J. Seismol. 7, 235–
357
257.
358
Marzocchi, W., and M. Taroni (2014). Some thoughts on declustering in probabilistic seismic‐hazard
359
analysis, Bull. Seismol. Soc. Am. 104, 1838–1845.
360
McGuire, R. K. (2004). Seismic Hazard and Risk Analysis, Earthquake Engineering Research Institute,
361
MNO-10, Oakland, California.
362
Meletti, C., F. Galadini, G. Valensise, M. Stucchi, R. Basili, S. Barba, G. Vannucci, and E. Boschi
363
(2008). A seismic source zone model for the seismic hazard assessment of the Italian territory,
364
Tectonophysics 450, 85–108. 365
Montaldo, V., E. Faccioli, G. Zonno, A. Akinci, and L. Malagnini (2005). Treatment of ground-motion
366
predictive relationships for the reference seismic hazard map of Italy, J. Seismol. 9, 295–316.
367
Reiter, L (1990). Earthquake hazard analysis: issues and insights. Columbia University Press, NY.
368
Stucchi, M., C. Meletti, V. Montaldo, H. Crowley, G. M. Calvi, and E. Boschi (2011). Seismic hazard
369
assessment (2003–2009) for the Italian building code, Bull. Seismol. Soc. Am. 101, 1885–1911.
370
Utsu, T. (1970). Aftershocks and earthquake statistics (1): Some parameters which characterize an
371
aftershock sequence and their interrelations. Journal of the Faculty of Science, Hokkaido University,
372
Series 7, Geophysics 3, 129-195. 373
Utsu, T. (1961). A statistical study on the occurrence of aftershocks, Geophys. Mag. 30, 521–605.
374
Yeo, G. L., and C. A. Cornell (2009). A probabilistic framework for quantification of aftershock ground‐ 375
motion hazard in California: Methodology and parametric study, Earthq. Eng. Struct. D. 38, 455–
376
60.
Appendix
378
This appendix provides the derivation of aftershock disaggregation given in Equation (4). The symbols 379
used in the derivation, some of which have been given already in the body of text, are as follows: 380
• vE: mainshock (and sequence) occurrence rate;
381
• ME
(
mE,min,mE,max)
: mainshock magnitude; 382• MA
(
mmin,x)
: aftershock magnitude; 383• RE
(
rE,min,rE,max)
: mainshock source-to-site distance; 384• RA
(
rA,min,rA,max)
: aftershock source-to-site distance; 385• E N A x
(
0,TA)
: mean number of aftershocks in a sequence of duration TA triggered by a386
mainshock of ME =x;
387
• E N A im x,
(
0,TA)
: mean number of aftershocks exceeding the im threshold in a sequence of388
duration TA triggered maishock of ME =x;
389
• im: rate of exceedance of im according to SPSHA.
390
• IME: mainshock IM;
391
• IMA: single aftershock IM;
392
• IM A: maximum aftershock IM in during a sequence. 393
It is sought the probability that, once exceedance of IM is observed, it is caused by an aftershock. Such 394
a probability is formulated considering the following two events: (1) exceedance is observed and it could 395
be possibly observed in the mainshock and/or during the aftershock sequence
(
IME imIM A im)
;396
(2) exceedance is observed in the aftershock sequence and it is not observed in the mainshock 397
(
IME imIM A im)
. Consequently, the sough probability is: 398E A E A
P IM imIM im IM imIM im that can be written as: 399
E A E A E A E A E A E A E A E A P IM im IM im IM im IM im P IM im IM im IM im IM im P IM im IM im P IM im IM im P IM im IM im P IM im IM im = = , (A1) 400
where it is easy to recognize that P IM E imIM Aim IMEimIM Aim=1 given that 401
exceedance has been observed during the aftershock sequence, it is certain that exceedance has been 402
observed; i.e., the latter event is included in the former
(
IME imIM Aim) (
IME imM A im)
403. Now, applying the total probability theorem to the numerator of Equation (A1) gives, 404
( )
( )
, , , , | , , | , | , , E E E E E E E E E A M R M R E A E A E A E A M R M R E A P IM im IM im x y f x y dx dy P IM im IM im P IM im IM im P IM im IM im P IM im x y P IM im x y f x y dx dy P IM im IM im = =
. (A2) 405In this latter equation, it is considered that the IMs of mainshocks and aftershocks are conditionally 406
independent given the mainshock features (Yeo and Cornell, 2009). 407
It can be now recognized that the probability that exceedance of IM is not observed during the 408
aftershock sequence is given by Equation (A3), which follows the NHPP assumption of APSHA (see 409 Iervolino et al., 2014). 410 ( ) ( ) , , ( ) , , 0, | , , 0, | , 1 1 A A A x MARAMERE A A im x MARA E N T P IM im w z f w z dw dz E N T A P IM im x y e e − − = − = − (A3) 411
At this point, replacing Equation (A3) in Equation (A2), and multiplying numerator and denominator 412
by vE, provides the sought result:
413
|( ) , , ( )( )
, 0, | , , , , | , 1 , A x A A MARAMERE MARA E E E E E A E A E N T P IM im w z f w z dw dz E E M R im M R P IM im IM im IM im IM im P IM im x y e f x y dx dy − = −
. (A4) 414The equation takes advantage of EP IM E imIM A im=im. As a matter of fact, the rate of
415
exceedance of im in SPSHA is the rate of occurrence of seismic sequences times the probability that a 416
sequence causes at least one exceedance of im. 417
Table 1. Annual rates of mainshocks for the seismic source model of Figure 1. 418 Magnitude 3.55-3.85 3.85-4.15 4.15-4.45 4.45-4.75 4.75-5.05 5.05-5.35 5.35-5.65 5.65-5.95 5.95-6.25 6.25-6.55 6.55-6.85 6.85-7.15 7.15-7.45 901 0 0 0.0153 0.0076 0.0166 0.0033 0.0021 0.0021 0 0 0 0 0 902 0 0 0.0534 0.0153 0.0166 0.0099 0 0.0064 0.0014 0 0 0 0 903 0 0 0.0992 0.0076 0.0099 0 0 0.0021 0 0 0 0 0 904 0 0 0.0305 0.0153 0 0 0.0042 0 0 0 0 0 0 905 0 0 0.1687 0.0904 0.0254 0.0106 0.0085 0.0071 0 0.0033 0.0022 0 0 906 0 0 0.0663 0.0482 0.0127 0.0021 0.0042 0 0 0.0011 0 0 0 907 0 0 0.0302 0.0301 0.0021 0 0.0021 0.0014 0 0 0 0 0 908 0 0 0.1069 0.0076 0.0166 0.0066 0.0021 0 0 0 0 0 0 909 0 0 0.0305 0.0076 0.0099 0.0066 0.0021 0 0 0 0 0 0 910 0 0 0.0611 0.0076 0 0.0066 0.0021 0.0064 0 0.0014 0 0 0 911 0 0 0.0305 0.0076 0.0099 0 0.0021 0 0 0 0 0 0 912 0 0 0.0482 0.0120 0.0106 0.0148 0.0021 0.0028 0.0012 0 0 0 0 913 0 0 0.1145 0.0602 0.0169 0.0042 0.0085 0.0014 0 0 0 0 0 914 0 0 0.0843 0.0663 0.0148 0.0085 0.0021 0.0057 0.0014 0 0 0 0 915 0 0 0.1832 0.0763 0.0398 0 0.0042 0.0042 0.0014 0.0014 0 0 0 916 0 0 0.0458 0.0305 0.0085 0.0042 0.0021 0 0 0 0 0 0 917 0 0 0.0542 0.0301 0.0114 0.0085 0.0106 0.0064 0.0012 0 0 0 0 918 0 0 0.1527 0.0229 0.0170 0.0057 0.0085 0.0064 0.0042 0.0014 0 0 0 919 0 0 0.1298 0.0534 0.0297 0.0106 0.0042 0.0071 0.0043 0.0025 0 0 0 920 0 0 0.1832 0.0687 0.0568 0.0085 0 0 0 0 0 0 0 921 0 0 0.1756 0.0840 0.0254 0.0085 0.0021 0.0028 0 0 0 0 0 922 0 0 0.0458 0.0229 0.0169 0.0042 0 0 0 0 0 0 0 923 0 0 0.4122 0.0992 0.0767 0.0227 0.0085 0.0106 0.0021 0.0057 0.0043 0.0014 0.0014 924 0 0 0.0687 0.0382 0.0372 0.0279 0.0140 0 0.0042 0 0.0017 0 0 925 0 0 0.0458 0.0153 0.0047 0 0 0 0 0.0033 0.0017 0 0 926 0 0 0.0305 0.0076 0.0186 0 0.0047 0 0 0 0 0 0 927 0 0 0.2150 0.0561 0.0512 0.0093 0.0047 0.0064 0.0021 0.0042 0.0066 0.0066 0 928 0 0 0.0154 0.0153 0.0186 0 0.0042 0.0021 0 0 0 0 0 929 0 0 0.2243 0.0374 0.0651 0.0186 0.0140 0.0140 0.0085 0.0021 0.0017 0.0066 0.0017 930 0 0 0.1028 0.0093 0.0047 0.0093 0.0093 0.0047 0.0021 0.0021 0.0017 0 0 931 0 0 0.0193 0.0192 0 0 0.0047 0 0 0 0 0.0021 0 932 0 0 0.0748 0.0187 0.0166 0.0033 0 0 0.0042 0 0 0 0 933 0 0 0.1145 0.0153 0.0132 0.0199 0.0066 0.0021 0.0021 0 0 0 0 934 0 0 0.0280 0.0001 0.0099 0.0033 0 0 0.0021 0 0 0 0 935 0 0 0.0534 0.0001 0.0166 0.0099 0.0042 0 0.0021 0 0.0023 0 0.0012 936 0.3359 0.0458 0.0382 0.0153 0.0132 0.0033 0 0 0 0 0 0 0 419
20
Table 2. Nationwide percentage and maximum increase of im of SPSHA with respect to PSHA. 420
PGA Sa(1s)
r
T [yr] 50 475 975 2475 50 475 975 2475
Ave. perc. diff. [%] 9.7 10.1 10.3 9.8 10.4 8.7 8.0 7.0 Max. perc. diff. [%] 16.4 22.3 25.6 27.9 16.2 16.7 16.6 14.8
Max. abs. diff. [g] 0.012 0.058 0.084 0.116 0.007 0.035 0.051 0.075 421
21 422
Figure 1. The seismic source zone model for Italy, according to the model of Meletti et al. (2008). 423
424
Figure 2. Maps of PGA: im on rock with four return periods of exceedance equal to: 50yr, 475yr, 975yr and 2475yr. Panels from (a) to (d) are computed via PSHA, (e) to 425
(h) are computed via SPSHA. 426
23 427
Figure 3. Maps of Sa
( )
1s : im on rock with four return periods of exceedance equal to: 50yr, 475yr, 975yr and 2475yr. Panels from (a) to (d) are computed via PSHA, (e) 428to (h) are computed via SPSHA. 429
24 431
Figure 4. Differences between SPSHA and PSHA in terms of im with 50yr, 475yr, 975yr and 2475yr return periods of exceedance on rock. Panels from (a) to (d) are 432
PGA, from (e) to (h) are Sa
( )
1s . 43325 434
Figure 5. Percentage increase from SPSHA with respect to PSHA in terms of im with 50yr, 475yr, 975yr and 2475yr return periods of exceedance on rock. Panels from 435
(a) to (d) are PGA, from (e) to (h) are Sa
( )
1s . 436437
Figure 6. Results of hazard analyses for L’Aquila: (a) location of the site and source zones contributing to its hazard; (b) hazard curves for PGA and Sa
( )
1s ; (c) hazard 438increase as a function of the exceedance rate of im; (d) UHS for 50yr, 475yr, 975yr and 2475yr; (e) hazard increase as a function of the spectral period and for fixed 439
return periods; (f) aftershock disaggregation for PGA and Sa
( )
1s . 44027 441
Figure 7. Results of hazard analyses for Milan: (a) location of the site and source zones contributing to its hazard; (b) hazard curves for PGA and Sa
( )
1s ; (c) hazard 442increase as a function of the exceeding rate of the im; (d) UHS for 50yr, 475yr, 975yr and 2475yr years; (e) hazard increase as a function of the spectral period and for 443
fixed return periods; (f) aftershock disaggregation for PGA and Sa