Dottorato di Ricerca in
Qualità degli Alimenti e Nutrizione umana
Coordinatore: Prof.ssa Annunziata GiangasperoTESI DI DOTTORATO
XXVIII Ciclo
EFFECTS ON GLYCOMETABOLIC AND FUNCTIONAL
PARAMETERS
OF LOW-GLYCAEMIC-INDEX PASTA INTAKE
IN PATIENTS WITH TYPE 2 DIABETES MELLITUS
Dottorando:
Dott. Caterina Ciliberti
Relatore:
Prof. Olga Lamacchia
Correlatore:
Prof. Donato Pastore
A mio Padre…
…e alla musica…un’altra me
Contents:
1. Introduction ... 4
2. Materials and methods ... 7
2.1 Production of functional pasta using non-conventional flours and traditional and non-traditional pasta-making methods ... 7
2.1.1 Raw materials ... 7
2.1.2 Pasta-making process ... 8
2.1.3 Pasta technological evaluation: disulphide bond analysis of einkorn and faba bean pasta ... 10
2.1.4 Pasta technological evaluation: in-vitro test for starch digestibility of fresh pasta ... 10
2.2 Assessment of glycaemic parameters: ... 11
2.2.1 Case study and methodology of einkorn pasta: ... 11
2.2.2 Case study and methodology for faba bean pasta: ... 13
2.2.3 Case study and methodology for fresh and dry durum wheat pasta: ... 13
2.2.3.1 Evaluation in acute of glycaemic index of selected pasta in healthy subjects: ... 14
2.2.3.2 In chronic evaluation of selected pasta in diabetic patients: ... 15
2.2.3.3 Clinical, nutritional and biohumoral assessment of diabetic patients recruited: ... 16
2.2.3.4 Periodic evaluation of clinical parameters of disease: ... 17
2.3 Statistical analysis: ... 18
3. Results... 19
3.1 Technological quality assessment of pasta ... 19
3.2 Assessment of glycaemic index in Triticum Monococcum pasta ... 22
3.2 In-vitro test for starch digestibility of fresh pasta results: ... 24
3.3 Assessment of glycaemic index in fresh and dry durum wheat pasta ... 25
3.4 In acute and chronic study of selected pasta ... 29
3.4.1 Evaluation in acute of glycaemic index for selected pasta in healthy subjects: ... 29
3.4.2 In chronic evaluation of selected pasta in diabetic patients ... 32
4. Discussion and Conclusion ... 37
Acknowledgements ... 41
1. Introduction
The incidence of type 2 diabetes mellitus (T2DM) is alarmingly on the increase, and is one of the main causes of cardio-renal disease (Fox et al., 2004). In T2DM, the massive exposure of the body to circulating glucose activates glycation processes, eventually leading to morpho-functional organ and system alterations. Furthermore, exposure to circulating glucose may also cause the growth of both intermediate carbonyl (involved in the development of advanced glycation products) and oxygen reactive species that may cause a variety of complications in the endothelial, cardiovascular and renal systems (Gerrits at al., 2009, 2008).
A typical situation occurring in T2DM is a glycaemic fluctuation, especially during the post-prandial period; it is therefore essential in a dietetic approach for a diabetic patient to consume foods with a low glycaemic index, leading to post-prandial reduction in glycaemia for the same amount of carbohydrate intake (Riccardi et al., 2008). Recent observations in this field have proven that such therapeutic and diet-related changes are the best way of achieving glycolipid control and a significant reduction in renal and cardiovascular complications (Giacco et al., 2012, Livesey et al., 2013). For the same reason, food producing positive and recognizable effects on a patient’s health and/or a modulation of physiological parameters, as well as improving the glyco-metabolic profile, can be defined as functional food.
The primary objective when managing patients with diabetes mellitus is to improve their state of health and metabolic status. In order to achieve this, it is crucial that they succeed in adhering to long-term modifications in their dietary habits, which helps them with weight loss and with the maintenance of body weight, followed by glycaemic control and keeping cardiovascular risk factors in check, so as to prevent the occurrence of micro- and macrovascular complications (Fox et al., 2004). Research now focuses on examining the changes that have occurred in the wake of the evolution in modern food science, progressing from classical concepts involving the prevention of deficiency diseases and overall nutritional inadequacy, to the promotion of a state of well-being and health and of reduction of disease risk. Science has thus seen a shift from the concept of providing an “adequate” food supply to one based on “functional” or “positive/optimal” nutrition, which is a new tool at our disposal, fostering mental and physical well-being and prevention of chronic diseases. The pursuit of a balanced diet and protective nutrition, aiming to enhance the individual’s physiological functions by preserving his/her welfare and reducing the risk of contracting diseases, is one of the fundamental needs among modern consumers, increasingly both interested in the potential benefits of foodstuffs and confident that food can make a direct contribution to one’s health (Mollet and Ronland, 2002).
Recent advances in science also support the hypothesis that diet, in addition to being nutritious and palatable, may represent a first line of defence and modulate various body functions and thus be
considered "functional" (ADI-AMD-SID, 2014). In such a context then, functional foods represent a meeting point between scientific research, technological innovation and a desire for well-being. Indeed, in the dietary approach to obese and/or diabetic patients, significant importance is given to foods with a low glycaemic index which, for a given amount of carbohydrate eaten or drunk, reduce the post-prandial glycaemic rise. Nowadays, the difference between the glycaemic indexes found in several foods produced by the food industry can be affected by several factors: viscous fibre and prebiotic content, a type of starch (amylose/amylopectin ratio or resistant starch) (Akerberg et al., 1998), a food’s physical structure, food transformations by technological processes and cooking process (Petitot et al., 2009). The starch found in most baked foods greatly affects the glycaemic index. When the starch is in an ordered shape (crystalline), it has a low glycaemic index value. By contrast, a higher glycaemic index value is observable when starch undergoes a gelatinization process (that occurs in an aqueous matrix at a temperature of between 50 and 70° C), and during which starch granules swell up to burst, releasing most of the starchy components (as starch indicator) into the water. The amylose/amylopectin ratio also significantly affects the gelatinization temperature (Bjorck et al., 2000). A higher amylose content will indeed correspond to a higher gelatinization temperature.
Another strategy for reducing food GI involves using specific technologies to modify starch digestibility, as in the case of parboiled rice. This technology consists in treating rice grains with high pressurized steam so as to form an outer layer of retrograded starch, a form known to be more resistant to amylase hydrolysis in the human intestine. Thus, plenty of evidence supports the notion that retrograded starch significantly reduces post-prandial glycaemic increases and therefore also its GI value. Pasta’s glycaemic index is 35-40% lower than that of white bread, because of the dough extrusion process in which the proteins in the dough are re-arranged into a water-insoluble protein network. Within the meshes of the protein network, the starch is incorporated in such a way as to make it resistant to intestinal amylase hydrolysis (Giacco et al., 2012). Currently, food technologists are focusing on researching new raw materials for functional pasta formulation that can satisfy the nutraceutical, organoleptic and sensorial charcateristics which a consumer generally uses to choose a product. In this new scientific context, the growing interest in Triticum monococcum and legume flours such as faba bean flour should be considered. Triticum monococcum, or einkorn, is an ancient cereal from the Triticum species, which conserves the original genetic blueprint (diploid species AA). The renewed interest in this type of crop is underpinned by growing public awareness regarding nutritional components, as well as by preliminary results suggesting that excellent flour composition may help prevent pathologies such as cancer, diabetes and chronic inflammatory disease. Triticum monococcum is richer in iron, zinc, copper, calcium, magnesium and antioxidants than modern soft wheats (Ciccoritti et al., 2014, Hidalgo and Brandolini, 2008a, 2008b), and its lipid content is also higher than modern wheat (Triticum aestivum and durum). In addition its fatty
acid profile is very interesting: einkorn has a lower content of saturated and higher levels of monounsaturated fatty acids. Triticum monococcum also contains much more protein (about 15%) than reported in soft (Triticum aestivum) and durum wheat (Triticum durum).
These proteins have great biological value, since gluten proteins make up only 5% of their weight. Triticum monococcum is more important because it contains two types of substance with a significant antioxidant effect: carotenoids and tocols (vitamin E). In Triticum monococcum, carotenoid content (principally lutein) is five to eight times higher than in modern wheats, while tocol content is about 60% higher. This higher lutein and tocol content in Triticum monococcum gives it higher antioxidant capacity than modern wheats (Hidalgo et al., 2006, Lachman et al., 2012). Legumes are an interesting source of proteins, fibre, vitamins and minerals. Legume proteins are relatively low in sulphur-containing amino acids, methionine, cysteine and tryptophan, but high in lysine. Furthermore, legumes have a higher amylose content than wheat and a lower amount of amylopectine, the highly digestible starch fraction. Consequently, legumes and cereals are nutritionally complementary: legume flours can partially substitute durum wheat semolina in pasta. This again provides an opportunity to use non-traditional raw materials to increase the nutritional quality of pasta (Brennan et al., 2003), enriching it with proteins, fibres, vitamins and minerals and sometimes also producing important structural changes in the dough, and lowering its glycaemic index (Petitot et al, 2010a, 2010b). Indeed, it has recently been demonstrated that fortification of pasta with 25% chickpea flour decreased GI in healthy volunteers (from 73.0% for durum pasta to 58.6% for chickpea pasta (Goñi and Valentín-Gamazo, 2003). It was also demonstrated that the introduction of 7.5% of insoluble pea fibres into pasta increased the susceptibility of starch to digestive enzymes, due to the disruption of the protein network entrapping the starch granules (Tudorica et al., 2002). Controlling the nutritional properties of pasta thus requires controlling its structure.
The main objectives of the study were: A) Optimization of formulation and process conditions for the production of functional pasta, B) Clinical assessment of functional pasta through an evaluation of the nutraceutical effects of functional product consumption on health and disease status by assessing changes in clinical and biohumoral indices.
Different types of pasta were analyzed during the first year of the PhD course: using both fibre-rich non-conventional flours (Triticum monococcum) and non-conventional flours with a high amylose content (faba bean). Previous evidence (Lamacchia et al., 2007) suggested a superiority (greater presence of slow-digestibility starch) of Triticum monococcum pasta over that of durum wheat pasta. However, these suggestions were the results of in-vitro observations, and did not involve assessments of important metabolic parameters such as glycaemic index, either in healthy subjects or high-risk DM subjects. Although in-vivo tests on faba bean pasta had shown excellent results in
terms of glycaemic index, the results of the panel tests performed on faba bean pasta failed to satisfy the organoleptic and sensorial characteristics which a consumer usually uses to choose a product. In addition, faba bean flours have high allergenic potential (favism), are costlier than durum wheat flours and caused several technological problems at the pilot plant during the pasta-making process; for all these reasons, faba bean pasta was rejected from the research project during the first year of the PhD. During the second year, low-glycaemic-index pasta, similar to conventional pasta, made with flours and water were analyzed and the effects of some technological conditions on pasta made were studied. In literature, Lamacchia at al., 2007, showed that high temperature creates covalent cross-links that reinforce the gluten network, improving starch grain entrapment, limiting their swelling and consequently also the gelatinization process and release in cooking water. Later, Petitot et al., 2010, showed that high temperatures create cross-links within the gluten network, leading to lower starch digestibility in vitro. A general in-vitro screening was carried out to determine resistant starch content in these types of pasta. An analysis of the glycaemic index of pasta by temperature was also carried out. During the second year of research, the effects of some technological changes applied to fresh pasta were analysed in order to assess whether, as reported in the literature, the higher proportion of resistant starch in the above pastas as observed in vitro might reflect the use of high temperatures and/ or refrigeration or drying of the pasta. At the end of the second year of research, simply adding a sterilization step to the fresh pasta production process produced better in-vivo results in healthy subjects than pasteurized dried pasta and other technological treatments in terms of reducing their glycaemic index, while it was found that drying, probably due to the degradation of the gluten lattice and the release of a higher amount of starch, was associated with a higher glycaemic index. For these reasons, fresh sterilized (FS) pasta was selected for chronic administration to diabetic patients in order to assess its nutraceutical effects on disease status by measuring the changes in biochemical and clinical indices during the third year of the PhD.
2. Materials and methods
2.1 Production of functional pasta using conventional flours and traditional and non-traditional pasta-making methods
2.1.1 Raw materials
For einkorn pasta:
- Durum wheat semolina at the De Vita mill (Casalnuovo Monterotaro, Foggia. Italy); - Triticum monococcum flour at the Sobrino mill (La Morra, Cuneo, Italy).
For faba bean pasta:
- Durum wheat semolina at the Casillo mill (Corato, Bari, Italy);
- Faba bean flour at the Bongiovanni mill (Villanova Mondovì, Cuneo, Italy). For Durum wheat fresh and dry pasta :
- Durum wheat semolina at the Casillo mill (Corato, Bari, Italy).
2.1.2 Pasta-making process
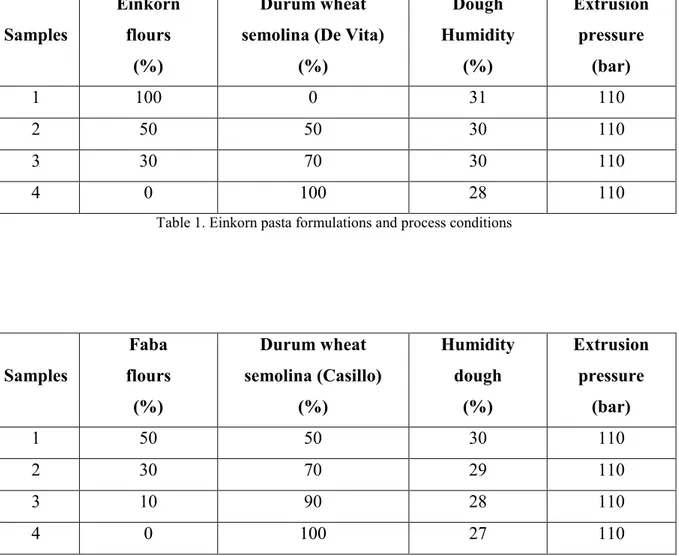
12 types of pasta with different formulations and processes were obtained, as reported in Tables 1, 2 and 3. A control, made up of 100% durum wheat semolina; three types in which 30%, 50%, 100% of durum wheat semolina was replaced with Triticum monococcum flours; 6 types in which 10%, 30%, 50% of durum wheat semolina was replaced with faba bean flour. The latter were divided into two subgroups: three types of pasta were made using traditional pasta-making processes and three types of pasta using innovative processes; for each subgroup of pasta, a 100% durum wheat semolina control was prepared.
Einkorn pasta production and drying of einkorn and fresh pasta were carried out at the Belladauna pasta factory, in the town of Candela, near Foggia, using a pilot plant (Italpast, Parma) equipped with a blender, extruder and shaker.
Faba bean pasta and fresh pasta production were carried out at the “Il Granaio” pasta factory, in the town of Cerignola, near Foggia, using a pilot plant.
All of the einkorn pasta types were made in maccheroncino size with bronze drawing, according to the formulations and process conditions shown in Table 1 for einkorn flour pasta einkorn pasta was submitted to a slow drying process.
All of the faba bean pasta and durum wheat fresh and dry pasta types were made in cavatello size with bronze drawing, according to the formulations shown in Table 2 and technological processes in Table 3, respectively.
Samples
Einkorn flours
(%)
Durum wheat semolina (De Vita)
(%) Dough Humidity (%) Extrusion pressure (bar) 1 100 0 31 110 2 50 50 30 110 3 30 70 30 110 4 0 100 28 110
Table 1. Einkorn pasta formulations and process conditions
Samples Faba flours (%) Durum wheat semolina (Casillo) (%) Humidity dough (%) Extrusion pressure (bar) 1 50 50 30 110 2 30 70 29 110 3 10 90 28 110 4 0 100 27 110
Table 2. Faba pasta formulations and process conditions
Samples Durum wheat semolina (Casillo) (%) Pasteurization process Sterilization process Packaging Refrigeration process Drying process F 100 - - - - - FP 100 100°C 15” - - - - FS 100 - 80°C 45’ 70%N - - FPS 100 100°C 15” 80°C 45’ 70%N - - FE 100 - - - - 55°C 12h FPRE 100 100°C 15” - - 4°C 55°C 12h FSE 100 - 80°C 45’ 70%N - 55°C 12h FPSRE 100 100°C 15” 80°C 45’ 70%N 4°C 55°C 12h
2.1.3 Pasta technological evaluation: disulphide bond analysis of einkorn and faba bean pasta Disulphide bond and free sulphydryl (SH) analyses were carried out to evaluate the qualitative characteristics of the gluten network in the new kinds of pasta. In fact, disulphide bonds are covalent bonds form between gluten proteins when durum wheat semolina or flour is mixed with water. These bonds allow the formation of the gluten network and the higher the number of disulphide bonds in a dough, the greater the gluten network and dough strength.
According to Ellman, 1959, for the free SH analysis, 30mg of flour or finely-minced pasta were resuspended in 1 ml of Reaction Buffer 1 containing 8M Urea, 10mM DTNB, 3mM EDTA, 0.2M Tris-HCl at pH 8, SdS 1%. The samples were incubated in the presence of N2 for 20 minutes, then centrifuged at 13,600g for 10 minutes and diluted 1:10 with Buffer A consisting in 8M Urea, 3mM EDTA, 0.2M Tris-HCl at pH 8, SdS 1%. Once the samples had been centrifuged at 13600g for 10 minutes, Absorbance was read at 412 nm using Buffer A as the blank.
For S-S + Total SH analysis a solution containing: 2M Guanidine thiocyanate, 50 mM Glycine, 100 mM NA2SO3, and 3mM EDTA was prepared and brought up to pH 9.5. This solution was diluted 1:100 with Stock NTSB—solution to obtain the working solution.
In order to prepare the NTSB stock solution, 100 mg of DTNB were resuspended in 10 mL of NA2SO3 1M and brought up to pH 7.5 (bright red color). The solution was then incubated at 38°C and insufflated with oxygen for 45 minutes (pale yellow colour). The solution was preserved at -20°C (where it can be kept for up to 1 year).
For analytical purposes, Buffer B, containing 8M Urea, 0.1M Na2SO3, 3mM EDTA, 0.2M Tris-HCl at pH 8, SdS 1% was added to the working solution at a 10mM concentration to form Reaction Buffer 2. Thirty mg of flours or finely-minced pasta were resuspended in 1 mL of Reaction Buffer 2, centrifuged at 13600g for 10 minutes and diluted 1.10 with Buffer B. Absorbance was read at 412 nm using Buffer B as the blank.
S-S content was calculated as the difference between: [Free SH] before and after the reduction of Disulphides with Na2SO3,while total cysteines were calculated using the following formula: [SH] + 2[S-S].
2.1.4 Pasta technological evaluation: in-vitro test for starch digestibility of fresh pasta
An in-vitro test for starch digestibility of four types of fresh pasta was performed using a Modified Englyst method (MEM) according to Englyst at al., 1992.
The pasta samples were cooked, using the cooking times indicated by the producer, and chopped. 0.5g of samples were weighed and added to 7.5ml of Buffer A containing 0.1M Na-Acetate at pH5.2 + 4mM CaCl2 at 37°C and incubated at 70°C; 5ml of Solution 1 were then added, containing: 4.2ml Pancreatin (2X compared to Englyst), 560U/ml Amyloglucosidase (AMG) 0.234ml (4X
compared to Englyst), 30000U/ml Invertase (0.0156ml, Buffer A 0.55ml). Finally, the solution was homogenized at 37°C by agitation. After 20 minutes, 25µl of hydrolysate (G20) were transferred into 1 ml of Ethanol 66% and stirred; after another 100 minutes, 25µl of hydrosylate (G120) were transferred into 1 ml of Ethanol 66% and stirred; then G20 and G120 were centrifuged at 1500g for 5 minutes. Glucose was measured using a Sigma kit.
G20 and G120 were calculated using the following formula: G20e120 (g/100g of sample)= (Asample * V * C* D/Astandard * W )*100.
The remaining sample was agitated after a 120-minute hydrolysis reaction and incubated at 100°C for 30 minutes, then agitated and cooled in ice for 15-20 minutes and added to 5ml of 7M KOH and mixed; then incubated at 0°C for 30 minutes in agitation.
At the end of the incubation process, 0.5ml of a solution containing 0.5M Acetic acid was transferred and 0.1ml of AMG (250U/ml) was added and incubated at 70°C for 45 minutes, then at 100°C for 10 minutes, cooled to ambient temperature and adding 20ml of H2O; the solution was then centrifuged at 1500g for 5 minutes and Total Glucose (TG) calculated using the following formula: TG(g/100g of sample)= (Asample * V * C* D/Astandard * W) *100
For the determination of RDS, SDS, RS and TS the following formula was used: TS(g/100g of sample)= (T G –FG) *0.9
RDS(g/100g of sample)=G20-FG)*0.9 SDS(g/100g of sample)= (G120-G20) *0.9
RS(g/100g of sample)= (TG – G120)*0.9 or TS-(RDS+SDS)
2.2 Assessment of glycaemic parameters:
Before undergoing any procedure, all recruits signed a written informed consent prior to participating in the study.
2.2.1 Case study and methodology of einkorn pasta: In this first case study, patients were divided into two cohorts: 1. High-risk T2DM subjects
Inclusion criteria:
- Single and double first-degree familiarity
- IGT (glycaemia 2 hours after load of glucose between 140-200 mg/dl) Exclusion criteria:
- Smokers - Alcohol abuse
- Coeliac subjects
- Cancer, drug addiction or anything else interfering with life expectancy or protocol adherence. 2. Healthy subjects (control subjects)
Inclusion criteria:
Unaffected T2DM subjects
-Familiarity free diabetes mellitus subjects -Normal weight (BMI <25 Kg/m2)
Exclusion criteria
- Pregnant women or those undergoing oestrogen-progestin treatment -Ongoing acute infections
-Ongoing progressive neoplastic disease -Drug abuse
-Renal disease (creatinine > 1.3mg/dl) -Smokers
-Alcohol abuse -Coeliac subjects
A cohort of 13 subjects including 7 healthy ones (6 female and 1 male) with an average age of 30.57 ± 11.77 years, average weight of 55.44 ± 8.12 Kg, and with an average BMI of 21.09 ±1.46 Kg/m2, and 6 high-risk T2DM subjects, of whom:
-DM Familiarity 4 subjects (3 female and 1 male) and
-IGT 2 female subjects with an average age of 41.33 ± 16.57 years, average weight of 60.83 ± 7.03 Kg and with an average BMI of 23.57 ± 3.16 Kg/m2. After fasting for at least 6 hours, subjects’ glycaemia was subsequently measured for 4 days using an Abbott Freestyle glucometer, at the end of fasting (at 0 minutes) and then at 30, 60, 90, 120 minutes by the administration respectively of white bread on the first day, 100% durum wheat pasta on the second day, 50% durum wheat and 50% Triticum monococcum on the third day and 100% Triticum monococcum on the fourth. The pasta was eaten totally plain to prevent any distorted glycaemia values after the measurement process.
Subjects performed tests at home, having provided the following information: - cooking time and salinity of einkorn pasta
- fasting at least 6 hours before einkorn pasta or white bread intake - size of einkorn pasta and white bread portions in grams
- totally plain einkorn pasta or white bread intake
The glycaemic index (GI) for the various types of pasta was calculated as the incremental area under the blood glucose response curve after consuming a 50g portion of the carbohydrates contained in these foods and expressed as a percentage of the incremental area under the glucose
response curve after the same subject consumed 50g of soft wheat bread. Glycaemic index (GI) means the percentage ratio of the glycaemic response after the consumption of a type of food compared to a standard food (white bread), consumed in isoglucidic amounts (Greenspan and Strewler, 2000).
2.2.2 Case study and methodology for faba bean pasta:
Although preliminary in-vivo tests on faba bean pasta had shown excellent results in terms of glycaemic index, the results of the panel tests performed on faba bean pasta failed to satisfy the organoleptic and sensorial characteristics which a consumer usually uses to choose a product In addition, faba bean flours have high allergenic potential (favism), are more expensive than durum wheat flours and caused several technological problems at the pilot plant during the pasta-making process; for all these reasons, faba bean pasta was rejected from the research project during the first year of the PhD.
2.2.3 Case study and methodology for fresh and dry durum wheat pasta:
In this second case study to assess the functional properties of fresh and dry pasta, two cohorts of healthy subjects were selected:
- for the four types of fresh pasta, 5 healthy subjects (4 female and 1 male) with an age range of 28.6±5.8 and normal weight (BMI 21.2±2.1 Kg/m2);
- for the four types of dry pasta, 6 healthy subjects (4 female and 2 male) with an age range of 29.3±5.5 and normal weight (BMI 21.8±2.5 Kg/m2).
Selection was perfomed in order to create a homogeneous group, with the following criteria: Inclusion criteria:
- Unaffected DMT2 subjects
- Subjects with no family history of diabetes
- Normal weight (BMI ≤ 24.9 Kg/m2)
- Normoglycaemic subjects
- Non-drug users Exclusion criteria:
- Pregnant women or those on oestrogen-progestin treatment
- Ongoing acute infections
- Previous or current neoplastic disease
- Drug abuse
- Renal disease (creatinine > 1.3mg/dl)
- Alcohol abuse
- Coeliac subjects
After fasting for at least 6 hours, subjects’ glycaemia was measured over the following 9 days using an Abbott Freestyle glucometer (CV intra-assay <3%): fasting (at 0 minutes) and then at 30, 60, 90, 120 minutes by the administration of white bread on the first day and by the administration of F,FP,FS,FPS fresh pasta and FE,FPRE,FSE,FPSRE dry pasta respectively on the other days.
The glycaemic index (GI) for the functional and control pastas was calculated as the incremental area under the blood glucose response curve after consuming a 50g portion of the carbohydrates contained in these foods and expressed as a percentage of the incremental area under the glucose response curve after the same subject consumed 50g of soft wheat bread. Glycaemic index (GI) means the percentage ratio of the glycaemic response after the consumption of a type of food compared to a standard food (white bread), consumed in isoglucidic amounts (96g portion).
Subjects performed tests at home having provided the following information:
- cooking time and salinity of pasta
- fasting at least 6 hours before fresh and dry pasta or white bread intake
- size of fresh and dry pasta and white bread portions in grams
- totally plain fresh/dry pasta/white bread intake
Glycaemic increase during the post-prandial period was used calculating an incremental area under glucose curve (AUC). Glycaemic index (GI) was calculated comparing in the percentage ratio the glycaemic response AUC after the consumption of eight types of pasta compared to the standard food AUC (white bread). Finally the averages between the AUC and GI values for the different types of pasta were compared (Greenspan and Strewler, 2000).
2.2.3.1 Evaluation in acute of glycaemic index of selected pasta in healthy subjects: In this final case study, two cohorts of patients were selected:
A cohort of 5 healthy subjects was selected (4 females and 1 male) in order to create a homogeneous group, with the following criteria:
Inclusion criteria:
- Unaffected DMT2 subjects - Normoglycaemic subjects
- Subjects with no family history of diabetes - Normal weight (BMI ≤ 24.9 Kg/m2)
- Non-drug users Exclusion criteria:
- Ongoing acute infections
- Previous or current neoplastic disease - Drug abuse
- Renal disease (creatinine > 1.3mg/dl) - Smokers
- Alcohol abuse - Coeliac subjects
On 3 different non-consecutive days, in the morning after fasting for 12 hours and after eating the same evening meal suggested by us, the healthy subjects gave venous blood samples to measure blood sugar (at 0-30-60-90-120 min) and insulin (at t=0 and 30 min) by the administration of, respectively: 100% fresh pasta (F) as control (no thermal treatments), 100% fresh, packaged and sterilized (at 80°C for 45’) pasta (FS) and white bread: “pancarrè Mulino Bianco” (standard food for calculating GI).
Tests were carried out at the Ospedali Riunite hospital refectory in Foggia, having previously given them information about:
- cooking times: 4 minutes for F pasta and 5 minutes for FS pasta
- portions of raw material in grams: 94g for both F and FS pasta and 96g for white bread - pasta to be eaten totally plain in order to prevent alterations during post-prandial glycaemia
Venous blood was promptly sent to the OORR analysis laboratory in Foggia and blood sugar and insulin levels were used to calculate two parameters:
The glycaemic index (GI) for the functional and control pastas was calculated as the incremental area under the blood glucose response curve after consuming a 50g portion of the carbohydrates contained in these foods and expressed as a percentage of the incremental area under the glucose response curve after the same subject consumed 50g of soft wheat bread. Glycaemic index (GI) means the percentage ratio of the glycaemic response after the consumption of a type of food compared to a standard food (white bread), consumed in isoglucidic amounts (96g portion) (Greenspan and Strewler, 2000).
Early Insulin Response was calculated using the insulinogenic index (II) as the ratio of: (insulin at t=30 – fasting insulin) / (glycaemia at t=30’ – fasting glycaemia) (Trahair et al., 2014).
2.2.3.2 In chronic evaluation of selected pasta in diabetic patients:
A cohort of 11 diabetic subjects was selected (5 females and 6 males), as follows: Inclusion criteria:
-DMT2 patients with a period of disease of between 3 and 15 years -Age range: 40-65
-BMI: 28-35 Kg/m2
-Oral hypoglycaemic and/or insulin-sensitizing therapy
-Moderate glycaemic compensation (HbA1c) occurring at least once in the last year (variation <0.3%) but HbA1c ≥7.5 and ≤ 8.5
Exclusion criteria:
- Type 1 diabetes mellitus
- Chronic use of glucocorticoids and antibiotics - Insulin therapy patients
- Incretin-mimetic therapy patients - Ongoing acute infections
- Smokers - Alcohol abuse - Celiac subjects
- Cancer, drug addiction or anything else interfering with life expectancy or protocol adherence - e-GFR < 30ml/min/1.73 m2
- Urinary macro-albumin patients (ACR ≥30 mg/mmol)
2.2.3.3 Clinical, nutritional and biohumoral assessment of diabetic patients recruited: Subjects were evaluated for baseline investigation related to:
-Anagraphic and anthropometric parameters: height, weight (using a Tanita Wunder BC-418 MA segmental body composition monitor, waist circumference at umbilical level).
-Haemodynamic parameters (blood pressure will be determined using a standardized blood pressure protocol).
All patients, after fasting for at least 12 hours, were also submitted to venous blood and urinalysis for the following concentrations:
-Insulin (measured with a Liaison Insulin 310360 commercial kit, using chemiluminescence technology)
-Glycaemia (measured via enzymatic UV test using the hexokinase method) -Hba1c (measured via high performance liquid chromatography, HPLC)
-Serum creatinine (measured using the Jaffè method with kinetic colorimetric test Beckman Coulter AU 2700 analyzers). Estimated GFR was then calculated via “Modification of Diet in Renal Disease (MDRD)” abbreviated formula.
-Total and HDL cholesterol, triglycerides using Beckman Coulter AU 2700 analyzers (LDL cholesterol was calculated with the Friedwald formula only when triglyceride concentrations were <4.48 mmol/l).
-Urinary albumin concentration (with kinetic nephelometry using Beckman Coulter IMMAGE® 800 analyzers) and urinary creatinine concentration (with Jaffè method with kinetic colorimetric test Beckman Coulter AU 2700 analyzers). The urinary albumin-to-creatinine ratio (ACR) was then calculated. Urinary micro albumin was diagnosed with ACR ≥ 2.5 and 3.5 mg/g (in males and females, respectively) but < 30 mg/g.
-Evaluation of tissue glycation index with skin autofluorescence measurement by Skin Reader (AGE Reader, DiagnOptics) (Gerrits et al., 2009, 2008).
After that, dietetic regimens using the various types of pasta were defined:
-Run-in: patients observed a run-in period of 60 days during which they maintained their current food habits. Over this period, all patients ate their usual pasta, produced industrially using traditional technology, with their usual frequency.
-Study phase: at the end of the run-in period, the 11 patients were divided into two groups (1 and 2). Each group was invited to consume both types of pasta using a cross-over protocol that consisted in replacing their usual pasta ration for the subsequent 3 months with control pasta F in one group and new functional pasta FS in another group. At the end of the first 3 months, after a wash-out period of 1 month, the two patient groups swapped pasta types for the subsequent 2 months.
At the beginning of the study phase, 2 of 11 diabetic patients recruited (both males) withdrew their consent to participate in the study. The reason for this choice was the organoleptic unacceptability of sterilized fresh pasta and the low consumption of fresh pasta in their food habits.
2.2.3.4 Periodic evaluation of clinical parameters of disease:
All recruits were submitted quarterly to clinical, anthropometric, biochemical and instrumental evaluations in order to highlight any changes compared to baseline. All patients were submitted to fasting, followed by venous blood and urinalysis for the following parameters, using previously reported methods:
- Insulin - Glycaemia - Hba1c
- Serum creatinine
- Total and HDL cholesterol, triglycerides - Urinary albumin and creatinine concentrations
Patient tissue glycation was measured using skin autofluorescence with Skin Reader (AGE Reader, DiagnOptics) (Gerrits et al., 2009, 2008).
2.3 Statistical analysis:
Statistical analysis was conducted using the SPSS13 program (SPSS Inc., Chicago, IL, USA). The results obtained were considered significant at p < 0.05. Statistical data for recruits were expressed as main ± standard deviation for continuous variables and percentage frequencies for categorical variables. The main values of glycaemia, insulinaemic AUC, glycaemic index and insulinogenic index were compared using the t-test for paired data.
3. Results
3.1 Technological quality assessment of pasta
3.1.1 Disulphide bonds analysis in pasta proteins
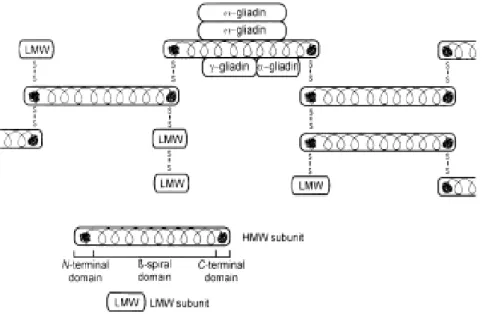
Disulphide bond and free SH analyses were carried out to evaluate the qualitative characteristics of the gluten network in the novel form of pasta. Disulphide bonds are covalent bonds that form between gluten proteins when durum wheat semolina or flour is mixed with water. These bonds help form the gluten network and the higher the number of disulphide bonds in a dough, the higher the strength of the gluten network and dough (Fig.1). A strong dough has excellent technological properties suitable for bread making and pasta-making processes. Even a pasta containing a high number of disulphide bonds is able to trap starch granules during the cooking phase, thus preventing hydration and gelatinization and losses in cooking water.
Figure 1. Gluten network structure. From the picture, it is clear that high-molecular-weight (HMW) and low-molecular-weight (LMW) polymer proteins are linked by disulphide bonds, thus making a real network.
Tables 4, 5 and 6 show the values, in µmol/grams of cysteines, S-S and total free SH in flours and composite pasta based on einkorn, faba and faba with application of the new pasta-making process, respectively. Durum wheat semolina is the sample, alongside 100% durum wheat pasta, with the highest content in total cysteines but above all in disulphide bonds. Total cysteine and disulphide bond content decreased significantly from 100% durum wheat flour/pasta to the different types of composite pasta. However, the decrease in disulphide content in the various types of pasta differs according to the type of flour used, to the percentage of flour added to them and to the pasta-making process. Therefore, disulphide bond values for einkorn composite pasta (50% and 70%-30% durum
wheat-einkorn, respectively), are intermediate between those of durum wheat pasta and those of 100% Triticum monococcum. Furthermore, in both composite pastas, the presence of durum wheat semolina significantly increases (by about 7%) the number of disulphide bonds compared to pasta made with only einkorn flour, possibly improving the gluten network structure. The decrease in the number of disulphide bonds, moving from 100% durum wheat pasta to composite faba/durum wheat pasta, is however significantly higher (7% -43%) compared to the pasta types made from einkorn (5%-11%), suggesting that a better gluten network forms in the latter. This can be simply explained by the fact that faba is not a grain such as Triticum monococcum and also contains a lower number of cysteine residues. However, the disulphide bond decrease is more evident in the composite faba pasta when the innovative pasta-making process is applied.
While the disulphide bond decrease in composite pasta in Table 5 reaches a maximum of 24.56% (with 50% faba - 50% durum wheat), it doubles in pasta, for a maximum of 43.39% (with 50% faba - 50% durum wheat). Samples SH-Total µmol/g prot S-S Total µmol/g prot Total Cysteine µmol/g prot
Durum wheat flour 90.679 ± 1.27Aa 80.064 ± 1.71Aa 250.807 ± 4.70A
Triticum Monococcum flours 78.630 ± 0.77Bb 69.382 ± 1.13Bb 217.395 ± 2.75B
100% Durum wheat pasta 87.802 ± 0.94c 77.378 ± 1.23Aa 242.558 ± 3.39A 100% Triticum monococcum
pasta 78.316 ± 1.40b 68.181 ± 1.02Bb 214.678 ± 3.31B 50% Durum wheat-50%
Triticum monococcum Pasta 84.249 ± 1.09d 73.898 ± 1.77c 232.045 ± 4.60C 70% Durum wheat-30%
Triticum monococcum Pasta 83.891 ± 0.63d 73.944 ± 1.22c 231.779 ± 2.91C
A,B,C,D,E,F =P<0.001 c,d=P< 0.05
Table 4. Effect of substituting durum wheat with increasing percentages of Triticum monococcum flours on SH and S-S protein in composite pasta.
These data suggest that a gluten network forms and becomes weaker on increasing the percentage of faba flour added during the pasta preparation process and with the use of the innovative
pasta-making process. If this were so, alongside the reduction in disulphide bonds, we would expect to see a corresponding increase in free cysteine residues. Unexpectedly, however, this was not found, as the decrease in disulphide bonds in the composite pasta was matched by an equally significant and proportional decrease in cysteine residues. This finding can be explained if we consider that cysteine residues may form other types of different covalent bonds apart from disulphide bonds (Lamacchia et al., 2011, Pena et al., 2006).
In addition, peroxidases (POX) in durum wheat semolina and semolina can generate free radicals that cause the formation of dityrosine bonds, of little importance in the structure of the gluten network (Lamacchia et al., 2010a) during dough formation, but very important in its structure during drying cycles in pasta-making (Lamacchia et al,, 2010b, Michon et al., 1999). This enzyme-activated oxidative process occurs through the following mechanism (Harman et al., 1984, Takasaki et al., 2005):
POX + H2O2 POX-Compound I (PCI) + H2O (I)
PC I + R-Y PC II + R-Y˙ (II)
2 R-Y˙ R-Y-Y-R (III)
In the same way, -SH and S-S can generate free radicals from peroxidases (Koh et al., 1996, Schaich and Rebello, 1999) according to the following mechanism:
POX + H2O2 PC I + H2O (IV)
PC I + R-SH PC II + R-S˙ (V)
The latter reactions became important considering the high cysteine content in wheat and the diminution of the total SH concentration.
The presence of tyrosyl and thiyl free radicals could suggest they might combine to form thiyl-tyrosyl bonds (S-Y) through the following reactions:
RS˙ + R-tyr˙ RS-tyr-R (VI)
R-S˙ + 2R-tyr˙ + R-S-S-R 2 R-S-tyr-R + RSH (VII)
The higher stability and shorter length of the S-Y bond compared to the S-S, the different electronegativity of S and carbon in ortho to the hydroxyl group of Tyr and the total SH concentration can favour the above schematized reactions by moving the equilibria to the left. At this point, we can hypothesize that reaction VI could occur in composite pasta containing faba bean already at 10%. This hypothesis was supported by the findings by Takasaki and Kawakishi, 1997, 2000 who reported the formation of a new cross-linker, 5-S-cysteinyl-3,4-dihydroxyphenylalanine, in gluten.
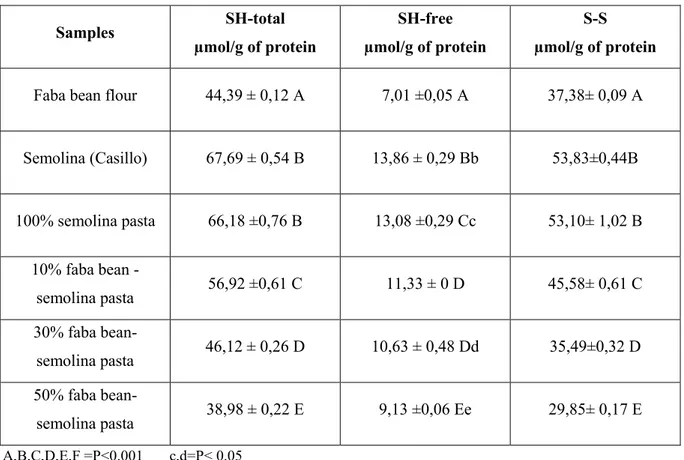
22 Samples SH-total µmol/g of protein SH-free µmol/g of protein S-S µmol/g of protein
Faba bean flour 44,39 ± 0,12 A 7,01 ±0,05 A 37,38± 0,09 A
Semolina (Casillo) 67,69 ± 0,54 B 13,86 ± 0,29 Bb 53,83±0,44B 100% semolina pasta 66,18 ±0,76 B 13,08 ±0,29 Cc 53,10± 1,02 B 10% faba bean -semolina pasta 56,92 ±0,61 C 11,33 ± 0 D 45,58± 0,61 C 30% faba bean-semolina pasta 46,12 ± 0,26 D 10,63 ± 0,48 Dd 35,49±0,32 D 50% faba bean-semolina pasta 38,98 ± 0,22 E 9,13 ±0,06 Ee 29,85± 0,17 E A,B,C,D,E,F =P<0.001 c,d=P< 0.05
Table 5. Effect of replacing durum wheat semolina with increasing amounts of Faba Bean flour on SH and S-S pasta proteins, using traditional pasta-making process.
Samples SH-total µmol/g of protein SH-free µmol/g of protein S-S µmol/g of protein
Faba bean flour
44,39 ±0,12A 7,00±0,04A 37,38± 0,09 A
Semolina (De Vita) 75,01 ±0,9 B 14,31±00,48Bc 60,70± 0,50 B 100% semolina pasta 74,45 ±0,83 B 16,71 ±0,92d 57,74 ± 0,53 C 10% faba bean -semolina pasta 67,74 ±0,61 C 14,35 ±0,26 Cc 53,39 ±0,77 D 30% faba bean-semolina pasta 58,08 ±0,44 D 11,71 ±0,38 E 46,37 ±0,73 E 50% faba bean-semolina pasta 53,15 ±0,49 E 9,41 ±0,28 F 43,73 ±0,21 F A,B,C,D,E,F =P<0.001 c,d=P< 0.05
Table 6. Effect of replacing durum wheat semolina with increasing amounts of faba bean flours on SH and S-S pasta proteins, using innovative pasta-making processes.
3.2 Assessment of glycaemic index in Triticum Monococcum pasta
Einkorn pasta was chosen for an initial screening on the assessment of the glycaemic index due both to its good gluten network and its high percentage of fibre.
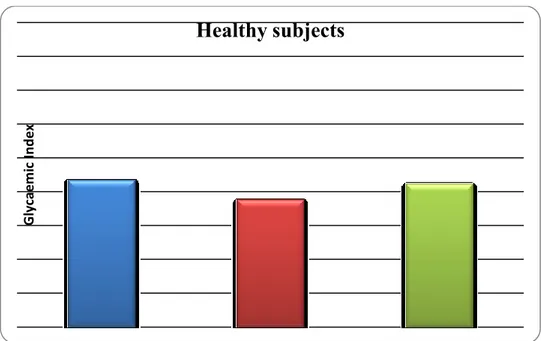
In healthy subjects, we found no significant differences between the GI after the administration of 100% durum wheat pasta and that of 100% einkorn pasta (87,0 ± 31,0 vs 75,43 ± 37,7, p = 0,137) and 50% durum wheat - 50 % einkorn pasta (87,0 ± 31,0 vs 84,8 ± 42,5, p = 0,736) (Fig 2a) respectively.
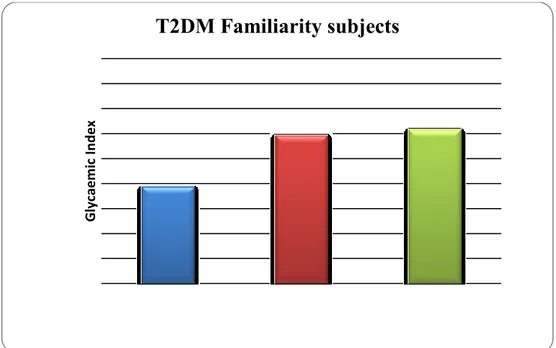
On the other hand, in subjects with T2DM familiarity, 100% durum wheat pasta showed lower GI than either 100% einkorn pasta (77,63 ± 23,78 vs 118,91 ± 56,40, p = 0,235) or 50% einkorn – 50% durum wheat pasta (77,63 ± 23,78 vs 123,61 ± 40,15, p = 0,331) (Fig 2b).
In IGT subjects, glycaemic index for 100% durum wheat pasta was significantly lower than for 100% einkorn pasta (60,11 ± 15,18 vs 77,42 ± 14,21; p = 0,025) and also lower, although not statistically significant, than 50% durum wheat pasta- 50% einkorn (60,11 ± 15,18 vs 75,19 ± 30,01; p = 0,387). By contrast, there were not so many differences between the glycaemic index of 100% einkorn pasta and 50% durum wheat 50% enikorn pasta (77,42 ± 14,21vs 75,19 ± 30,01; p = 0,875) (Fig 2c).
Figure 2 (a). Differences in GI values among different types of pasta consumed by healthy subjects
Gl ycae m ic Ind ex
Healthy subjects
Figure 2 (b). Differences in GI values among different types of pasta consumed by T2DM familiarity subjects
Figure 2 (c). Differences in GI values among different types of pasta consumed by IGT subjects
3.2 In-vitro test for starch digestibility of fresh pasta results:
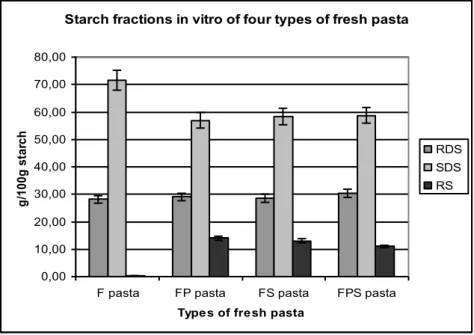
The in-vitro starch digestibility tests, carried out at the Bioagromed laboratory during the three-month period of the 2nd year, provided raw data on the RS (resistant starch fraction) content of the four types of fresh pasta analyzed. Results in terms of the RS ratio, expressed in grams per 100g of starch, showed higher RS content for FS and FP pasta than for the control (F) (Fig. 3)
Gl yc ae m ic In d e x
T2DM Familiarity subjects
Gl ycae m ic Ind exIGT subjects
Figure 3. Different starch fractions (Rapidly Digestible starch RDS, Slowly Digestible Starch SDS and Resistant starch RS) obtained by in-vitro starch digestibility of different types of fresh pasta using MEM (Modified Englyst Method)
3.3 Assessment of glycaemic index in fresh and dry durum wheat pasta
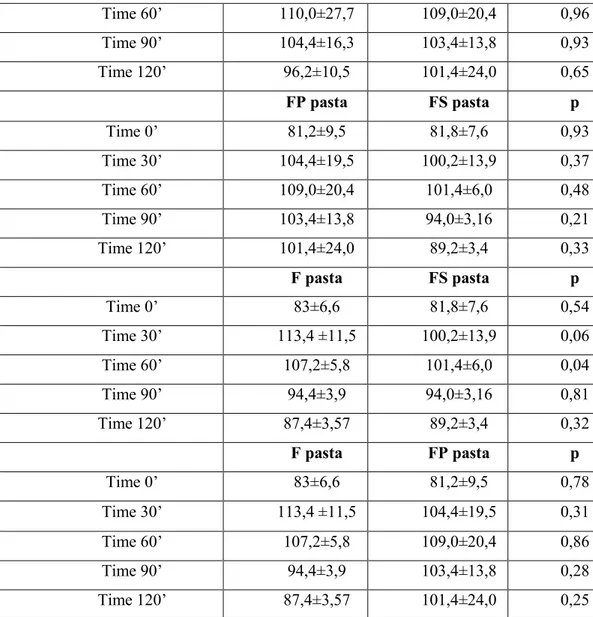
In healthy subjects, comparing the glycaemic responses after intake of different types of fresh pasta (F,FP,FS,FPS), showed lower average GI after the intake of FS pasta than all types of fresh pasta and overall than F pasta (control) at 30 and 60 minutes (respectively p=0.06, p=0.04) (Table 7)
Mean glycaemia ± DS mg/dl FS pasta FPS pasta p
Time 0’ 81,8±7,6 79,8±8,4 0,55 Time 30’ 100,2±13,9 99,8±17,8 0,92 Time 60’ 101,4±6,0 110,0±27,7 0,56 Time 90’ 94,0±3,16 104,4±16,3 0,20 Time 120’ 89,2±3,4 96,2±10,5 0,22 F pasta FPS pasta p Time 0’ 83±6,6 79,8±8,4 0,14 Time 30’ 113,4±11,5 99,8±17,8 0,19 Time 60’ 107,2±5,8 110,0±27,7 0,85 Time 90’ 94,4±3,9 104,4±16,3 0,15 Time 120’ 87,4±3,57 96,2±10,5 0,16 FP pasta FS pasta p Time 0’ 79,8±8,4 81,2±9,5 0,81 Time 30’ 99,8±17,8 104,4±19,5 0,33
Starch fractions in vitro of four types of fresh pasta
0,00 10,00 20,00 30,00 40,00 50,00 60,00 70,00 80,00
F pasta FP pasta FS pasta FPS pasta
Types of fresh pasta
g /1 00 g s ta rc h RDS SDS RS
Time 60’ 110,0±27,7 109,0±20,4 0,96 Time 90’ 104,4±16,3 103,4±13,8 0,93 Time 120’ 96,2±10,5 101,4±24,0 0,65 FP pasta FS pasta p Time 0’ 81,2±9,5 81,8±7,6 0,93 Time 30’ 104,4±19,5 100,2±13,9 0,37 Time 60’ 109,0±20,4 101,4±6,0 0,48 Time 90’ 103,4±13,8 94,0±3,16 0,21 Time 120’ 101,4±24,0 89,2±3,4 0,33 F pasta FS pasta p Time 0’ 83±6,6 81,8±7,6 0,54 Time 30’ 113,4±11,5 100,2±13,9 0,06 Time 60’ 107,2±5,8 101,4±6,0 0,04 Time 90’ 94,4±3,9 94,0±3,16 0,81 Time 120’ 87,4±3,57 89,2±3,4 0,32 F pasta FP pasta p Time 0’ 83±6,6 81,2±9,5 0,78 Time 30’ 113,4±11,5 104,4±19,5 0,31 Time 60’ 107,2±5,8 109,0±20,4 0,86 Time 90’ 94,4±3,9 103,4±13,8 0,28 Time 120’ 87,4±3,57 101,4±24,0 0,25
Table 7. Comparison of mean glycaemia in healthy subjects after the consumption of 4 types of fresh pasta
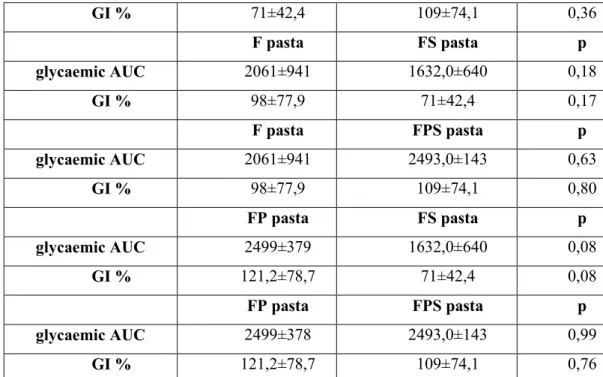
The mean AUC observed in response to the consumption of FS pasta was lower than that after intake of FP pasta, showing a tendency to significance (1632.0±640.7 mg x min/dl vs 2499±378.6mg x min/dl, p=0.08) ( Table 8).
In the other comparisons, no significant differences were detected even though FS pasta showed a better glycaemic response in terms of AUC than the other types of fresh pasta.
Results showed a lower GI for FS pasta than for the other types of fresh pasta, with a tendency to significance in the comparison with FP pasta (71.0± 42.4 vs 121.2± 78.7; p= 0.08) (Table 8).
F pasta FP pasta p
glycaemic AUC 2061±941 2499±378,6 0,36
GI % 98±77,9 121,2±78,7 0,25
FS pasta FPS pasta p glycaemic AUC 1632,0±640 2493,0±143 0,33
GI % 71±42,4 109±74,1 0,36 F pasta FS pasta p glycaemic AUC 2061±941 1632,0±640 0,18 GI % 98±77,9 71±42,4 0,17 F pasta FPS pasta p glycaemic AUC 2061±941 2493,0±143 0,63 GI % 98±77,9 109±74,1 0,80 FP pasta FS pasta p glycaemic AUC 2499±379 1632,0±640 0,08 GI % 121,2±78,7 71±42,4 0,08 FP pasta FPS pasta p glycaemic AUC 2499±378 2493,0±143 0,99 GI % 121,2±78,7 109±74,1 0,76
Table 8. Comparison between GI and AUC of healthy subjects after the consumption of 4 types of fresh pasta
In healthy subjects, comparing the glycaemic responses after intake of different types of dry pasta (FE,FPRE,FSE,FPSRE), showed lower average glycaemic values after the intake of FPRE pasta than all types of dry pasta and overall both than FSE pasta, with a higher statistical significance at 60’ after its administration (p = 0.002), and than FPSRE pasta with a statistical significance at 120’ after its administration (p=0.012) (Table 9).
Regarding comparison between the AUC and GI for different types of dry pasta, no significance was detected, but our results, in all tests show that drying worsens the glycaemic index (Table 9).
Mean glycaemia ±
DS mg/dl FE pasta FPSRE pasta p
Time 0’ 80±5,50 79±10,5 0.783 Time 30’ 107±18,3 109±18,9 0.625 Time 60’ 114±6,01 112±8,61 0.558 Time 90’ 99±6,90 103±7,91 0.191 Time 120’ 89±4,40 91±5,61 0.537 glycaemic AUC 2517±618 2747±810 0.460 GI % 116±720 125±86,7 0.582 Mean glycaemia ±
DS mg/dl FSE pasta FPRE pasta p
Time 0’ 81±10,9 78±7,60 0,615
Time 30’ 101±16,0 108±13,7 0.376
Time 90’ 107±13,9 97±9,60 0.120
Time 120’ 94±12,2 84±7,80 0,112
glycaemic AUC 2682±109 2480±676 0,738
GI % 110±79,6 118±88,8 0.813
Mean glycaemia ±
DS mg/dl FE pasta FSE pasta p
Time 0’ 80±5,50 81±10,9 0.786 Time 30’ 107±18,3 101±16,0 0.094 Time 60’ 114±6,01 120±7,70 0.178 Time 90’ 99±6,92 107±13,9 0.112 Time 120’ 89±4,40 94±12,2 0.362 glycaemic AUC 2517±618 2682±109 0.770 GI % 116±720 110±79,6 0.791 Mean glycaemia ±
DS mg/dl FE pasta FPRE pasta p
Time 0’ 80±5,50 78±7,60 0.786 Time 30’ 107±18,3 108±13,7 0.876 Time 60’ 114±6,01 108±9,70 0.095 Time 90’ 99±6,90 97±9,62 0.519 Time 120’ 89±4,40 84±7,86 0.166 glycaemic AUC 2517±618 2480±676 0.924 GI % 116±720 118±88,8 0.914 Mean glycaemia ±
DS mg/dl FPSRE pasta FPRE pasta p
Time 0’ 79±10,5 78±7,60 0.830 Time 30’ 109±18,9 108±13,0 0.869 Time 60’ 112±8,60 108±9,70 0.555 Time 90’ 103±7,90 97±9,60 0.176 Time 120’ 91±5,60 84±7,80 0.012 glycaemic AUC 2747±810 2480±676 0.602 GI % 125±86,7 118±88,0 0.764 Mean glycaemia ±
DS mg/dl FPSRE pasta FSE pasta p
Time 0’ 79±10,5 81±10,9 0.319
Time 30’ 109±18,9 101±16,0 0.104
Time 60’ 112±8,60 120±7,70 0.137
Time 120’ 91±5,60 94±12,2 0.571
glycaemic AUC 2747±810 2682±109 0.858
GI % 125±86,7 110±79,6 0.349
Table 9. Comparison between mean glycaemia, AUC and GI after the administration of 4 types of dry pasta
3.4 In acute and chronic study of selected pasta
3.4.1 Evaluation in acute of glycaemic index for selected pasta in healthy subjects:
Anthropometric parameters of healthy subjects recruited for an acute evaluation study are reported in Table 10. The recruits had an average age of 24 ±2 years, a mean BMI of 23.8±4.4 kg/m² and a mean weight of 69.3 ±14.1 kg.
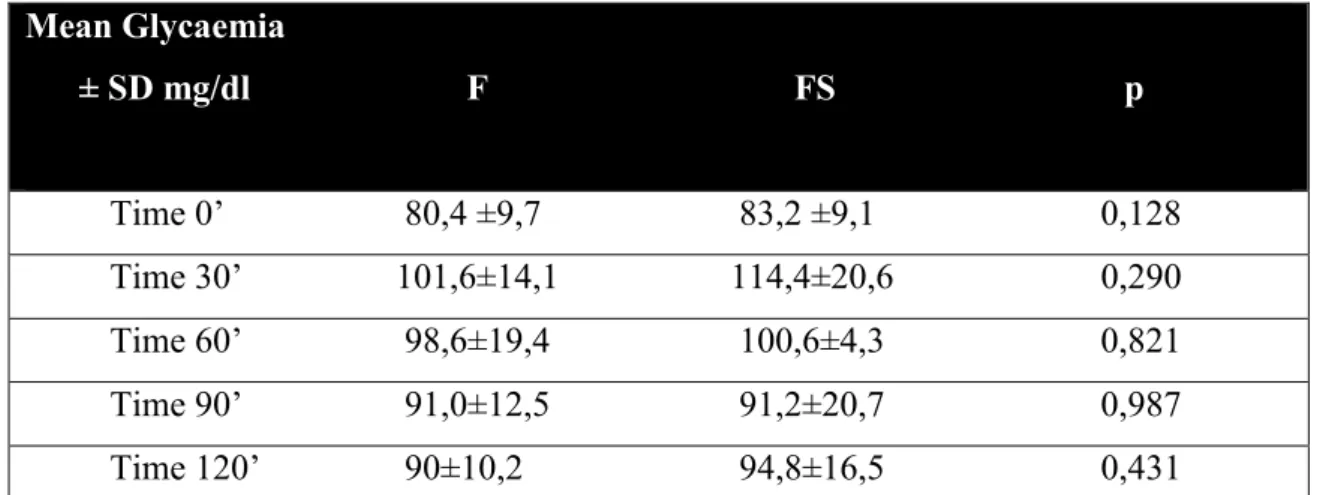
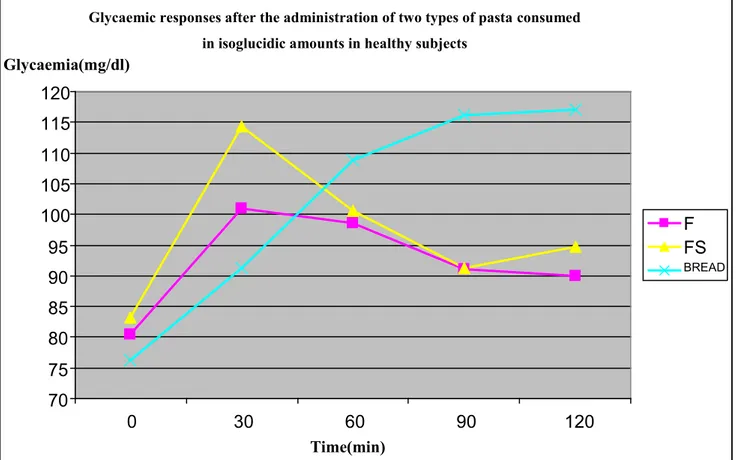
Mean glycaemia in healthy subjects, during fasting and after the administration of both types of pasta (F and FS) are reported in Table 11 and Fig.4.
Mean Glycaemia ± SD mg/dl F FS p Time 0’ 80,4 ±9,7 83,2 ±9,1 0,128 Time 30’ 101,6±14,1 114,4±20,6 0,290 Time 60’ 98,6±19,4 100,6±4,3 0,821 Time 90’ 91,0±12,5 91,2±20,7 0,987 Time 120’ 90±10,2 94,8±16,5 0,431
Table 11. Comparison of mean glycaemia levels after the administration of both types of pasta in healthy subjects
Anthropometric parameters Mean ± SD
Age (years) 24±2
Weight (Kg) 69,3±14,1
BMI (Kg/m²) 23,8±4,4
Figure 4. Glycaemic responses after the administration of both types of pasta consumed in isoglucidic amounts in healthy subjects
Comparing glycaemic responses for paired data after the administration of both types of pasta (F and FS), the averages showed superimposable mean glycaemia values throughout the testing period (Table 11, Fig. 4).
Figures 5 and 6 respectively report the glycaemic index (GI) and insulinogenic index (I.I.) for both types of pasta
Glycaemic responses after the administration of two types of pasta consumed in isoglucidic amounts in healthy subjects
70 75 80 85 90 95 100 105 110 115 120 0 30 60 90 120 Time(min) Glycaemia(mg/dl) F FS BREAD
Figure 5. Comparison of glycaemic index (GI) for both types of pasta in healthy subjects
Figure 6. Comparison of insulinogenic index (II) for both types of pasta in healthy subjects 0 0 20 0.5 40 1 60 1.5 80 2 100 2.5 F F FS FS
GI
II
0,40 0,32 Healthy subjects F FS p G.I. (%) 71,1±77,7 98,1±72,7 0,329 I.I. (µUI/ml) 1,02±1,2 1,9±1,6 0,407 Insulinaemia AUC (µU/ml/min) 1666±874,5 2085±650,9 0,192Tab 12. Comparison between glycaemic index, insulinogenic index and insulinaemia AUC in healthy subjects
Glycaemic index mean values were lower after the intake of F pasta than FS pasta but without statistical significance (p=0.329) (Fig.5 Table 12).
Insulinogenic index mean values were also lower after the intake of F pasta than FS pasta, without statistical significance (p= 0.407)(Fig. 6, Tab 12).
Insulinaemia AUC mean values observed in response to pasta consumption fell more after the intake of F pasta (1666 ± 874.5 µU/ml/min) than FS pasta (2085 ± 650.9 µU/ml/min) but without showing a tendency to significance (p=0.192) (Table 12).
3.4.2 In chronic evaluation of selected pasta in diabetic patients
Personal data, anthropometric and haemodynamic parameters at baseline of diabetic subjects recruited for chronic evaluation are reported in Table 13. The recruits had a mean age of 63.5±6.8 years, mean BMI of 30.5±7.4kg/m² and mean weight of 82.7±13.1kg.
Personal, Anthropometric and Haemodynamic parameters at baseline Mean ± SD
Age (years) 63,5±6,8 Weight (Kg) 82,7±13,1 BMI (Kg/m²) 30,5±7,4 CV (cm) 96,8±12,3 CF (cm) 102,4±14,2 CV/CF (cm) 0,94±0,04 FM (Kg) 27,6±14,2 FM (%) 31,9±13,9 FFM (Kg) 14,7±2,1
The 9 diabetic patients recruited for chronic evaluation of the two types of pasta were divided into two groups:
-Group 1: 4 subjects -Group 2: 5 subjects
Each group was invited to consume two types of pasta, using a cross-over protocol:
-Study phase 1 (3 months) : Group 1 consumed control pasta F and group 2 consumed new functional pasta FS
-Study phase 2 (3 months): Group 1 consumed new functional pasta FS and group 2 consumed control pasta F
Table 14 reports a comparison of mean anthropometric and clinical values for Group 1 between baseline and study phase 1.
FFM (%) 18,2±3,7
PAS (mmHg) 123,8±4,8
PAD (mmHg) 86,6±8,2
FC (bpm) 68,2±7
Table 13. Personal, Anthropometric and Haemodynamic parameters of diabetic patients at baseline (n=9: 5F/4M)
At the end of study phase 1, as regards anthropometric parameters, the data showed a statistically significant reduction in weight (p=0.05) and BMI (p=0.009) while waist circumference displayed a tendency to significance (p=0.08). As for clinical parameters, the data showed a statistically significant reduction in fasting insulin (p=0.04). Finally, the data showed a tendency to significance for AGE. Regarding the other clinical parameters, no significant differences were detected.
The same subjects were compared to detect the differences between wash-out period (time between the end by the administration of pasta F and the beginning of the administration of FS pasta) and the end of study phase 2 with FS pasta (Table 15).
Group 1 (FS) WASH-OUT STUDY PHASE 2 p
Weight (Kg) 87,0±17,0 86,2±17,1 0,156
Body mass index (Kg/m2) 31,2±9,6 32,0±10,1 0,536
Waist Circumference at umbilicus (cm)
100,2±16,0 100,2±16,1 1
Fat mass (Kg) 27,8±19,3 28,0±19,0 0,77
Group 1 (F) BASELINE STUDY PHASE 1 p
Weight (Kg) 88,1±17,0 87,0±17,0 0,05
Body mass index (Kg/m2) 31±9,6 31,2±9,6 0,009
Waist Circumference at umbilicus (cm) 101±16,5 100,2±16,0 0,08 Fat mass (Kg) 28,1±20,2 27,8±19,3 0,66 Glycaemia(mg/dl) 148,0±34,9 130,7±28,4 0,205 Insulin (µUI/ml) 11,3±3,3 9,2±4,0 0,04 HbA1c (%) 7,2±0,5 7,0±0,5 0,188 Total cholesterol (mg/dl) 165±52,1 151±40,9 0,105 HDL Cholesterol (mg/dl) 44,2±4,5 43,0±5,5 0,278 LDL Cholesterol (mg/dl) 101,6±46,1 92,2±32,8 0,326 Triglycerides (mg/dl) 95,7±25,7 79±19,4 0,13 ACR (mg/g) 25,1±33,9 15,8±9,8 0,55 PCR (mg/L) 4,1±5,5 3,4±5,5 0,132 AGE 3,4±0,9 2,7±0,5 0,06
Table 14. Comparison of anthropometric and clinical parameters between baseline (T’ 0) and at the end of study phase 1 (T’ +1) in group 1 after the administration of pasta F
In this comparison of anthropometric and clinical parameters, no significant differences were detected.
Table 16. Comparison of anthropometric and clinical parameters between baseline (T’ 0) and the end of study phase 1 (T’ +1) in Group 2 after the administration of FS pasta
Glycaemia(mg/dl) 130,7±28,4 121,5±22,5 0,179 Insulin (µUI/ml) 9,2±4,0 9,5±4,8 0,837 HbA1c (%) 7,0±0,5 7,0±0,6 0,638 Total cholesterol (mg/dl) 151,0±40,9 141,7±41,8 0,296 HDL Cholesterol (mg/dl) 43±5,5 39,7±5,6 0,109 LDL Cholesterol (mg/dl) 92,2±32,8 85,5±34,4 0,263 Triglycerides (mg/dl) 79±19 82,5±26,7 0,77 ACR (mg/g) 15,8±9,8 17,3±9,1 0,694 PCR (mg/L) 3,4±5,5 4,9±4,2 0,466 AGE 2,7±0,5 2,7±0,6 0,391
Table 15. Comparison of anthropometric and clinical parameters between wash-out (T’ +2) and the end of study phase 2 (T’ +3) after the administration of FS pasta to Group 1
Group 2 (FS) BASELINE STUDY PHASE 1 p
Weight (Kg) 78,4±8,7 78,0±8,7 0,67
Body mass index (Kg/m2) 29,7±6,3 29,4±5,6 0,52
Waist Circumference at umbilicus (cm) 93,2±7,8 93,6±7,9 0,58 Fat mass (Kg) 27,3±10,2 25,8±10,0 0,06 Glycaemia(mg/dl) 130,8±24,6 152,8±32,8 0,16 Insulin (µUI/ml) 14,2±14,3 8,5±5 0,24 HbA1c (%) 7,9±0,7 7,6±0,6 0,04 Total cholesterol (mg/dl) 201,6±12,8 190,4±22,3 0,16 HDL Cholesterol (mg/dl) 59,4±11,8 57,2±7,3 0,42 LDL Cholesterol (mg/dl) 117,3±18,4 99,6±24,9 0,08 Triglycerides (mg/dl) 124,2±69,2 168,0±79,9 0,08 ACR (mg/g) 77,4±92,3 46,9±85,8 0,50 PCR (mg/L) 8,4±10,5 3,9±3,8 0,21 AGE 2,9±0,3 2,7±0,4 0,29
In Group 2, the data showed a significant reduction in glycate haemoglobin (HbA1c) (p=0.04) and a tendency to significance in the reduction of fat mass (p=0.06). The comparison of weight, BMI and waist circumference was not significant (as for Group 1).
The same subjects were compared to detect the differences between wash-out period (time between the end of the administration of FS pasta and the beginning of the administration of pasta F) and the end of study phase 2 with pasta F (Table 17).
In this comparison (Table 17) data showed a significant reduction in glycaemia (p=0.007) and a tendency to significance for insulin (p=0.06). In the other comparisons, significant differences were not detected.
Group 2 (F) WASH-OUT STUDY PHASE 2 p
Weight (Kg) 81,3±5,7 80,3±5,8 0,49
Body mass index (Kg/m2) 31,3±4,1 31,6±4,5 0,83
Waist Circumference at umbilicus (cm) 97,0±2,7 96,2±2,7 0,44 Fat mass (Kg) 29,4±7,0 28,5±6,3 0,43 Glycaemia(mg/dl) 150±37,2 127±20,5 0,07 Insulin (µUI/ml) 9,2±5,5 7,5±4,5 0,06 HbA1c (%) 7,5±0,7 7,3±0,7 0,12 Total cholesterol (mg/dl) 195,2±22,6 178,2±13,2 0,12 HDL Cholesterol (mg/dl) 58,0±8,2 57,7±8,7 0,91 LDL Cholesterol (mg/dl) 109,2±14,5 101,6±10,3 0,23 Triglycerides (mg/dl) 140±57,4 94,5±33,0 0,12 ACR (mg/g) 56,4±96,1 17,2±25,4 0,34 PCR (mg/L) 4,6±4,1 5,1±4,4 0,20 AGE 2,5±0,3 2,7±0,6 0,79
Table 17. Comparison of anthropometric and clinical parameters between wash-out (T’ +2) and the end of study phase 2 (T’ +3) after the administration of pasta F to Group 2
4. Discussion and Conclusion
Observational studies showed that glycaemic index is independently associated with the risk of developing T2DM and coronary artery disease (Willett at al., 2002). So low glycaemic-index food can be defined as a class of functional food with protective effects both for T2DM and coronary disease. Pasta, popular food due to its ease of use and nutritional properties, is also healthier in that it has a much lower glycaemic index than white bread. Pasta’s low glycaemic index can be explained by several factors such as size (vermicelli vs. spaghetti) and format (maccheroni vs. spaghetti) of pasta (Colonna et al., 1990, Wolver et al., 1986), starch granule encapsulation in the gluten network (Colonna et al., 1990, Fardet et al., 1998), fibre content (Tudorica et al., 2002), starch’s physical structure and degree of gelatinization (Duszkiewicz-Reinhard et al., 1998), as well as the retrogradation and amylose/amylopectin ratio in starch (Duszkiewicz-Reinhard et al., 1998, Akerberg et al., 1998). Changing one or more structural elements in the pasta by adding fibre or raw materials whose starch has a different physical structure from durum wheat, could lead to a change in its glycaemic index.
For this reason, different types of pasta, using fibre-rich (Triticum monococcum) and low-starch content (faba bean) non-conventional flour, applying both traditional and new pasta-making technologies, were produced.
Previous evidence (Lamacchia et al., 2007) suggested a superiority (greater presence of slow-digestibility starch) of Triticum monococcum pasta over that of durum wheat pasta. However, these suggestions were the results of in-vitro observations, and did not involve assessing key metabolic parameters such as glycaemic index, either in healthy subjects or high-risk DM subjects. The results obtained in the first year of the PhD course showed that Triticum monococcum pasta (made either with 100% einkorn flour or with 50% durum wheat semolina and 50% einkorn flour) and durum wheat showed similar behaviour, in terms of GI, in healthy subjects, but that durum wheat pasta was superior (lower GI) to einkorn pasta both in subjects with positive T2DM familiarity and in those with IGT. These results could be explained considering that, for the same amount of carbohydrate administered, there is a higher starch susceptibility to digestive enzymes in einkorn pasta compared to durum wheat pasta, due to a weakening of the gluten network in composite pasta or to the formation of a weaker network in pasta made from 100% einkorn flours. The greater starch susceptibility in einkorn pasta is very well compensated in healthy subjects but in high-risk and DM-familiarity subjects leads to an increase in post-prandial blood glucose likely due to inappropriate insulinaemic response. These data agree with the in-vitro study carried out by Selvatico et al., 2012, who reported that einkorn pasta submitted to high drying temperatures (92 °C) was less digestible than pasta made with semolina. Indeed, other studies showed that a higher drying temperature for pasta helps to form covalent cross-links (dityrosin bonds) that reinforce the