Silvia Calamai
The Pisan Vowel System of Read and Semispontaneous Speech. An Exploratory Contribution*
Abstract
Speech style is an important factor with respect to vowel reduction, and the availability of larger and more realistic samples of data allows the investigators to focus on connected speech processes. The main goal of the analysis reported on in this paper is to investigate the dynamics of vowel systems under speech style changes. Utterances of stressed vowels both in semispontaneous- and read speech were analysed; the data came from the speech of two young subjects from Pisa, recorded in the AVIP (Archivio delle Varietà di Italiano Parlato) project. Works with a similar experimental design are available for Castilian Spanish (Poch-Olivé & Harmegnies 1992, Harmegnies & Poch-Olivé 1992), Belgian French (Poch-Olivé & Harmegnies 1992), Portuguese (Delplancq et al. 1995-96), English (Deterding 1997) and Italian (Giannini & Pettorino 1993; Poch-Olivé & Harmegnies 1995). Duration, F1, F2, F3 and F0 of nearly 700 vowel utterances were measured. The data collected were presented in terms of F1/F2 diagrams on a Hz scale. As for duration, F1, F2, F3 and F0 sets of ANOVAs were run to test the effects of the variable ‘speech style’ for the seven vowels /i e E a • o u/. In order to estimate how peripheral the vowels were, the Euclidean distance of each vowel from the centroid of all vowels in both speaking styles were calculated, and statistical results of the values thus computed for each vowel and speech style were presented. The acoustic size of the vowel systems in both speech conditions was calculated: the space was largest in the read speech condition and smallest in the quasi-spontaneous speech condition. The formant and duration variabilities were further observed: a lowered differenciation of the sounds in the quasi-spontaneous speech was therefore noticed. The formants frequencies were finally processed by means of discriminant analysis, which confirmed that vowels in the F1/F2 space were more differenciated in laboratory- than in semispontaneous speech.
0. Research Goals
In the present study, the following questions are addressed: What are the methodological problems involved in the comparison between read and semispontaneous speech? What are the spectral and temporal differences between read and semispontaneous speech? Are certain speech sounds – vowels of the Pisan variety, for example – influenced by a specific independent variable (speech style)? We will therefore observe if in semispontaneous speech there is a schwa-like tendency, if there is a reinforced timbres variability, if there is an increased overlapping of the vowel clusters, and finally if the semispontaneous speech vowel system is less informative and less differenciated1
.
* Extended version of a poster presented at ASI 2002 (NATO Advanced Study Institute) Dynamics of Speech Production and Perception; June 24-July 6, 2002 Il Ciocco, Italy. The Summer School was supported by an ISCA and ASI grant. This paper has benefited from comments made by various people, including Pier Marco Bertinetto, Klaus J. Kohler, Louis Pols.
1 Many studies focussing on the differences between read and semispontaneous speech are now available: see for instance Ladefoged, Kameny & Brackenridge (1976); ESCA (1991); Llisterri & Poch-Olivé (1992); Blaauw
Some caveats are necessary, since it is not easy at all to obtain identical spontaneous- and read speech material. In many studies spontaneously spoken material is used as a starting point and the written version is presented to be read out afterwards (Poch-Olivé & Harmegnies 1992, 1995; Harmegnies & Poch-Olivé 1992; Giannini & Pettorino 1993, Delplancq et al. 1995-96; Koopmans-Van Beinum 1992). In any case some weaknesses are evident: this choice solves part of the problem only if the original speech material is almost faultless grammatically and without hesitation and repetitions; the researcher is compelled to use only one speaker; this apparently safe experimental design does not permit however total control of all the variables involved2
. A circular and somehow paradoxical problem has therefore to be faced: while we do study the vowel system of read speech and we do study the vowel system of spontaneous speech we still do not know how to compare these two different speech styles when more than one subject is involved in the experiment.
As for the acoustic literature on the Italian vowel system, it is founded on different kinds of speech material: in Ferrero (1972) vowels uttered in isolation and vowels embedded in pseudo-words are observed; in Ferrero et alii (1978) vowels uttered in word lists are observed; in Albano Leoni et alii (1995, 1998) vowels recorded from four regional TV news bulletins are measured. Both Giannini & Pettorino (1993) and Poch-Olivé & Harmegnies (1995) aimed at comparing spontaneous speech with read speech, but data came from only one speaker.
1. Experimental Design 1.1 Speech Material
We first have to define the notions ‘connected speech’ and ‘read speech’, at least with respect to the way we use them in the scope of this paper. The connected speech material recorded consisted of quasi-spontaneous dialogues (staged ‘map tasks’). The scripted data consisted of acoustic records of isolated words and pseudo-words read once; in the word list the place-names uttered during the map task were also inserted; these place-names were read twice (see Appendix a-b). The word list was the same for the two subjects, apart from the place-names. The recordings were made in a sound-proof room at the Laboratorio di Linguistica of the Scuola Normale Superiore (Pisa)3
. 706 tokens total (346 for the read speech, 360 for the semispontaneous speech) were measured.
1.2 Formant Frequency and Vowel Duration Measurements
Using the Multispeech software, the speech material was downsampled at 11025 Hz, and spectrographic analysis was performed using an LPC algorithm, Hamming window, and a frame lenght of 20 ms. Digital spectrograms were derived, using a pre-emphasis coefficient of 0.9; 14th order linear prediction was used for all data. Where any one of the formants
2
E.g. variable position of the target word in the semispontaneous speech vs. ‘fixed’ position in the word list; heavy influence of prosodic context in the semispontaneous speech vs. slight influence of prosodic context in the word list.
3 In the case of comparison between read and spontaneous speech we always have to mention and to keep in mind the situational dimension in which the talker has produced the (recorded) speech material. The situational dimension in our speech material was not varied (the material was all collected in a sound-treated room), but for the read speech corpus the speaker was alone in the room, whereas the connected speech corpus was collected when two subjects were speaking.
was incorrectly tracked, Long Term Average Power Spectrum, using the Fast Fourier Transform, was performed. The pitch analysis was made with the autocorrelation method (70-350 analysis range). The vowel boundary was set at the point of disappearance of the second formant; measures of F1, F2 and F3 were taken at vowel midpoint over three consecutive frames whose values were averaged; the measurements were all checked by visual inspection of linear-prediction-based formant tracks overlaid on spectrograms. 1.3 Focus Words and Non-Focus Words in Semispontaneous Speech
In the connected speech corpus function words4
, words embedded in sentences with interrogative intonation, and words embedded in overlapping turns were discarded. In 2.1-2.5 and 2.8 data from all semispontaneous speech tokens were compared with read speech tokens; but since vowels are strongly affected by prosodic context, a rather rough distinction between prominent and non-prominent words was made: in 2.6-2.7 vowels embedded in focus words were separated from the ones embedded in non focus words. Following the experimental design described in Sornicola & Maturi (1994), a token was classified as prominent on the basis of auditory and structural analysis.
2. Results
The general question is identifying the parameters in which semispontaneous speech differs from read speech (See Appendix d for the entire data on acoustic measurements).
2.1 Average Values of F1 and F2
In figures 1-2, average values of first formant are plotted against average values of second formant in both speech style conditions.
. Speaker S:
Figure 1.
Average values from read- (‘X’) and semispontaneous speech (‘O’).
4
. Speaker V:
Figure 2.
Average values from read- (‘X’) and semispontaneous speech (‘O’).
2.2 Statistical Analysis
In order to estimate whether the connected speech vowel system was significantly different from that of read speech, sets of one-way ANOVAs were run to test the effects of the variable ‘speech style’ on the seven vowels, with duration, F1, F2, F3 and F0 as dependent variables (see Appendix c for the complete tables).
Speaker-Independent Findings:
Speech style seems to have the deepest influence on duration (read vowels are on the whole longer than connected vowels)5 and on F1 (low and mid-low vowels in the read condition have higher values of F1, high vowels in the read condition have lower values)6.
Speaker-Dependent Findings:
As for speaker S, speech style shows no effect on F3, reveals a slight effect on F2 and F0 but shows a considerable effect on the difference (F1-F0), in which it turns out to be significant for all vowels. As for speaker V, speech style shows a deep effect on F2: it turns out to be significant for all vowels but /o/. Speech style turns out to be significant also for front vowels and /u/ third formant. The difference (F1-F0) turns out to be significant for /a/, /E/, /e/, /•/. F0 is always higher in speaker S’s read speech and is always lower in speaker V’s read speech7; in both subjects pitch range is usually wider in connected than in read speech.
5 Speech style turns out to be significant for all vowels, but /i/ of speaker V. 6 Speech style t urns out to be significant for all vowels, but /o/.
2.3 Euclidean Distance
One might expect the read vowels to be more peripheral than the vowels from connected speech, partly because of the effects of coarticulation with the neighbouring consonants, and particularly because one would expect fluent speakers to economize somewhat in their vocal effort in connected speech. In order to estimate how peripheral the vowels were, the Euclidean distance (ED) in Hz of each point representing a measured vowel utterance in the experiment was calculated from the centroid of all vowels (this neutral reference point was calculated as the average value of F1 and F2, for each speaker)8
. If the vowel space did, in fact, shrink, then these calculated distances, should decrease for each vowel, as the formant patterns would approximate the pattern of the neutral reference vowel.
. Speaker S:
0
100
200
300
400
500
600
700
800
900
i
e
E
a
O
o
u
ED read speech
ED semi-spontaneous speech
Figure 3.
8 In Poch-Olivé & Harmegnies (1995) the Euclidean distance was calculated on the basis of schwa values; but since standard Italian has not phonological schwa, the centroid values (i.e. the grand mean of all measured formant
. Speaker V:
0
200
400
600
800
1000
i
e
E
a
O
o
u
ED read speech
ED semi-spontaneous speech
Figure 4.
In order to verify whether there was a schwa-like tendency, a centralization index (d)9 was also computed for each inter style pair of vowels. To test the statistical significance of the average d in a specific set of sound pairs, the ANOVA test comparing ED of read speech to ED of connected speech was used (this procedure allows an assessment of the significance of the average d). . Speaker S: V d F p (p < .05) all vowels -62 5,28 (1, 333) .022 /i/ -23 0,17 (1, 52) .674 /e/ 60 1,82 (1, 27) .188 /E/ -37 2,29 (1, 63) .135 /a/ 13 0,62 (1, 92) .432 /•/ 69 5,51 (1, 45) .023 /o/ 77 3,76 (1, 24) .064 /u/ 210 21,35 (1, 19) .000
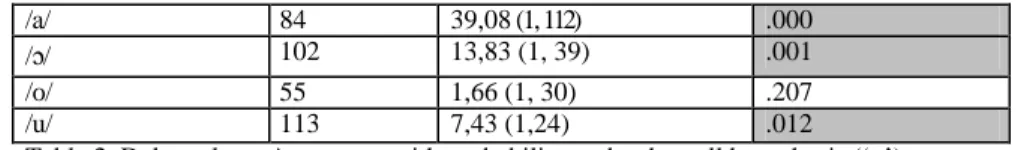
Table 1. Delta values, Anova test with probability under the null hypothesis (‘p’). . Speaker V: v d F p (p < .05) all vowels 93 19,11 (1, 369) .000 /i/ 194 28,11 (1, 44) .000 /e/ 98 10,24 (1, 34) .003 /E/ 71 11,22 (1, 74) .001 9
The centralization index is the difference between the Euclidean distance from the observed vowel to centroid in read speech and the Euclidean distance from the observed vowel to centroid in spontaneous speech.
/a/ 84 39,08 (1, 112) .000
/•/ 102 13,83 (1, 39) .001
/o/ 55 1,66 (1, 30) .207
/u/ 113 7,43 (1,24) .012
Table 2. Delta values, Anova test with probability under the null hypothesis (‘p’).
. Speaker S:
-50
0
50
100
150
200
250
i
e
E
a
O
o
u
Figure 5. Delta values.
. Speaker V:
0
50
100
150
200
250
i
e
E
a
O
o
u
The distance to the centroid increases for the read tokens, but only for speaker V’s data, in which centralization turns out to be significant for all vowels, but /o/. Speaker S shows some negative values of d; and centralization turns out to be significant only for two vowels (/•/ and /u/). In addition, speaker S’s d values indicate a more marked centralization in back vowels than in front vowels; whereas the opposite is found in speaker V’s d values.
2.4 Formant Frequencies Variabilities
The standard deviations of the first formant values are systematically greater in connected speech than in laboratory speech.
. Speaker S:
13
35
42
32
36
31
18
52
57
64
147
65
71
56
0
50
100
150
200
i
e
E
a
O
o
u
F1 SD read speech
F1 SD semi-spontaneous speech
. Speaker V:
33
30
49
57
43
20
27
45
37
86
97
75
40
48
0
20
40
60
80
100
120
i
e
E
a
O
o
u
F1 SD read speech
F1 SD semi-spontaneous speech
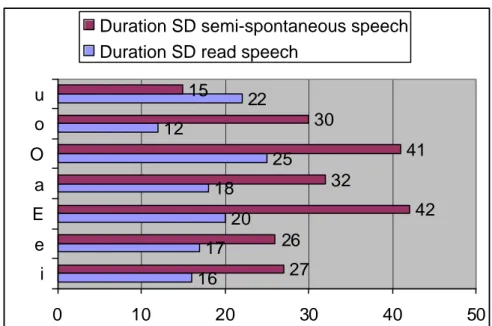
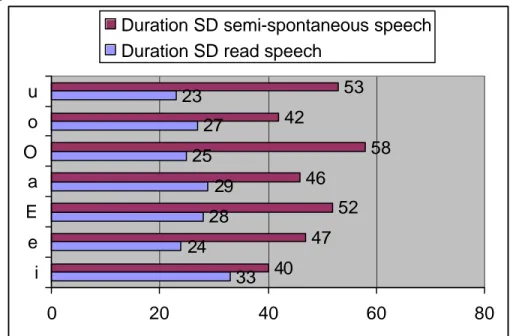
Figure 8. Standard deviations of the first formant values for each vowel in each style. A similar tendency is found in duration values as well:
. Speaker S:
16
17
20
18
25
12
22
27
26
42
32
41
30
15
0
10
20
30
40
50
i
e
E
a
O
o
u
Duration SD semi-spontaneous speech
Duration SD read speech
. Speaker V:
33
24
28
29
25
27
23
40
47
52
46
58
42
53
0
20
40
60
80
i
e
E
a
O
o
u
Duration SD semi-spontaneous speech
Duration SD read speech
Figure 10. Standard deviations of duration values for each vowel in each style.
Some unclear results were found in F2, F3, and F0 standard deviation values (they are not systematically greater in connected speech than in laboratory speech10).
As an illustration of the contrast between read and semispontaneous speech, in Figures 11-12 F1 means of both speakers are plotted against their coefficient of variance for each phone class. As expected, the variance increases in the semispontaneous speech vowels (n.b. the orizontal scale of Fig. 12 is twice that of Fig. 11), whose means means cover furthermore a lower range.
10 Similar findings are in Poch-Olivé & Harmegnies (1995: 410), concerning the Italian vowel system of spontaneous speech; and also in Delplancq, Harmegnies and Poch-Olivé (1995-96: 180), concerning the Portuguese vowel system of spontaneous speech.
Figures 11-12.
Figures 13 and 14 plot mean segmental duration of both speakers against their coefficient of variance for each phone class. As expected, the vowels from semispontaneous speech tend to be shorter and more varied than the vowels from read speech (n.b. The orizontal scale of Fig. 14 is three times larger than that of Fig. 13).
0 1 0 0 2 0 0 3 0 0 4 0 0 5 0 0 6 0 0 7 0 0 8 0 0 9 0 0 0.00 0.02 0.05 0 . 0 8 0 . 1 1 0 . 1 4 F 1 c o e f f i c i e n t o f v a r i a n c e F1 read speech 0 1 0 0 2 0 0 3 0 0 4 0 0 5 0 0 6 0 0 7 0 0 8 0 0 0 . 0 0 0 . 0 7 0 . 1 4 0 . 2 1 0 . 2 8 F 1 c o e f f i c i e n t o f v a r i a n c e F1 connected speech
Figures 13-14.
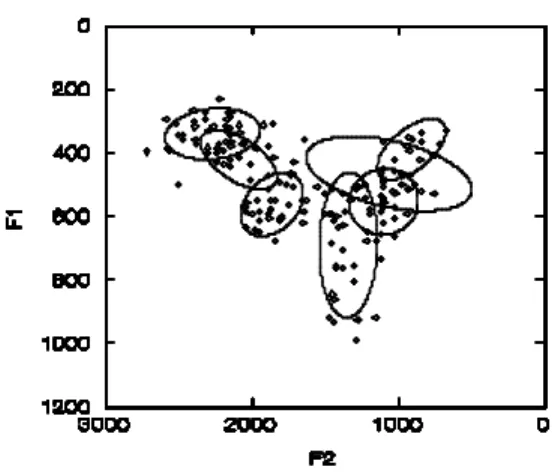
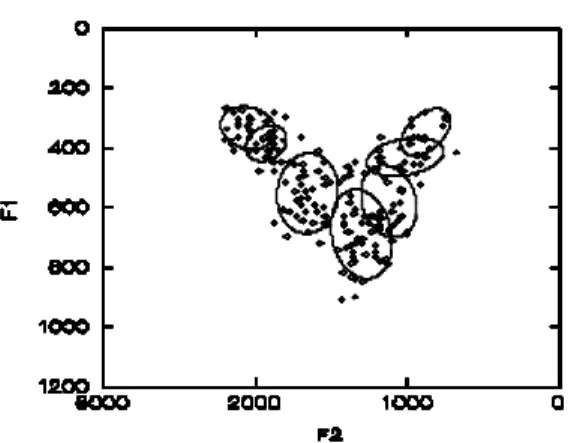
2.5 Dispersions within Phonetic Categories
Centralization and increasing intra-cluster variability result in more overlapping formant distributions in the semispontaneous speech tokens (Figures 16 and 18).
0 2 0 4 0 6 0 8 0 1 0 0 1 2 0 1 4 0 1 6 0 1 8 0 0 . 0 0 0 . 0 7 0 . 1 4 0 . 2 1 0 . 2 8 0 . 3 6 D u r a t i o n c o e f f i c i e n t o f v a r i a n c e
Duration read speech
0 2 0 4 0 6 0 8 0 1 0 0 1 2 0 1 4 0 1 6 0 1 8 0 0 . 0 0 0 . 1 4 0 . 2 8 0 . 4 3 0 . 5 7 1 . 1 2 D u r a t i o n c o e f f i c i e n t o f v a r i a n c e
. Speaker S:
Figure 15. Regions (68% bivariate ellipsoids) of read speech vowels.
. Speaker V:
Figure 17. Regions (68% bivariate ellipsoids) of read speech vowels.
Figure 18. Regions (68% bivariate ellipsoids) of semispontaneous speech vowels.
2.6 Focus Words vs. Non-Focus Words in Semispontaneous Speech
The likelihood of segmental and suprasegmental reduction in stressed vowels seems to be inversely related to the degree of the perceptual salience of the words in which these vowels are embedded.
. Speaker S:
Figure 19.
Regions (68% bivariate ellipsoids) of semispontaneous speech embedded in prominent words.
Figure 20.
. Speaker V:
Figure 21.
Regions (68% bivariate ellipsoids) of semispontaneous speech embedded in prominent words.
Figure 22.
Regions (68% bivariate ellipsoids) of semispontaneous speech embedded in non-prominent words.
2.7 Vowel Space
The area covered by the polygon defined by the mean F1 and F2 values of the seven vowels was calculated: this is a simple, but effective, way of characterizing the acoustic size of a vowel system. The vowel space defined by the vowels in each condition did differ in terms of area, and the overall area was obviously affected when the subjects changed speech style: the space was largest in the read speech condition and smallest in the quasi-spontaneous speech condition.
vowel space Speaker S Speaker V
read speech area 456371 Hz² 410199 Hz²
connected speech area 245177 Hz² (-47%) 213589 Hz² (-47%) connected speech area (focus words) 310290 Hz² (-32%) 229701 Hz² (-44%) connected speech area (non-focus words) 222437 Hz² (-51%) 199538 Hz² (-51%) Table 3.
Speech style does have a profound effect on the overall vowel space, shrinking the vowel space by 47% from the read speech condition to the quasi-spontaneous speech condition (for both speakers). The patterns of the two subjects are quite similar: the vowe l space of connected speech prominent tokens is always larger than the vowel space of connected speech non-prominent tokens.
2.8 Discriminant Analysis
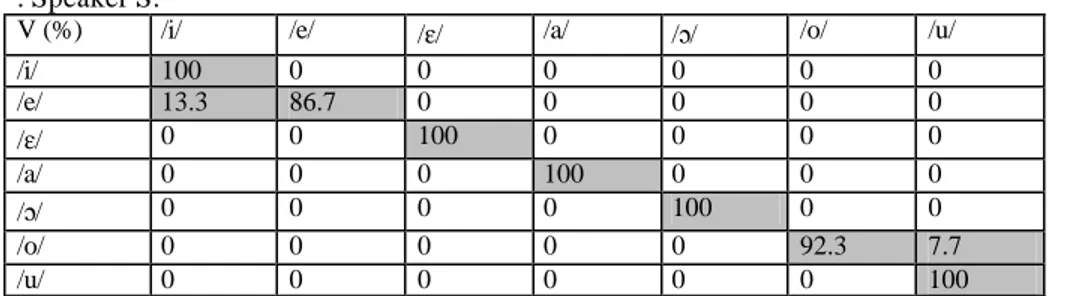
The more overlapping formant distributions cause lowered recognition rates in spontaneous speech. In order to verify whether the semispontaneous speech vowel system was less informative and less differenciated, two discriminant analyses (one in connected speech, and one in lab speech) were performed, with the vowels as a priori categories and the formant values (F1 and F2) as discriminant variables11. The statistical distribution of the measurements was supposed to be Gaussian and the covariance matrix was hypothesized to be similar for the measurements of the vowels in each pair. Once the discriminant functions were computed, a recognition task was simulated in each subsample; from the linear discriminant analysis for the seven vowels categories, matrices showing how the vowel tokens were classified were obtained.
Errors are mu ch more numerous with the semispontaneous samples than with the laboratory ones: the combined correct recognition rates are 98.2% and 96.6% in read speech and only 73.4% and 80.8% in connected speech. In the read samples, the confusion is only between two categories (e.g. /e/ and /i/; /o/ and /u/; /•/ and /a/), whereas in the connected samples, the confusion involves three, four and even five vowel categories at time (e.g. /E/, /e/ and /i/; /a/, /E/, /•/ and /o/).
A more marked difference between read and semispontaneous speech is in Speaker S’s confusion matrices (98.2% vs. 73.4% combined correct recognition rates respectively): since this subject has the lowest centralization indices (see 2.3), timbres confusions do not turn out to be more likely in vowels with an important degree of centralization12.
11 R method of classification.
. Speaker S:
V (%) /i/ /e/ /E/ /a/ /•/ /o/ /u/
/i/ 100 0 0 0 0 0 0 /e/ 13.3 86.7 0 0 0 0 0 /E/ 0 0 100 0 0 0 0 /a/ 0 0 0 100 0 0 0 /•/ 0 0 0 0 100 0 0 /o/ 0 0 0 0 0 92.3 7.7 /u/ 0 0 0 0 0 0 100
Table 4. CONFUSION MATRIX FROM THE SIMULATED VOWEL RECOGNITION TASK IN READ SPEECH. Actual groups are in rows, and predicted group membership in columns.
. Speaker S:
V (%) /i/ /e/ /E/ /a/ /•/ /o/ /u/
/i/ 95 2.5 2.5 0 0 0 0 /e/ 71.4 21.4 7.1 0 0 0 0 /E/ 0 3 97 0 0 0 0 /a/ 0 0 5.6 72.2 22.2 0 0 /•/ 0 0 0 13.6 81.8 4.5 0 /o/ 7.7 0 7.7 0 46.2 15.4 23.1 /u/ 0 0 0 0 9.1 27.3 63.6
Table 5. CONFUSION MATRIX FROM THE SIMULATED VOWEL RECOGNITION TASK IN CONNECTED SPEECH. Actual groups are in rows, and predicted group membership in columns. . Speaker V:
V (%) /i/ /e/ /E/ /a/ /•/ /o/ /u/
/i/ 95.7 4.3 0 0 0 0 0 /e/ 6.7 93.3 0 0 0 0 0 /E/ 0 0 100 0 0 0 0 /a/ 0 0 0 98.3 1.7 0 0 /•/ 0 0 0 8.7 91.3 0 0 /o/ 0 0 0 0 0 100 0 /u/ 0 0 0 0 0 8.3 91.7
Table 6. CONFUSION MATRIX FROM THE SIMULATED VOWEL RECOGNITION TASK IN READ SPEECH. Actual groups are in rows, and predicted group membership in columns.
. Speaker V:
V (%) /i/ /e/ /E/ /a/ /•/ /o/ /u/
/i/ 73.9 26.1 0 0 0 0 0 /e/ 19 81 0 0 0 0 0 /E/ 0 7 86 4.7 2.3 0 0 /a/ 0 0 8.9 87.5 1.8 1.8 0 /•/ 0 0 0 27.8 61.1 11.1 0 /o/ 0 0 5.6 0 0 77.8 16.7 /u/ 0 0 0 0 0 21.4 78.6
Table 7. CONFUSION MATRIX FROM THE SIMULATED VOWEL RECOGNITION TASK IN CONNECTED SPEECH. Actual groups are in rows, and predicted group membership in columns.
3. Conclusion
Some trends observed here were also mentioned in other acoustic studies:
i. the vowel space expands in read speech and contracts in semispontaneous speech; ii. the vowel space expands in connected speech prominent words and contracts in connected speech non-prominent words;
iii. an increasing intra-cluster variability is observed in semispontaneous speech; iv. more overlapping formant distributions are noticed in semispontaneous speech; v. lower recognition rates are found in semispontaneous speech.
Nevertheless, some inconsistencies are evident, and quite serious methodological problems that may challenge the validity of some results have to be kept in mind. We can’t simply assert that vowels from connected speech are always less peripheral, more variable and more scattered in the acoustic space, and neither is it possible to assert that the phenomena here described are language-dependent, since few languages have been studied from this particular point of view. In Standard Southern British English, Deterding (1997) finds that the difference between citation and connected speech is only statistically significant for the male speech and not for the female speech; Poch-Olivé and Harmegnies (1992) point out that Spanish and Italian vowels in spontaneous speech show centralization and increased probability of inter vowel confusion, but they point out as well that clear a centralization tendency is absent from French vowels; Delplancq et al. (1995-96) draw attention to the decrease of the surface occupied by the Portuguese vowels in the F1/F2 plane in spontaneous speech, whereas they find an increase of the surface occupied by the Italian and Spanish vowels in the F1/F2 plane in spontaneous speech. In Giannini & Pettorino (1993) data on Italian and Catalan vowel systems two opposite tendencies were found: in the spontaneous speech condition the Italian speaker showed a clear trend towards reduction, whereas the opposite was observed in the Catalan speaker13.
Some results may be therefore vowel-dependent (certain speech sounds are supposed to be more stable than others)14, or even speaker-dependent. Alternately, the effects may be associated with methodological artefacts such as the type of speech material and the experimental design. The latter interpretation indicates the need for further study.
Selected Bibliography
Aguilar, L., M. Machuca, G. Martinez 1991 “Analysis of Spanish Sequence ‘de’ in Content Words and in Function Words in Continuous Speech”. Proceeding of the ESCA Workshop. Phonetics and
Phonology of Speaking Styles: Reduction and Elaboration in Speech Communication, Barcelona,
30.IX-2.X.1991: 7.1-7.4.
Albano Leoni, F., F. Cutugno, R. Savy 1995 “The Vowel System of Italian Connected Speech”. In K. Elenius, P. Branderud (eds), Proceedings of XIIIth International Congress of Phonetic Sciences, Stockholm 13-19.VIII.1995, Stockholm, IV: 396-399.
Albano Leoni, F., F. Cutugno, R. Savy 1998 “Il vocalismo dell’italiano televisivo. Analisi acustica di un corpus”. In G. Ruffino (ed), Atti del XXI Congresso Internazionale di Linguistica e Filologia
Romanza, Centro di studi filologici e linguistici siciliani - Università di Palermo 18-24.IX.1995,
Tübingen, Niemeyer, IV: 3-16.
Barry, W., B. Andreeva 2001 “Cross-languague Similarities and Differences in Spontaneous Speech Patterns”. Journal of the International Phonetic Association: 51-66.
Blaauw, E. 1995 On the Perceptual Classification of Spontaneous and Read Speech, Utrecht, LEd. Delplanq, V., B. Harmegnies, D. Poch-Olivé 1995-96 “Effects du style de parole sur la réduction
vocalique en portugais”. Verbum, 18: 175-187.
Deterding, D. 1997 “The Formants of Monophthong Vowels in Standard Southern British English Pronunciation”. Journal of the International Phonetic Association, 27: 47-55.
ESCA 1991 Proceeding of the ESCA Workshop. Phonetics and Phonology of Speaking Styles:
Reduction and Elaboration in Speech Communication, Barcelona, 30.IX-2.X.1991.
Farnetani, E. 2002 “The Supralaryngeal Articulation of Prominence in Italian Vowels”. Quaderni
dell’Istituto di Fonetica e Dialettologia, IV: 55-62.
Ferrero, F.E. 1972 “Caratteristiche acustiche dei fonemi vocalici italiani”. Parole e metodi, 3: 9-31. Ferrero, F.E., E. Magno Caldognetto, K. Vagges, C. Lavagnoli 1978 “Some Acoustic Characteristics
of the Italian Vowels”. In M. Nespor (ed), On Phonology and Phonetics. Journal of Italian
Linguistics, 3 (1): 87-96.
Giannini, A., M. Pettorino 1993 “Spostamenti vocalici tra parlato letto e parlato spontaneo in lingue a sette vocali”. In A. Peretti, F. Ferrero (eds), Atti del XXI Convegno Nazionale dell’AIA, 31.III-2.IV.1993, Padova: 71-74.
Harmegnies, B., D. Poch-Olivé 1992 “A Study of Style-induced Vowel Variability: Laboratory versus Spontaneous Speech in Spanish”. Speech Communication, 11: 429-437.
Koopmans-Van Beinum, F.J. 1992 “The Role of Focus Words in Natural and in Synthetic Continuous Speech: Acoustic Aspects”. Speech Communication, 11: 439-452.
Ladefoged, P., I. Kameny, W. Brackenridge 1976 “Acoustic Effects of Style of Speech”. The Journal
of the Acoustical Society of America, 59: 228-231.
Lindgren, R., B. Lindblom 1996 “Reduction of vowel chaos”. TMH-QPSR, 2: 1-4.
Llisterri, J., D. Poch-Olivé 1992 (eds) “Special Issue on Phonetics and Phonology of Speaking Styles: Reduction and Elaboration in Speech Communication”. Speech Communication.
Meunier, C., C. Floccia 1997 “La spécificité des types de parole pour la perception de la voyelle”. La
voyelle dans tous ses états. Journées d’Etudes Linguistiques, Nantes, 5-6.XII.1997, Groupe AAI –
Université de Nantes: 158-163.
Poch-Olivé, D., B. Harmegnies 1992 “Variations structurelles des systèmes vocaliques en français et espagnol sous l’effet du style de parole”. Journal de Physique IV Supplément au Journal de
Physique III, vol. 2, avril 1992: 283-286.
Poch-Olivé, D., B. Harmegnies 1995 “A Dynamic Approach of Vowel System in Italian”. In K. Elenius, P. Branderud (eds), Proceedings of XIIIth International Congress of Phonetic Sciences, Stockholm 13-19.VIII.1995, Stockholm, I: 408-411.
Savy, R., F. Cutugno 1998 “Analisi acustica di vocali in monosillabi clitici in parlato spontaneo italiano”. In Associazione Italiana di Acustica, Atti del XXVI Convegno Nazionale dell’Associazione
Italiana di Acustica, Torino 27-29.V.1998, Torino: 301-305.
Simpson, A.P., M. Pätzold 1996 (eds.) “Sound Patterns of Connected Speech Description, Models and Explanation”. Proceedings of the Symposium held at Kiel University on 14-15 June 1996,
Sornicola, R., P. Maturi 1994 “Un modello epidemiologico del cambiamento linguistico: dinamica di una micro-variazione fonetica in Campania”. In G. Holtus, E. Radtke (Hrsg), Sprachprognostik und
das ‘italiano di domani’. Prospettive per una linguistica ‘prognostica’, Tübingen, Narr: 59-98.
Van Bergem, D.R. 1993 “Acoustic Vowel Reduction as a Function of Stress Accent, Word Stress and Word Class”. Speech Communication, 12: 1-23.
Appendices a. Word List
An alternate pronunciation is marked between round brackets or in italics; place-names occurring in the word list and in the map task are labelled with “pl. n. / S” if they refer to speaker S’s utterances, and with “pl. n. / V” if they refer to speaker V’s utterances
pseudo-words: . /a/: tata; tatà
. /E/ or /e/: tèta (téte); tète (téte); tetè (teté); titè (tité) . /i/: titi; tite; tutì; titì
. /•/ or /o/: tòtu (tótu); tòto (tóto); tatò (tató); totò (totó) . /u/: tutu; tutù
words:
. /a/: campo; parco; rapa; bagno; labbro; salma; data; ragazza; camion; gas; afa; banca; bar; pace; marcia; afgano; mamma; astro; sala; barra; calza; marzo; disfrenare; pappa; taglio; tanfo; casa; faggio; tram; salto; capsula; casco; gag; agitare; gambo; fan; palla; talismano; mancia; subtotale; sacro; capra; calco; aspro; reclamo; constatare; carne; gatto; acme; radar; salsa; scialle; clacson; basso; panca; farfalla; ambulante (pl. n./S); barche (pl. n./ S); verità (pl. n./ S); babà (pl. n./ S); zazà (pl. n./ S); arco (pl. n./ V); semaforo (pl. n./ V); ospedale (pl. n./ V); felicità (pl. n./ V); università (pl. n./V)
. /E/: perfetto; esperto; avanscoperta; superstite; rette; bene; enel; ebbe; accento; senso; bolscevico; leggo; senza; neve; replica; riflesso; rebus; caffè; eczema; gag; testa; tungsteno; etna; selz; atleta; zero; tecnica; fratello; albergo (pl. n./ S)
. /e/: discreto; accredito; cera; penne; perché; pesa; senza; neve; elmetto; invece; messa; selce; vedo; bevve; esteso; abeti (pl. n./ S); ventitré (pl. n./ S); biciclette (pl. n./ V)
. /i/: giro; bolscevico; ritmo; esclusivo; disney; kit; cifra; film; uncino; alluminio; limpida (pl. n./ S); colibrì (pl. n./ S); piccolo (pl. n./ V); doremì (pl. n./ V); mimì (pl. n./ V)
. /•/: sampdoria; oslo; approdo; ovest; coca; addome; sport; gnocco; colla; golf; esplodere; vietcong; nord; poso; roba; subconscio; dogma; gol; corpo; fosforo; automobili (pl. n./ S); portico (pl. n./ S); deposito (pl. n./ V); negozio (pl. n./ V); totò (pl. n./ V)
. /o/: corto; ascensore; colpa; rombo; corso; orma; zolfo; conto; gol; orlo; bolla; francobollo; rondini (pl. n./ S)
. /u/: upim; pubblico; footbal; iglù; buffo; gulag; acuto; punta; musica (pl. n./ V)
b. Tokens from Semispontaneous Speech Speaker S:
. /a/: usare; vado; fame; valle; barca; barche; arriva; facciamo; faccio; larga; allargo; balla; diciamo; fatto; arrivato; arrivare; ritornato; tornando; risalgo; verità; ambulante; necessario
. /e/: rimané; te; vedo; abeti; parecchio; discesa; avevo
. /i/: sì; vicino; mica; fino; capito; tipo; continua; magazzino; giro; arrivo; omino; limpida; diritto . /•/: portico; qualcosa; negozio; no; colle; posso; trovo; cosa; però; sto; c’ho; so
. /o/: bisogna; rondini; ora; venditore; allora; sono; dopo; torna; fosse; come . /u/: curva; scusa; punto; subito; sicura; tutto; oppure
Speaker V:
. /a/: passi; semaforo; ospedale; avanti; passà; parte; male; felicità; soltanto; angolo; passare; rubate; andare; ritornare; girare; fare; passarci; passando; angolo; verticale; metà; stando; esatto; arco; tornando; passando; bar; larga; carta; pratica; passa; ansa; passi; largo; base
. /E/: verso; specie; destra; prendi; mezzo; (sud)est; vabbè; prendila; dovrebbe; senso; scèndere; scèndi; ecco; retto; bene; partenza; devi; riscèndi
. /e/: te; aggeggi; invece; biciclette; probabilmente; praticamente; perché; rigonfiamento; perfettamente; verticalmente; frega; riferimento; impresa; seguo
. /i/: giro; sì; sinistra; perpendicolo; gira; arrivo; gìrali [giragli]; piccolo; arrivi; prima; mimì; diritto . /•/: no; negozio; però; totò; deposito; c’ho; proprio; po’; so
. /o/: sopra; dopo; ancora; sotto; intorno; icona; sopra; intorno; come . /u/: comunque; una; tutti; musica; dunque; giù; punto; sud; scusa
c. Tables 8-9. Sets of ANOVAs with probability under the null hypothesis (p < .05), testing the effects of the variable ‘speech style’.
. Speaker S: v F (F1) p F (F2) p F (F3) p F (F1F0) p F (F2F1) p F (F0) p F (D) p all v 28,14 .000 10,58 .001 1,19 .276 23,65 .000 19,8 .000 3,42 .065 549,2 .000 /i/ 14,07 .000 0,45 .503 2,15 .148 15,74 .000 0,05 .808 0,568 .455 64,23 .000 /e/ 7,08 .013 1,30 .264 2,11 .161 9,24 .005 2,99 .095 0,25 .618 118,4 .000 /E/ 57,46 .000 1,77 .188 1,65 .203 43,76 .000 27,80 .000 4,41 .040 46,32 .000 /a/ 31,20 .000 1,82 .180 0,18 .671 24,94 .000 9,65 .003 14,16 .000 211,7 .000 /•/ 10,42 .002 6,59 .014 0,02 .870 9,27 .004 14,86 .000 0,002 .960 51,39 .000 /o/ 2,35 .138 3,35 .079 0,17 .683 5,32 .030 1,83 .188 0,87 .358 136,1 .000 /u/ 20,55 .000 18,46 .000 2,69 .117 17,55 .000 7,83 .011 1,17 .291 108,9 .000 . Speaker V: v F (F1) p F (F2) p F (F3) p F (F1F0) p F (F2F1) p F (F0) p F (D) p all v 15,95 .000 0,07 .782 5,79 .017 13,81 .000 2,56 .110 32,11 .000 115 .000 /i/ 9,48 .004 28,17 .000 28,66 .000 2,74 .105 28,15 .000 4,57 .039 2,22 .143 /e/ 4,62 .039 13,36 .001 42,05 .000 5,08 .032 6,56 .015 0,94 .339 35,39 .000 /E/ 42,05 .000 14,51 .000 16,51 .000 39,12 .000 0,18 .667 5,77 .019 27,15 .000 /a/ 69,61 .000 8,93 .003 0,11 .741 82,37 .000 54,04 .000 11,64 .001 36,79 .000 /•/ 9,40 .004 14,28 .001 0,02 .871 9,18 .004 23,39 .000 3,23 .081 9,33 .004 /o/ 0,09 .761 3,98 .054 3,06 .089 2,25 .146 2,39 .132 6,08 .020 23,5 .000 /u/ 5,77 .024 6,76 .016 5,18 .032 3,73 .067 3,88 .060 3,10 .093 6,41 .018
d. Tables 10-23. Average values of F1, F2, F3, F0, D in Hz of read speech compared with
. Speaker S: /i/ rs F1 rs F2 rs F3 rs F0 rs D cs F1 cs F2 cs F3 cs F0 cs D N 14 14 14 14 14 40 40 36 40 40 mean 288 2228 3094 153 148 341 2267 2936 146 86 sd 13 78 223 14 16 52 209 376 33 27 c.v. 0.04 0.03 0.07 0.09 0.11 0.15 0.09 0.13 0.23 0.31 Min 265 2139 2697 128 121 228 1634 2411 106 31 Max 306 2397 3391 176 170 499 2714 3976 279 146 range 41 258 694 48 49 271 1080 1565 173 115 /e/ rs F1 rs F2 rs F3 rs F0 rs D cs F1 cs F2 cs F3 cs F0 cs D N 15 15 15 15 15 14 14 8 13 14 mean 376 2137 2734 149 160 422 2088 2635 144 73 sd 35 56 76 11 17 57 158 248 34 26 c.v. 0.09 0.03 0.03 0.07 0.10 0.13 0.08 0.09 0.23 0.35 Min 306 2053 2578 126 136 363 1744 2354 102 39 Max 426 2252 2834 167 195 567 2305 3165 227 129 range 120 199 256 41 59 204 561 811 125 90 /E/ rs F1 rs F2 rs F3 rs F0 rs D cs F1 cs F2 cs F3 cs F0 cs D N 32 32 32 32 32 33 33 29 30 33 mean 664 1824 2627 142 170 562 1858 2579 133 114 sd 42 48 129 8 20 64 137 165 24 42 c.v. 0.06 0.03 0.05 0.05 0.12 0.11 0.07 0.06 0.18 0.37 Min 569 1722 2312 128 133 417 1497 2224 87 31 Max 749 1897 2844 156 204 674 2045 2835 197 173 range 180 175 532 28 71 257 548 611 110 142 /a/ rs F1 rs F2 rs F3 rs F0 rs D cs F1 cs F2 cs F3 cs F0 cs D N 58 58 58 58 58 36 36 32 36 36 mean 801 1367 2469 142 171 690 1340 2450 132 96 sd 32 67 207 8 18 147 128 175 18 32 c.v. 0.04 0.05 0.08 0.06 0.10 0.21 0.09 0.07 0.13 0.33 Min 742 1199 1958 123 130 484 1104 2060 102 55 Max 876 1540 2803 160 210 990 1649 2746 169 169 range 134 341 845 37 80 506 545 686 67 114 /•/ rs F1 rs F2 rs F3 rs F0 rs D cs F1 cs F2 cs F3 cs F0 cs D N 25 25 25 25 25 22 22 21 21 22 mean 603 1017 2462 144 169 554 1097 2471 144 98 sd 36 42 159 9 25 65 150 206 28 41 c.v. 0.06 0.04 0.06 0.06 0.15 0.12 0.14 0.08 0.19 0.42 Min 530 966 2141 122 107 447 880 2049 116 44 Max 671 1103 2724 167 209 735 1451 2738 217 223 range 141 137 583 45 102 288 571 689 101 179 /o/ rs F1 rs F2 rs F3 rs F0 rs D cs F1 cs F2 cs F3 cs F0 cs D N 13 13 13 13 13 13 13 11 12 13 mean 433 887 2332 146 169 466 1062 2309 139 64 sd 31 59 81 11 12 71 341 181 23 30 c.v. 0.07 0.07 0.03 0.07 0.07 0.15 0.32 0.08 0.17 0.48 Min 354 794 2248 117 149 311 754 2030 100 30 Max 467 988 2515 164 188 571 1855 2567 193 143
/u/ rs F1 rs F2 rs F3 rs F0 rs D cs F1 cs F2 cs F3 cs F0 cs D N 10 10 10 10 10 11 11 11 11 11 mean 304 714 2145 155 154 388 907 2252 163 69 sd 18 37 99 11 22 56 138 183 20 15 c.v. 0.06 0.05 0.05 0.07 0.14 0.14 0.15 0.08 0.12 0.21 Min 280 661 1970 139 118 490 1101 2483 187 91 Max 344 766 2312 173 192 331 674 1874 125 49 range 64 105 342 34 74 159 427 609 62 42 . Speaker V: /i/ rs F1 rs F2 rs F3 rs F0 rs D cs F1 cs F2 cs F3 cs F0 cs D N 23 23 23 23 23 23 23 22 19 23 mean 298 2248 2834 108 116 334 2051 2556 124 100 sd 33 138 181 22 33 45 112 166 27 40 c.v. 0.11 0.06 0.06 0.20 0.28 0.13 0.05 0.06 0.22 0.40 Min 218 2090 2339 75 61 269 1828 2365 85 41 Max 355 2486 3134 150 213 446 2205 3109 200 174 range 137 396 795 75 152 177 377 744 115 133 /e/ rs F1 rs F2 rs F3 rs F0 rs D cs F1 cs F2 cs F3 cs F0 cs D N 15 15 15 15 15 21 21 21 15 21 mean 411 2048 2637 108 158 386 1932 2443 117 79 sd 30 105 109 25 24 37 85 70 23 47 c.v. 0.07 0.05 0.04 0.23 0.15 0.10 0.04 0.03 0.19 0.59 Min 336 1910 2432 87 128 297 1805 2252 78 34 Max 457 2338 2841 189 206 446 2148 2559 156 232 range 121 428 409 102 78 149 343 307 78 198 /E/ rs F1 rs F2 rs F3 rs F0 rs D cs F1 cs F2 cs F3 cs F0 cs D N 33 33 33 33 33 43 43 42 35 43 mean 663 1754 2480 104 160 554 1657 2347 117 108 sd 49 71 150 11 28 86 132 134 30 52 c.v. 0.07 0.04 0.06 0.11 0.17 0.16 0.08 0.06 0.26 0.48 Min 561 1575 2141 86 91 365 1348 2056 79 31 Max 782 1898 2770 126 205 720 1976 2593 206 221 range 221 323 629 40 114 355 628 537 127 190 /a/ rs F1 rs F2 rs F3 rs F0 rs D cs F1 cs F2 cs F3 cs F0 cs D N 58 58 58 58 58 56 56 52 46 56 mean 814 1248 2343 106 168 690 1303 2356 119 124 sd 57 54 228 10 29 97 131 150 28 46 c.v. 0.07 0.04 0.10 0.09 0.17 0.14 0.10 0.06 0.24 0.38 Min 596 1082 1792 85 80 468 1062 2045 71 39 Max 937 1353 2724 133 233 909 1668 2719 185 232 range 341 271 932 48 153 441 606 674 114 193 /•/ rs F1 rs F2 rs F3 rs F0 rs D cs F1 cs F2 cs F3 cs F0 cs D N 23 23 23 23 23 18 18 16 15 18 mean 637 1017 2289 105 165 580 1124 2299 117 124 sd 43 65 216 10 25 75 115 120 30 58 c.v. 0.07 0.06 0.09 0.09 0.15 0.13 0.10 0.05 0.25 0.47
Min 571 855 1893 90 105 411 914 2056 73 44 Max 740 1124 2662 124 213 688 1371 2559 167 253 range 169 269 769 34 108 277 457 503 94 209 /o/ rs F1 rs F2 rs F3 rs F0 rs D cs F1 cs F2 cs F3 cs F0 cs D N 14 14 14 14 14 18 18 16 13 18 mean 436 954 2237 108 157 432 1017 2327 121 100 sd 20 68 104 16 27 40 157 167 18 42 c.v. 0.05 0.07 0.05 0.15 0.17 0.09 0.15 0.07 0.15 0.42 Min 406 854 2045 79 99 367 679 2000 84 43 Max 468 1094 2393 137 205 491 1382 2559 149 176 range 62 240 348 58 106 124 703 559 65 133 /u/ rs F1 rs F2 rs F3 rs F0 rs D cs F1 cs F2 cs F3 cs F0 cs D N 12 12 12 12 12 14 14 13 11 14 mean 311 775 2182 115 135 349 882 2285 129 157 sd 27 112 89 22 23 48 98 131 17 53 c.v. 0.09 0.14 0.04 0.19 0.17 0.14 0.11 0.06 0.13 0.56 Min 268 635 2042 77 92 280 743 2058 106 35 Max 347 936 2337 146 179 434 1047 2468 155 192 range 79 301 295 69 87 154 304 410 49 157
d. Tables 24-37. Average values of F1, F2, F3, F0, D in Hz of connected speech prominent
tokens compared with connected speech non -prominent tokens . Speaker S: /i/ p F1 p F2 p F3 p F0 p D n-p F1 n-p F2 n-p F3 n-p F0 n-p D N 24 24 21 24 24 16 16 15 16 16 mean 348 2269 2934 136 100 330 2264 2938 161 67 sd 58 218 430 22 21 41 202 298 41 23 c.v. 0.17 0.09 0.15 0.16 0.21 0.12 0.09 0.10 0.25 0.34 Min 228 1634 2411 106 49 270 1923 2567 117 31 Max 499 2714 3976 180 146 404 2583 3845 279 106 range 271 1080 1565 74 97 134 660 1278 162 75 /e/ p F1 p F2 p F3 p F0 p D n-p F1 n-p F2 n-p F3 n-p F0 n-p D N 3 3 1 3 3 10 10 7 9 10 mean 406 2210 2567 111 111 428 2052 2645 157 63 sd 29 85 . 13 17 66 168 266 32 17 c.v. 0.07 0.04 . 0.12 0.15 0.15 0.08 0.10 0.20 0.28 Min 381 2140 . 102 97 363 1744 2354 122 39 Max 438 2305 . 126 129 567 2241 3165 227 84 range 57 165 . 24 32 204 497 811 105 45 /E/ p F1 p F2 p F3 p F0 p D n-p F1 n-p F2 n-p F3 n-p F0 n-p D N 12 12 10 11 12 21 21 19 19 21 mean 586 1826 2677 130 143 549 1877 2527 134 97 sd 42 177 156 62 29 71 109 148 26 40 c.v. 0.07 0.10 0.06 0.17 0.20 0.13 0.06 0.06 0.19 0.41 Min 526 1497 2399 102 83 417 1710 2224 87 31 Max 674 2036 2835 187 173 647 2045 2822 197 163 range 148 539 436 85 90 230 335 598 110 132
/a/ p F1 p F2 p F3 p F0 p D n-p F1 n-p F2 n-p F3 n-p F0 n-p D N 7 7 4 7 7 29 29 28 29 29 mean 724 1353 2493 134 122 682 1337 2444 132 90 sd 178 140 113 22 39 141 127 183 17 27 c.v. 0.24 0.10 0.04 0.16 0.31 0.21 0.09 0.07 0.13 0.30 Min 507 1116 2395 107 62 484 1104 2060 102 55 Max 990 1552 2655 169 169 932 1649 2746 163 142 range 483 436 260 62 107 448 545 686 61 87 /•/ p F1 p F2 p F3 p F0 p D n-p F1 n-p F2 n-p F3 n-p F0 n-p D N 7 7 7 7 7 15 15 14 14 15 mean 573 1056 2566 425 133 545 1117 2423 142 82 sd 80 130 179 37 45 58 158 208 24 29 c.v. 0.14 0.12 0.07 0.25 0.34 0.11 0.14 0.09 0.17 0.35 Min 507 925 2220 118 93 447 880 2049 116 44 Max 735 1272 2735 217 223 666 1451 2738 193 154 range 228 347 515 99 130 219 571 689 77 110 /o/ p F1 p F2 p F3 p F0 p D n-p F1 n-p F2 n-p F3 n-p F0 n-p D N 6 6 6 6 6 7 7 5 6 7 mean 468 867 2332 340 83 464 1230 2281 150 48 sd 54 112 146 20 33 87 388 231 23 15 c.v. 0.12 0.13 0.06 0.15 0.40 0.19 0.32 0.10 0.15 0.31 Min 411 754 2125 100 48 311 921 2030 129 30 Max 526 1028 2567 154 143 571 1855 2515 193 71 range 115 274 442 54 95 260 934 485 64 41 /u/ p F1 p F2 p F3 p F0 p D n-p F1 n-p F2 n-p F3 n-p F0 n-p D N 3 3 3 3 3 8 8 8 8 8 mean 363 947 2327 168 82 398 892 2225 161 64 sd 4 137 199 15 5 64 144 182 23 14 c.v. 0.01 0.14 0.09 0.09 0.06 0.16 0.16 0.08 0.14 0.22 Min 360 838 2102 151 77 331 674 1874 125 49 Max 367 1101 2483 180 87 490 1097 2441 187 91 range 7 263 381 29 10 159 423 567 62 42 . Speaker V: /i/ p F1 p F2 p F3 p F0 p D n-p F1 n-p F2 n-p F3 n-p F0 n-p D N 11 11 11 9 11 12 12 11 10 12 mean 359 2038 2537 140 104 312 2064 2575 110 97 sd 39 116 98 31 33 39 112 218 13 47 c.v. 0.11 0.06 0.04 0.22 0.32 0.12 0.05 0.08 0.12 0.49 Min 308 1828 2399 98 49 269 1874 2365 85 41 Max 446 2159 2719 200 146 388 2205 3109 127 174 range 138 331 320 102 97 119 331 744 42 133 /e/ p F1 p F2 p F3 p F0 p D n-p F1 n-p F2 n-p F3 n-p F0 n-p D N 9 9 9 7 9 12 12 12 8 12 mean 382 1962 2440 117 96 390 1909 2446 117 66 sd 37 103 82 25 65 39 64 64 22 23 c.v. 0.10 0.05 0.03 0.21 0.67 0.10 0.03 0.03 0.19 0.35 Min 315 1817 2252 87 34 297 1805 2353 78 46 Max 433 2148 2525 156 232 446 2045 2559 150 106
range 118 331 273 69 198 149 240 206 72 60 /E/ p F1 p F2 p F3 p F0 p D n-p F1 n-p F2 n-p F3 n-p F0 n-p D N 17 17 17 16 17 26 26 25 19 26 mean 602 1662 2365 113 139 522 1654 2335 121 88 sd 69 112 131 30 54 83 145 137 30 39 c.v. 0.11 0.07 0.05 0.27 0.39 0.16 0.09 0.06 0.25 0.44 Min 480 1542 2068 79 50 365 1348 2056 80 31 Max 720 1976 2536 163 221 685 1875 2593 206 204 range 240 434 468 84 171 320 527 537 126 173 /a/ p F1 p F2 p F3 p F0 p D n-p F1 n-p F2 n-p F3 n-p F0 n-p D N 24 24 24 22 24 32 32 28 24 32 mean 717 1290 2368 120 148 670 1313 2345 119 105 sd 93 107 106 29 40 97 147 181 28 42 c.v. 0.13 0.08 0.04 0.24 0.27 0.14 0.11 0.07 0.24 0.40 Min 503 1097 2136 71 39 468 1062 2045 78 43 Max 909 1433 2548 175 232 844 1668 2719 185 204 range 406 336 412 104 193 376 606 674 107 161 /•/ p F1 p F2 p F3 p F0 p D n-p F1 n-p F2 n-p F3 n-p F0 n-p D N 9 9 9 9 9 9 9 7 6 9 mean 600 1129 2275 115 162 560 1119 2331 119 87 sd 71 89 121 36 45 77 142 121 18 46 c.v. 0.12 0.08 0.05 0.32 0.28 0.14 0.13 0.05 0.15 0.53 Min 489 1004 2056 73 112 411 914 2205 96 44 Max 688 1281 2399 167 253 685 1371 2559 144 182 range 199 277 343 94 141 274 457 354 48 138 /o/ p F1 p F2 p F3 p F0 p D n-p F1 n-p F2 n-p F3 n-p F0 n-p D N 10 10 9 7 10 8 8 7 6 8 mean 440 958 2314 120 129 421 1091 2343 122 64 sd 33 124 138 24 32 47 170 208 10 16 c.v. 0.07 0.13 0.06 0.20 0.25 0.11 0.15 0.09 0.08 0.25 Min 377 679 2079 84 61 367 891 2000 112 43 Max 490 1177 2559 149 176 491 1382 2548 139 89 range 113 498 480 65 115 124 491 548 27 46 /u/ p F1 p F2 p F3 p F0 p D n-p F1 n-p F2 n-p F3 n-p F0 n-p D N 4 4 3 4 4 10 10 10 7 10 mean 361 897 2169 123 110 344 876 2320 133 87 sd 69 50 96 19 54 40 114 122 17 54 c.v. 0.19 0.06 0.04 0.15 0.49 0.12 0.13 0.05 0.12 0.62 Min 280 857 2058 106 51 297 743 2079 109 35 Max 434 971 2228 150 180 400 1047 2468 155 192 range 154 114 170 44 129 103 304 389 46 157