Exploring the relevance and extent of small airways dysfunction in asthma: AssessmenT of smalL Airways involvemeNT In aSthma, the ATLANTIS study
Postma DS1, Brightling C2, Baldi S2,11, Van den Berge M1, Fabbri LM3,4, Gagnatelli A5, Papi A6,
Van der Molen T7, Rabe KF8, Siddiqui S2, Singh D9, Nicolini G5, Kraft M10 and the ATLANTIS
study group*
Collaborators
* Badorrek P, Boersma W, Broeders M, Chetta A, Cukier A, D’Amato M, Djukanovic R, Foschino MP, Gessner C, Hanania N, Martin R, Milleri S, Olivenstein R, Paggiaro P Pizzichini E, Plaza Moral V, Scichilone N, Schilz R, Spanevello A, Stelmach R, Vroegop J, Usmani OS, Zhang Q.
Author Information
1. University of Groningen, University Medical Center Groningen, Department of Pulmonology, Groningen Research Institute for Asthma and COPD, Groningen, The
Netherlands University of Groningen, University Medical Center Groningen, Department of Pulmonology, Groningen Research institute for Asthma and COPD, Groningen, The
Netherlands
2. Institute for Lung Health, NIHR Biomedical Research Centre, University of Leicester, UK; Department of Global Clinical Development, Chiesi SAS, Bois Colombes, France
3. Research Centre on Asthma and COPD, University of Ferrara, Ferrara, Italy 4. COPD Centre, Sahlgrenska University Hospital, Gothenburg
5. Department of Global Clinical Development, Chiesi Farmaceutici SpA, Parma, Italy 6. Research Centre on Asthma and COPD, University of Ferrara, Ferrara, Italy
7. University of Groningen, University Medical Center Groningen, Department of General Practice, Groningen Research Institute for Asthma and COPD, Groningen, The Netherlands 8. Lungen Clinic, Grosshansdorf, and Department of Medicine, Christian Albrechts University,
Kiel, Germany. Airway Research Center North in the German Center for Lung Research (DZL), Germany.
9. Centre for Respiratory Medicine and Allergy, University of Manchester, University Hospital of South Manchester, Manchester, UK.
10. University of Arizona College of Medicine, Department of Medicine, Tucson, Arizona, United States
11. Department of Global Clinical Development, Chiesi SAS, Bois Colombes, France
Link to full study:
Summary
Background
Small airways dysfunction (SAD) is well-recognized in asthma, yet its role in asthma severity and asthma control is unclear.
Methods
This multinational observational study investigated participants without and with asthma (GINA severity stage 1-5). They underwent spirometry, body plethysmography, impulse oscillometry (IOS), Multiple Breath Nitrogen Washout (MBNW), computed tomography (CT) and questionnaires. Structural equation modeling (SEM) was applied in asthma to assess the contribution of all physiological and CT parameters to SAD. With SEM, we defined a clinical-SAD and CT-SAD score. Asthma subjects were classified in SAD groups using model-based clustering. Asthma severity, control and health care utilization in the past year were compared with the SAD scores and SAD groups.
Findings
We investigated 773 asthma and 99 control participants (median [interquartiles] age 46 [34, 54] and 41 [29, 52] years, 58% and 57% females, respectively). All physiologic measures contributed to the clinical SAD model with SEM analysis. SAD prevalence was dependent on the measure used and lowest with MBNW Sacin that reflects ventilation heterogeneity in the most peripheral, pre-acinar/acinar airways. IOS and spirometry, reflecting dysfunction of small-to-mid-sized airways, contributed most to the Clinical-SAD score and SAD Groups. Clinical-SAD Group1 (n=452) had “milder“ SAD, i.e. comparable MBNW Sacin (ventilation heterogeneity in pre-acinar/acinar airways) values with controls. Group2 (n=312) had more abnormal physiologic SAD measures than Group1, particularly IOS and spirometry, and more severe asthma (asthma control, treatments, exacerbations,
quality of life). Clinical-SAD scores were higher in Group2 (“more severe” SAD) and related to asthma control, severity, and exacerbations. Clinical-SAD and CT-SAD scores did not significantly correlate.
Interpretation
SAD has multiple components and physiologic parameters from spirometry, body plethysmography, IOS and MBNW contribute to SAD. SAD is present across all asthma severity and particularly in severe disease. The clinical classification of SAD in two groups, i.e. a “milder” and “more severe” SAD group, by the easy-to-conduct measures IOS and spirometry, is meaningful given its association with GINA asthma severity stages, asthma control, quality of life, and exacerbations.
Research in context
Evidence before this study
Small airways dysfunction (SAD) has been understudied, though it significantly contributes to airway obstruction, a hallmark of asthma. So far, studies on the role of SAD in asthma have been performed in small sample sizes and/or subgroups of asthma. Moreover, these studies investigated only a subset of available potential measurements of SAD and did not include both spirometry, body plethysmography, impulse oscillometry (IOS), Multiple Breath Nitrogen Washout (MBNW), CT scans and questionnaires.
Added value of this study
This is the largest study to date involving 773 evaluable asthma patients and 99 controls without airway obstruction specifically designed to determine the prevalence and impact of small airways dysfunction SAD in asthma. The study shows that SAD is present in asthma across all stages of severity, with highest prevalence in GINA 5. We were able to define a SAD score from a combination of lung function measurements that reflects the amount of physiological small airways impairment in asthma. The score associated significantly with measures of asthma control, history of exacerbations and disease severity. Model-based clustering delineated two clinical SAD groups that differed in age, duration of asthma, and disease severity. Of interest, values of Sacin, that measures ventilation heterogeneity in pre-acinar/acinar airways, were in the normal range in Group1. The difference between Clinical SAD Group1 and Group2 was particularly clear with clinically available SAD measurements, such as IOS and spirometry, followed by FEV1,while differences weresmall with CT
SAD parameters. In summary, we can cluster asthma patients in two subgroups based on SAD measured with easy-to-conduct, clinically applicable measures.
Small airways dysfunction (SAD) has been understudied in asthma. Our results show the clinical relevance of SAD, which is present across all severity stages of asthma. It is particularly present in severe disease, likely reflecting structural lung changes that are not responsive toe the use of oral corticosteroids and/or high dose inhaled corticosteroids. Moreover, SAD relates to asthma stability, severity, quality of life, exacerbation rates and health care utilization and can be delineated by easy-to-conduct, clinically applicable measures such as IOS and spirometry. Therefore, this aspect of asthma needs further consideration in the management of the disease.
Introduction
Asthma is a prevalent obstructive airway disease that affects the entire bronchial tree. The small airways, defined by a diameter <2 mm and referred to as the “silent zone” of the lungs, contribute to the resistance in the airways of patients with obstructive airways disease1. This is of clinical
importance since small airways can be inflamed in asthma and hence narrowed2-4. Small airway
narrowing can also occur due to smooth muscle contraction after inhaling allergic and non-allergic irritants. Moreover, remodeling can affect small airway wall stiffness, thereby changing their distensibility5.
Small airways dysfunction (SAD) has been postulated to exist at all severities of asthma, whereas some studies suggest that the prevalence increases with asthma severity 6,1. However, it is still not
clear what proportion of asthma patients suffers from SAD, and which tests or combination of tests best defines it. Lack of best practice is due to the fact that published studies investigating the small airways in asthma included only small-sized and/or relatively homogeneous populations regarding asthma severity, or only tested one or a few physiologic SAD measures 6-8. The ATLANTIS
(AssessmenT of smalL Airways involvemeNT In aSthma) study subjected a large asthma cohort to all available, clinically applicable, potential SAD tests, including spirometry, body
plethysmography (e.g. residual volume), impulse oscillometry (IOS), and Multiple Breath Nitrogen Washout (MBNW) and CT scan. The physiological tests may reflect abnormalities in different parts of the bronchial tree or different aspects of small airways dysfunction, providing different perspectives on SAD9,10. Lung imaging by CT scan can provide additional insight regarding SAD,
but the relationship with physiologic measures of SAD in asthma has not been studied extensively and only in small groups.
The ATLANTIS study assessed which (combination of) biomarkers, physiological testing and imaging markers best measures the presence and extent of SAD in asthma. It builds on both a
baseline and 1-year follow-up phase. We assessed SAD through a series of baseline measurements using published criteria defining small airways dysfunction for each test, both for physiological and CT measures. The final result of the model-building process is a score defining to what extent SAD is present in each individual patient
,
a score that was built from baseline data and validated at follow-up. With this score, its usefulness for prediction of asthma severity, asthma control, quality of life and history of exacerbations was evaluatedHere we present the clinical baseline data of the ATLANTIS study. The main aim is to identify which combination of biomarkers, physiologic testing and imaging approaches best measures the presence and extent of SAD in asthma cross-sectionally and their relationship with asthma severity, control, quality of life and history of exacerbations over time9. The study allowed us to develop
novel predicted, upper limit of normal (ULN) and lower limit of normal (LLN) values of physiological parameters infrequently studied (e.g. IOS).
Methods Participants
Participants were recruited (2014-2016) from general practitioners, chest physician’s databases and by advertisements in 29 centers across 9 countries worldwide. Inclusion criteria were: 1) age 18-65 years; 2) clinical asthma diagnosis > 6 months, confirmed by a chest physician according to GINA 201211 and supported by objective evidence of any of the following at the baseline visit or in the
previous 5 years: a) positive airway hyperresponsiveness to methacholine, or b) positive reversibility, defined as ΔFEV1≥ 12% and ≥ 200 mL over baseline FEV1 within 30 minutes after inhaling 400 μg
of salbutamol pMDI with or without a spacer or c) Peak Expiratory Flow variability (i.e. highest - lowest value over the day/mean value of the two, ×100) >20%, measured during 7 days or d) documented reversibility after a cycle (e.g. 4 weeks) of maintenance anti-asthma treatment; 3) stable asthma on any previous regular asthma treatment (“rescue” β2-agonists alone included) at a stable dose for > 8 weeks before baseline; 4) lifetime smoking ≤ 10 pack-years. Main exclusion criteria were a COPD diagnosis confirmed by a chest physician and an asthma exacerbation during 8 weeks before baseline.
Controls were included based on 1) age 18-65 years; 2) no respiratory symptoms compatible with asthma or COPD in the past 2 years; 3) normal spirometry: baseline FEV1≥ 80%predicted,
FEV1/Forced Vital Capacity (FVC)> LLN (lower limit of normal); 4) normal airways responsiveness:
PC20≥ 16 mg/mL, PD20≥ 1.4 mg; 5) lifetime smoking ≤ 10 pack-years. Diagnosed upper/lower respiratory tract diseases were exclusion criteria. The Medical Ethics Committee of each center approved the protocol; all patients gave written informed consent.
Study design and procedures
Participants were followed for 1 year with 6-month clinic and 3-month telephone follow-ups9. The
hyperresponsiveness, MBNW, IOS, body plethysmography, CT, questionnaires, blood tests, and health care utilization are described in the Supplement. Medications during an eight-week period before evaluation were used to assess GINA severity11. Potential indices of SAD used, with
hypothetical location in the airways between brackets, were: % fall in FVC during hyperresponsiveness testing (% fall FVC, air trapping in peripheral airways), spirometry: Forced Expiratory Flow (FEF)25-75 and FEF50, both corrected for FVC (conducting small airways), body
plethysmography: Residual Volume/Total Lung Capacity (RV/TLC) and Functional Residual Capacity (FRC) %predicted (air trapping due to obstruction in both central and peripheral airways), IOS: R5-R20 (heterogeneity in resistance of small-to-mid-sized airways, AX and X5 (reactance or distensibility of more central, conducting small airways), MBNW: Scond and Sacin (gas exchange measures, assessing convectional ventilation heterogeneity in peripheral conducting (Scond) and pre-acinar/acinar (Sacin) airways). Alveolar NO was not incorporated in this analysis since it was only available in a subset of participants (See Supplement). Indices of “large airways dysfunction”, which may also capture small airways abnormalities, were FEV1%predicted, FEV1/FVC, IVC, FeNO, R20,
PC20, PD20 and 3 severity categories of airway hyperresponsiveness (Supplement).
Computed tomography
Volumetric whole lung scans were obtained at full inspiration (near total lung capacity) and at end of expiration, near FRC. Scans were analyzed by a single observer (SB) using semi-automated software, Apollo (VIDA Diagnostics, Iowa), with various quality control parameters12,13. The supplement
describes CT acquisition, quantitative airway morphometry and lung densitometry. SAD parameters used were: ex- and inspiratory Mean Lung Density and their ratio (E/I MLD), ex- and inspiratory lung volume and their ratio (E/I LV), expiratory Voxel Index (VI-856) and inspiratory VI-950 (% of Voxels with CT numbers <-856 and <-950 Hounsfield Units respectively, inspiratory Percentile15, Inspiratory median Lumen area, Wall area (WA) and Total area, these latter three divided by body
surface area (BSA), inspiratory median percentage WA, and inspiratory Pi10 and Po20%WA (hypothetical airway with internal perimeter of 10 mm and outer perimeter of 20 mm respectively). Statistical analyses
Detailed statistical information, including power analysis14, is provided in the Supplement. The
following variables reflecting SAD were used in the clinical SAD analysis: FEF50/FVC, FEF 25-75/FVC, FEV1%predicted, FEV1/FVC, IVC%predicted, % fall FVC at PC20 or PD20, RV/TLC
%predicted, FRC%predicted, R5-R20, X5, AX, Scond, Sacin. For CT SAD analysis, variables were: MLD ratio, Lung Volume ratio, VI-856, Pi10, Po20%WA.
Several steps were performed for clinical SAD and CT SAD SEM analysis separately15. A correlation
matrix evaluated correlations among observed variables, high correlations indicating presence of underlying latent variables. An exploratory factor analysis for observed variables was performed to identify the underlying SAD factor structure. The final underlying SAD factor structure was tested by specifying a confirmatory factor model. Once the measurement model was set and fit the data properly, it was used to classify each patient into SAD groups, using model-based clustering. The SAD Groups and SAD scores from the clinical SAD and the CT-scan SAD model were compared, evaluating the rate of agreement, using Chi-square and Pearson’s correlation tests. The clinical SAD model was additionally tested in the subgroup with a CT scan, by adding the CT scan variables to the model. Full information maximum likelihood (FIML) method was used for dealing with missing data in SEM analysis16.
Relationships of physiologic SAD variables with asthma severity, control and healthcare utilization were analyzed by Poisson regression. Continuous prediction equations, their lower- and upper limit of normal (LLN and ULN) from the literature17 and from formulas based on ATLANTIS controls are
Statistical Analysis Systems (SAS®) Software (release 9.2) and Mplus Version 7.4 on a Windows 7 operating system.
Results
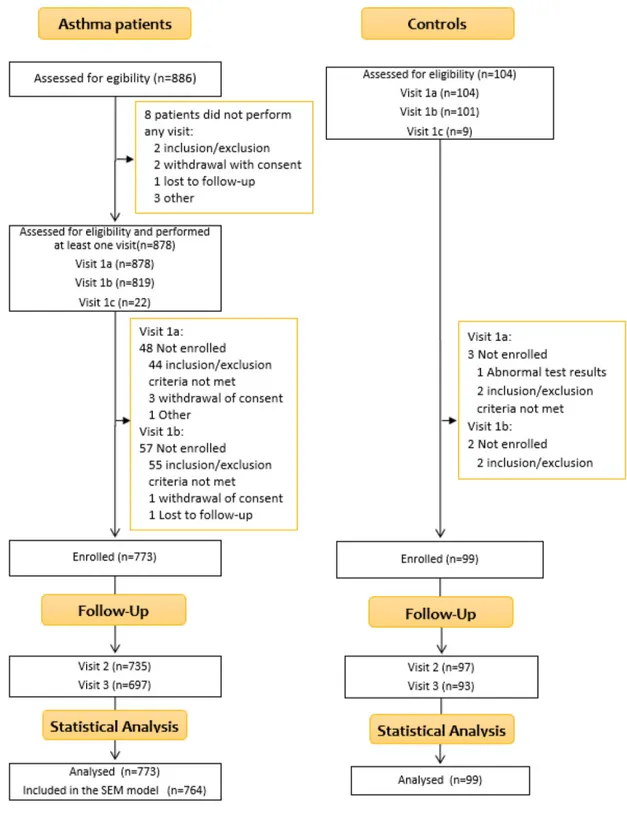
The main reason for screening failure was not fulfilling inclusion/exclusion criteria (n=99, Figure 1). Participants
Baseline characteristics are shown in Table 1, Table 2 (asthma only) and Supplemental Table 2. Gender, age and smoking habits were comparable between asthma and control participants. Asthma participants demonstrated higher BMI, heart rate, blood pressure, blood cell counts, and prevalence of atopy. Hyperresponsiveness was only present in asthma participants. All physiologic parameters were significantly worse in asthma. Asthma participants had lower MLD expiratory values, inspiratory airway lumen, wall, and total area, also when divided by BSA (body surface area) on CT. Asthma participants had a moderately severe health status impairment (Table 2) and lower lung-related quality of life (higher EuroQol-5Dim-5Levels score) than controls, median (Q1;Q3) value of 95.0 (90.0;100.0) versus 80.0 (70.0;90.0).
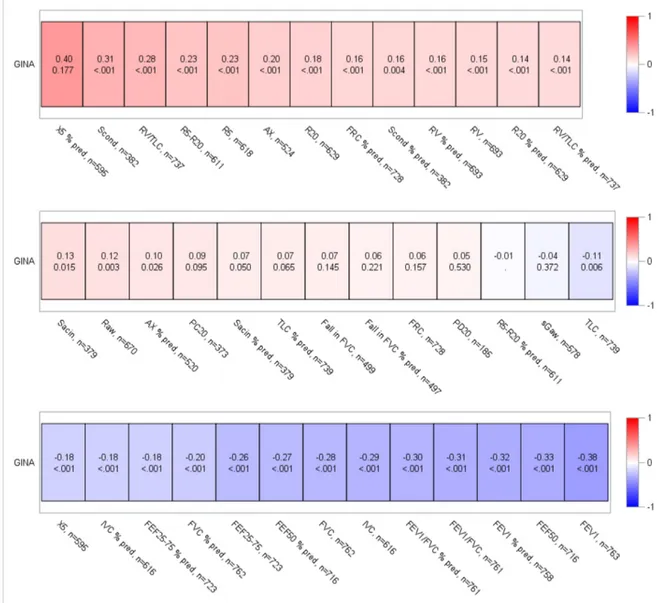
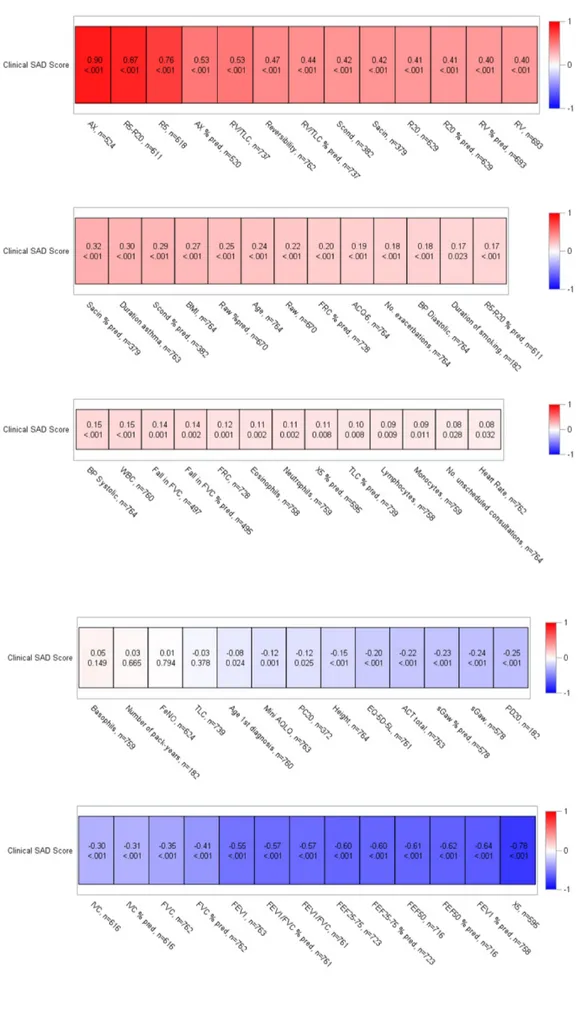
Association of physiologic parameters with asthma severity, control and health care utilization X5, Scond, RV/TLC, R5-R20 and R5 values (Figure 2A) showed the highest positive correlations with GINA severity15. GINA severity was also associated, as expected, with lower FEV1, FEF50, and
FEV1/FVC values. Table 3 shows that GINA5 had the highest SAD prevalence rate for every physiologic variable (measurements >ULN or <LLN). Sacin had the least SAD prevalence rate in all GINA stages, the lowest prevalence being with GINA1 (12%), rather similar, higher prevalences in GINA2-4 (18-19-20%), and highest in GINA5 (41%). This contrasts with other SAD variables, where prevalences either remain constant over the GINA stages (% fall FVC), continuously increase from GINA1-GINA5 (body plethysmography), or increase in steps, e.g. Scond and FEF25-75 showed lowest prevalences in GINA1-2, higher in GINA3-4 and highest in GINA5. R5-R20 and AX showed somewhat comparable rates in GINA1-3, higher in GINA4 and highest in GINA5 (Table 3). Sacin
also contrasted with <LLN prevalence distributions in FEV1, i.e. GINA1-GINA5 26%-29%-36%-47%-72%.
A lower Asthma Control Test (ACT) score was particularly associated with higher AX and R5 and lower FVC and FEV1 (Figure 2B).
For exacerbations in the past year, highest positive correlations were with RV/TLC, R5-R20, AX and Sacin and highest negative correlations with FEV1, FVC, IVC, FEF25-75, FEF50 (Figure 2C). The
number of exacerbations was independently predicted by SAD parameters from spirometry, IOS, body plethysmography, hyperresponsiveness severity, female gender and height (Table 4). There was also a negative association with Raw. Independent parameters for unscheduled consultation visits were FEV1, hyperinflation with body plethysmography, hyperresponsiveness severity, and female
gender (Table 4).
Prevalence of LAD and SAD in asthma
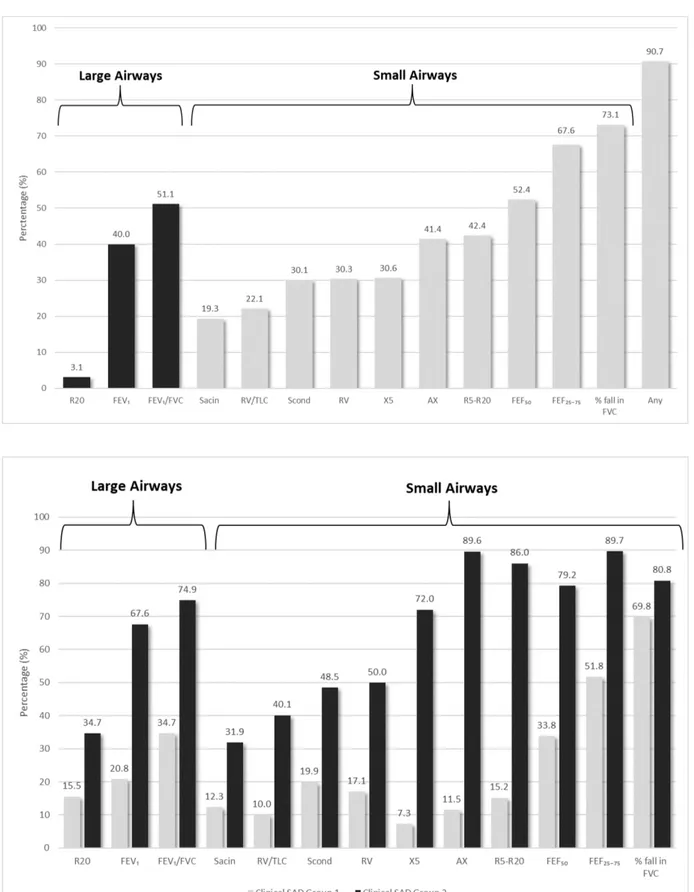
Figure 3 (upper panel) shows the prevalence rates of large and small airways dysfunction, based on LLN and ULN. Sacin had the lowest SAD prevalence (19.2%), % fall FVC the highest (73.1%). SAD Model
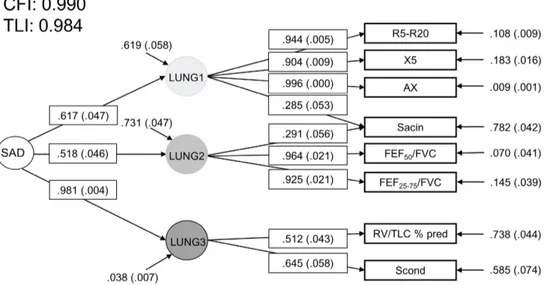
Figure 4 shows the final clinical SAD model based on cross-sectional data. It presents both the loadings to the three latent variables, and the goodness of fit values (Supplemental methods), showing good coherence of this model to SAD. IOS parameters R5-R20, AX and X5 loaded to the first latent variable, FEF50 and FEF25-75 both corrected for FVC, to the second latent variable, while Sacin
(MBNW) loaded both to the first and second latent variable. The lung volume parameter RV/TLC %predicted and Scond (MBNW) loaded to the third latent variable. Hyperresponsiveness was only tested at the first visit, hence could not be taken into account in the longitudinal design of the SAD SEM model. Therefore, we also analyzed the clinical SAD model at baseline including hyperresponsiveness, and the % fall FVC loaded on the third latent variable without much change in
goodness of fit values. The baseline model without and with % fall FVC correlated highly (r=0.99; Supplemental Figure 2A). Since the cross-sectional SAD model with and without % fall FVC were almost identical, the model without % fall FVC was tested longitudinally; the same model structure was confirmed at all visits (Supplemental Figure 2B).
Correlations of clinical SAD score with physiologic and clinical parameters
A higher SAD score reflects more severe SAD. The highest positive and negative correlations (r > 0.60 and r < -0.60) of the SAD score existed with physiologic parameters on which the score was based, i.e. IOS parameters AX, R5-R20, and R5 (positively) and X5, spirometric parameters FEF 25-75 and FEF50 (negatively), next being FEV1 %predicted (Figure 5). The highest correlations of
non-physiological parameters with the SAD score were duration of asthma, ACQ-6 and number of exacerbations (positively), ACT, Mini AQLQ total and EQ-5D-5L (negatively). Clinical SAD scores increased with higher asthma severity, mean SAD score in GINA1-5 being -0.143, -0.035, -0.048, +0.071 and +0.239 (ANOVA p <0.0001).
Model-based clustering defined clinical SAD Groups
Model-based clustering defined two clinical SAD groups, Group1 including 452 patients, Group2 312 patients (Table 3 and Supplemental Table 3 present clinical characteristics). Overall, the 2 clinical SAD Groups were similar regarding age of asthma onset, sex ratio, FeNO, atopy, and smoking habits, while duration of smoking was higher in Group2 (Table 5). Sacin values were comparable between Group1 and the controls, whereas Group2 had significantly higher values than both Group1 and controls. Clinical SAD Group2 was somewhat older, demonstrated higher blood pressure, heart rate and BMI, and a longer asthma duration. Additionally, Group2 had more severe asthma than Group1, according to GINA severity, ACT, ACQ, LABA/ICS use, hyperresponsiveness, blood inflammation (eosinophils), quality of life and health care utilization. All physiologic parameters were worse in
clinical SAD Group2; the two groups were best separated by SAD parameters from IOS followed by spirometry, and additionally FEV1 (Figure 3).
CT scan factors in SAD
CT scans were analyzed in 294 patients (with comparable asthma severity as the non-CT group, Supplemental Table 3). The SEM model provided three factors in CT that contributed to SAD: MLD insp/exp ratio, Lung volume ins/exp ratio and VI-856 (Supplemental Figure 2D). The correlations of the CT SAD score with physiologic and clinical parameters, comparison of CT SAD groups, and additional Clinical SAD analysis in patients who had a CT scan are presented in the Supplement. Relationship between Clinical and CT SAD scores
The Clinical SAD and CT SAD scores showed a significant, weak correlation (r=0.28). There was no significant overlap between the clinical SAD and CT SAD Groups (p=0.103, Supplemental Table 5).
Discussion
This large clinical study shows the clinical relevance of small airway dysfunction for asthma, since SAD is present across all severities and particularly in more severe asthma. ATLANTIS was specifically designed to determine the prevalence and impact of SAD in asthma and has performed the most comprehensive evaluation of SAD to date using both physiological and imaging tools. We show that the prevalence of SAD depends on the physiologic measure used, i.e. localization and type of airway narrowing. Of importance, no single variable defines SAD, but IOS, MBNW, lung volumes and spirometry all contribute. For clinical practice, it is important to highlight that SAD associates with GINA severity and –independently- with history of exacerbations over time, particularly when measured by IOS, spirometry and body plethysmography. Moreover, the poorest asthma control was present in the group with the worst clinical SAD score.
Strengths of our study are the large group of asthma patients covering the full severity spectrum and the extensive work-up and quality and experience of the centers. ATLANTIS is a multi-center international study, therefore we feel our results are reliable and applicable to multiple populations. We also included smokers, a factor that by itself may induce some SAD. We felt it important that our study reflects the larger asthma and non-asthma population globally for generalizability, and thus not restricts the impact of our findings. The controls had comparable age, sex ratio and particularly smoking habits as the asthma population, which provided novel LLN and ULN values for physiological parameters infrequently studied, such as IOS and MBNW. We acknowledge that a larger control group might have improved precision of these predicted, LLN and ULN values, and this will be also partially overcome when we add the longitudinal data in the future.
We recognize that a quality check of the maneuver to get optimal phase III slope in the MBNW test18
is key to validity of the measurements, which we have carefully ensured in the present study. The finding of some measurements of ventilation heterogeneity in pre-acinar/acinar airways (Sacin) in the
normal range is not in contrast with the presence of airway dysfunction in Group1, as the body of the available literature on ventilation heterogeneity in adult asthma19-27 reveals a variable contribution of
conducting versus acinar lung regions to treatment response, and consistency in the reversibility towards normal values after exacerbations19. Particularly, the persistent derangement of ventilation
in conducting airways (Scond) seems more related to airway remodeling, exacerbations, and hyperresponsiveness, whereas the reversible derangement in acinar airway ventilation mainly reflects asthma severity28. Accordingly, the worst clinical SAD score was present in the group with the
poorest asthma control and higher prevalence in GINA 4 and 5.
Another limitation of the study is that CT scans were not available in all participants, limiting numbers for analyses. However, this allowed us to demonstrate that the clinical SAD model in the full asthma cohort could be replicated in the smaller group with CTs. Future work will expand our analyses by performing parametric response mapping (PRM)29, a CT voxel-based imaging biomarker tool which
uses dynamic image registration between paired inspiratory and expiratory scans to quantify 'functional small airways disease’. A potential limitation is that there was a somewhat higher age in the asthma than control participants, yet this was a small difference (mean age of 46 (34-54) vs 41 (29-52) years respectively) that is likely not of clinical significance, and we adjusted for age in all analyses. We cannot put our clinical SAD score forward as a clinically applicable tool as yet, since this is a cross-sectional study. The score already significantly associates with number of exacerbations, asthma severity and control, and the longitudinal phase of the study will elucidate whether it also predicts future changes in these clinical outcomes. For the same reason we cannot put the “best parameters“ of SAD forward yet, since this also needs prospective data. Additionally, an SADT will be developed to assess SAD by questionnaire9, which may be easily applicable in the
clinic, as MBNW and body plethysmography are not available for all routine settings. Our article did not report on SAD with regard to the underlying pathology9. It was not feasible to perform bronchial
and transbronchial biopsies in all participants. However, this will be analyzed in a smaller subset that we will present in the future.
Large and small airways obstruction are important components of asthma pathophysiology1-3. Our
focus in this study is on the small airways and their specific impact upon asthma symptoms and exacerbations, an area of investigation that has been relatively neglected in our opinion (an overview of relatively small-sized studies is presented in Supplemental Table 7). It would be of interest to analyze in the future data in individuals with Large Airway Dysfunction (LAD) without SAD, or conversely, individuals with SAD and without LAD.Finally, one would like to have a ‘gold standard’ for SAD, yet our study shows this is not feasible since many physiological parameters contribute to the SAD model. This likely reflects that they represent abnormalities in distinct parts of the bronchial tree and/or contrasting aspects of underlying mechanisms of SAD, thereby providing different information9.
We were able to define a SAD score that reflects the amount of physiological small airways impairment and is significantly associated with measures of asthma control, exacerbations and severity. We additionally observed two clinical SAD Groups that are comparable in e.g. gender, atopy, FeNO, ICS dose and smoking habits, while Group2 was somewhat older, had a longer asthma duration and more severe asthma according to all parameters tested. Of interest, ventilation heterogeneity in pre-acinar/acinar airways measured as Sacin20, reflective of dysfunction of the most
peripheral small airways, was in the normal range in Group1 only and had a higher prevalence in Group2. The difference between clinical SAD Group1 and Group2 was particularly clear with SAD measurements like IOS and spirometry (Figure 3). Clinical SAD Group 2 represents “more severe” SAD, given particularly the presence of more severe small-to-mid-sized airway obstruction (R5-R20, FEF25-75) and less airway distensibility (Ax). In addition
In summary, we can detect asthma subtypes based on presence and extent of SAD measured with easy-to-conduct, clinically applicable tools.
Similarly, with regard to the clinical SAD score, we developed a CT-SAD score. The CT-SAD score significantly associated with GINA severity, but less well than the clinical SAD score. CT SAD Group2 had more severe asthma and the physiologic parameters were significantly different from controls and from Group1. However, the CT SAD Groups had similar levels of small-to-mid-sized airway obstruction (R5-R20) and conducting airway ventilation heterogeneity (Scond), reflective of dysfunction in small-medium size conducting airways, while Group2 had significantly higher air trapping (RV/TLC) and acinar airway ventilation heterogeneity (Sacin)values, reflective of the most peripheral small airways. This suggests that CT scan-derived SAD captures regional differences in mechanisms of airway dysfunction due to air trapping and small airways as a surrogate for peripheral airways impairment30. They become apparent in supine position, when airway closure and
compliance reduction develop as consequence of severe hyperinflation and expiratory reserve volume reduction31 in participants with more severe asthma. Notably, we observed a difference in airway
distensibility (AX) in participants undergoing CT scan, in comparison to those who did not (see Supplemental Table 3). It is thus understandable that the Clinical SAD score and the CT SAD score were not concordant (r=0.28). Where CT scans (performed in supine position) provide information on SAD particularly by changes driven from increased residual static lung volumes and air trapping32,
the physiologic parameters measured in the sitting position provide information on air trapping (body plethysmography RV/TLC), small airway obstruction (IOS and FEF25-75) and heterogeneity of both
conducting and acinar airway ventilation (MBNW). This potentially explains why the CT SAD score, in contrast to the clinical SAD score, did not associate with health status or asthma control.
Asthma control is lacking in 50-60% of patients despite guideline-based management33 and untreated
adherence and appropriate use of inhalers, psychological factors and environmental trigger exposures. The current study suggests that asthma control is also determined by the presence of SAD, since ACT was significantly associated with the clinical SAD score and was specifically abnormal in clinical SAD Group2 (most severe SAD). Moreover, a lower ACT score was associated with higher IOS parameters R5 and AX values. These data suggest that asthma control may be partially driven by SAD, but also obstruction in larger airways given its association with FEV1, the gold standard for
diagnosis and severity in clinical practice.
Of note, 91% of our asthma population expressed SAD when defined as any abnormal physiologic parameter. Our data imply that they do not all have extensive SAD throughout all airway dimensions, since the prevalence varied with the type of physiologic measure. The lowest prevalence existed with Sacin (19%) and RV/TLC (22%), both reflecting dysfunction of the most peripheral small airways30.
The highest prevalence was with FEF25-75 (68%) and % fall FVC (73%), probably both reflecting
obstruction in more small-to-mid-sized airways. Future work will have to elucidate if these different prevalence rates define subtypes of SAD (consistent vs. variable, which level of airway is involved, and what percent of these airways are involved).. We additionally compared our SAD prevalence with literature findings (Supplemental Table 7), yet no study compared all types of physiologic SAD methods. Anderson et al.6 used R5-R20 >0.03 kPa/L/s as cut-off for abnormality, concluding that
abnormal R5-R20 values were present in all severities of asthma, i.e. 65% in British Thoracic Society step2, 64% in step3 and 70% in step4. Our overall prevalence with this cut-off was 70%, while our data extend their findings showing that the prevalence rates of R5-R20 >LLN increase from GINA steps 1-5, being 54%, 65%, 70%, 77%, and 91% respectively. In contrast, the prevalence of Sacin >LLN was lowest in GINA1, almost identical in GINA 2-4 and highest in GINA5, suggesting that mostly peripheral airway dysfunction, and likely structural changes are present in most severe asthma. In summary, our data are comparable with published findings in smaller samples, yet extend these
observations by providing information on all different SAD measurements at the same time in one group of asthma patients across all severities.
Of interest, asthma participants had higher blood pressure than our controls. We did not find literature reporting this observation. Comorbidities are thus not only present in COPD, another obstructive pulmonary disease 34,35, but also occur in asthma patients with an average age of 46
years. The finding is in agreement with previous studies indicating systemic inflammation as one underlying mechanism linking reduced lung function to cardiovascular mortality36 and a positive
association between lower FEV1 and systemic arterial hypertension, while lower ICS doses
attenuated the likelihood for hypertension in a population of the same age as ours37. Alternatively,
hyperinflation could be also considered to have a role via its contribution to changes in intrathoracic pressure that increase left ventricular wall stress, similar to what has been reported in COPD38.
In conclusion, our data in a large asthma population covering the full spectrum of asthma severity show the complexity of SAD. Notwithstanding this, the clinical classification of Small Airways Dysfunction is meaningful given its association with asthma severity, control and exacerbations. Results show that SAD can be present across all GINA severity stages. Depending on the type of physiologic parameter used, the prevalence rate changes considerably, but is consistently the highest in GINA5. SAD prevalence rates were lowest with Sacin, reflecting pre-acinar/acinar airway abnormalities, and this prevalence was quite comparable over GINA2-4 but again highest in GINA5, suggesting structural abnormalities in severe asthma. In contrast, other physiologic parameters showed either increasing prevalence rates with severity (RV/TLC) or a stepwise increase (FEF25-75,
R5-R20, AX, X5). Clinical SAD and CT SAD scores did not significantly correlate. SAD derived from the CT scan provides particularly data on air trapping and ventilation impairment in more
peripheral airways, while the physiologic measures show results from both small-medium size conducting airways and peripheral airways. For clinical practice it is important that physiological, easy-to-conduct measures such as IOS and spirometry, delineate two asthma SAD subtypes that differ in exacerbation rates, quality of life, asthma severity and control.
Acknowledgements. C.B. acknowledges support from the National Institute for Health Research (NIHR) Leicester Respiratory Biomedical Centre. The views expressed are those of the authors and not necessarily those of the NHS, the NIHR or the Department of Health.
References
1. Van der Wiel E, ten Hacken NH, Postma DS, van den Berge M. Small-airways dysfunction associates with respiratory symptoms and clinical features of asthma: a systematic review. J Allergy Clin Immunol 2013; 131:646-57.
2. Kraft M, Pak J, Martin RJ, Kaminsky D, Irvin CG. Distal lung dysfunction at night in nocturnal asthma. Am J Respir Crit Care Med. 2001;163:1551-6.
3. Lipworth B, Manoharan A, Anderson W. Unlocking the quiet zone: the small airway asthma phenotype. Lancet Respir Med. 2014;2:497-506.
4. Zeidler MR1, Goldin JG, Kleerup EC et al.. Small airways response to naturalistic cat allergen exposure in subjects with asthma. J Allergy Clin Immunol. 2006;118:1075-81.
5. Nihlberg K, Andersson-Sjöland A, Tufvesson E, Erjefält JS, Bjermer L, Westergren-Thorsson G. Altered matrix production in the distal airways of individuals with asthma. Thorax. 2010;65:670-6. 6. Anderson WJ, Zajda E, Lipworth BJ. Are we overlooking persistent small airways dysfunction in community-managed asthma? Ann Allergy Asthma Immunol. 2012;109:185-189.
7. Kjellberg S, Houltz BK, Zetterström O, Robinson PD, Gustafsson PM.: Clinical characteristics of adult asthma associated with small airway dysfunction. Respir Med 2016;117:92-102.
8. Manoharan A, Anderson WJ, Lipworth J, Lipworth BJ.: Assessment of spirometry and impulse oscillometry in relation to asthma control. Lung 2015;193:47-51.
9. Postma DS, Brightling C, Fabbri L et al. Unmet needs for the assessment of small airways dysfunction in asthma: introduction to the ATLANTIS study. Eur Respir J. 2015;45:1534-8. 10. Pellegrino R1, Brusasco V, Miller MR. Questions everything. Eur Respir J 2014;43:947-8.
12. Gupta S, Hartley R, Khan UT et al. Quantitative computed tomography-derived clusters:
redefining airway remodeling in asthmatic patients. J Allergy Clin Immunol. 2014 Mar;133:729-38. 13. Hartley RA, Barker BL, Newby C et al. Relationship between lung function and quantitative computed tomographic parameters of airway remodeling, air trapping, and emphysema in patients with asthma and chronic obstructive pulmonary disease: A single-center study. J Allergy Clin Immunol. 2016 May;137:1413-1422.
14. Cantor, AB (1996). Sample Size Calculations for Cohen's Kappa, Psychological Methods, Vol 1, No. 2, pp 150 - 153.
15. Bollen KA, Structural equations with latent variables, John Wiley and Sons, 1989
16. Dong Y and Peng C-Y J. SpringerPlus 2013. Principled missing data methods for researchers. 17. Quanjer PH, Pretto JJ, Brazzale DJ, Boros PW. Grading the severity of airways obstruction: new wine in new bottles. Eur Respir J 2014; 43:505-12.
18. Robinson PD, Latzin P, Verbanck S, Hall GL, Horsley A, Gappa M, Thamrin C, Arets HG, Aurora P, Fuchs SI, King GG, Lum S, Macleod K, Paiva M, Pillow JJ, Ranganathan S, Ratjen F, Singer F, Sonnappa S, Stocks J, Subbarao P, Thompson BR, Gustafsson PM. Consensus statement for inert gas washout measurement using multiple- and single- breath tests. Eur Respir J. 2013 Mar;41(3):507-22. Erratum in: Eur Respir J. 2013 Nov;42(5):1432. Ranganathan, Sarah [corrected to Ranganathan, Sarat)
19. Thompson, B.R., Kouglass, J.A., Ellis, M., Kelly, V.J., O’Heir, R.E., King, G.G. et al, Peripheral lung function in patients with stable and unstable asthma. J Allergy Clin Immunol. 2013;131:1322– 1328.
20. Verbanck, S., Schuermans, D., Vincken, W. Inflammation and airway function in the lung periphery of patients with stable asthma. J Allergy Clin Immunol. 2010;125:611–616.
21. Downie, S.R., Salome, C.M., Verbanck, S., Thompson, B., Berend, N., King, G.G. Ventilation heterogeneity is a major determinant of airways hyperresponsiveness in asthma, independent of inflammation. Thorax. 2007;62:684–689.
22. Hardaker, K.M., Downie, S.R., Kermode, J.A., Farah, C.S., Brown, N.J., Berend, N. et al, Predictors of airways hyperresponsiveness differ between old and young patients with asthma. Chest. 2011;139:1395–1401.
23 Downie, S.R., Salome, C.M., Verbanck, S.A., Thompon, B.R., Berend, N., King, G.G. Effect of methacholine on peripheral lung mechanics and ventilation heterogeneity in asthma. J Appl Physiol (1985) 2013; Mar 15;114(6):770-7.
24. Verbanck, S., Schuermans, D., Paiva, M., Vincken, W. Nonreversible conductive airway ventilation heterogeneity in mild asthma. J Appl Physiol. 2003;94:1380–1386.
25. Verbanck, S., Schuermans, D., Paiva, M., Vincken, W. The functional benefit of anti-inflammatory aerosols in the lung periphery. J Allergy Clin Immunol. 2006;118:340–346.
26. Farah, C.S., King, G.C., Brown, N.H., Peters, M.J., Berend, N., Salome, C.M. Ventilation heterogeneity predicts asthma control in adults following inhaled corticosteroid dose titration. J Allergy Clin Immunol. 2012;130:61–68.
27. Farah, C.S., King, G.G., Brown, N.J., Downie, S.R., Kermode, J.A., Hardaker, K.M. et al, The role of the small airways in the clinical expression of asthma in adults. J Allergy Clin Immunol. 2012;129:381–387.
28. Kaminsky, David A.Multiple breath nitrogen washout profiles in asthmatic patients: What do they mean clinically? Journal of Allergy and Clinical Immunology, Volume 131 , Issue 5 , 1329 – 1330). 29. Galbán CJ, Han MK, Boes JL et al. Computed tomography-based biomarker provides unique signature for diagnosis of COPD phenotypes and disease progression. Nat Med. 2012
30. Verbanck S, Schuermans D, Noppen M, Van Muylem A, Paiva M, Vincken W. Evidence of acinar airway involvement in asthma. Am J Respir Crit Care Med 1999 ;159:1545-50.
31. Behrakis PK, Baydur A, Jaeger MJ, Milic-Emili J. Lung mechanics in sitting and horizontal body positions. Chest. 1983 Apr;83(4):643-6.)
32. Tashkin DP, Kim HJ, Zeidler M, Kleerup E, Goldin J. Evaluating small-airways disease in asthmatic patients: The utility of quantitative computed tomography. J Allergy Clin Immunol. 2017 Jan;139(1):49-51.e2.)
33. Rabe KF, Adachi M, Lai CK, Soriano JB, Vermeire PA, Weiss KB, Weiss ST.
Worldwide severity and control of asthma in children and adults: the global asthma insights and reality surveys. J Allergy Clin Immunol 2004 ;114:40-7.
34. Complex chronic comorbidities of COPD. Fabbri LM, Luppi F, Beghé B, Rabe KF. Complex chronic comorbidities of COPD. Eur Respir J. 2008; 31:204-12.
35. Postma DS, Rabe KF. The asthma-COPD overlap syndrome. N Engl J Med. 2015;373:1241-9. 36. Sin DD, Wu L, Man SF. The relationship between reduced lung function and cardiovascular mortality: a population-based study and a systematic review of the literature. Chest. 2005 Jun; 127(6):1952-9.
37. Ferguson S, Teodorescu MC, Gangnon RE, Peterson AG, Consens FB, Chervin RD,Teodorescu M. Factors associated with systemic hypertension in asthma. Lung. 2014Oct;192(5):675-83.
38. Smith BM, Kawut SM, Bluemke DA, Basner RC, Gomes AS, Hoffman E, Kalhan R, Lima JA, Liu CY, Michos ED, Prince MR, Rabbani L, Rabinowitz D, Shimbo D, Shea S, Barr RG.
Pulmonary hyperinflation and left ventricular mass: the Multi-Ethnic Study of Atherosclerosis COPD Study. Circulation. 2013 Apr 9;127(14):1503-11, 1511e1-6.
Figures and Tables
Figure 2. Monovariate correlations of physiological parameters and GINA severity, ACT score and number of exacerbations
Legend to Figure 2. Correlations are presented for GINA severity ( top panel), ACT score (middle panel), and Number of exacerbations in the past year (lowest panel). Darkest red is highest positive correlation between parameters. Darkest blue is the lowest negative correlation between parameters. All abbreviations are presented in Table 1.
Figure 3. Prevalence rates of airways dysfunction in the full asthma cohort and in the 2 SAD subgroups
Legend to Figure 3. Prevalence rates of Large Airways abnormalities, and Small Airways abnormalities in the full cohort of asthma participants (upper Figure), and according to Clinical SAD Group1 and Group2 (lower Figure). Prevalences are based on LLN (Lower Limit of Normal) and ULN (Upper Limit of Normal) values derived from the literature or from ATLANTIS controls without airway disease, noted with*. For abbreviations see Table 1.
Figure 4. Cross-Sectional Clinical SEM analyses of small airway function
Legend to Figure 4. SAD=Small Airway Dysfunction.
The figure shows the results of Structural Equation Modeling (SEM). The model uses the measured variables presented in squares to define the three latent variables (Lung1, Lung2 and Lung3). The variable SAD is then constructed by a structural model that imputes the relations between these three latent variables (Lung1 loading 0.617, Lung2 loading 0.518 and Lung3 loading 0.981). Thus SEM modeling showed that SAD was built up by three latent variables, represented in circles ( Lung1 loading 0.617, Lung2 loading 0.518 and Lung3 loading 0.981). The measured variables are presented in squares . IOS parameters R5-R20, X5 and AX (reflecting small-to-mid-sized airway
obstruction/distensibility) loaded to the first latent variable (Lung1), FEF50 and FEF25-75 both corrected for FVC
(reflecting small-to-mid-sized airway obstruction), to the second latent variable, while MBNW parameter Sacin (reflecting dysfunction in the most peripheral airways) loaded both to the first and second latent variable. The lung volume parameter RV/TLC % predicted (most peripheral airways dysfunction) and MBNW parameter Scond (dysfunction in small-medium size conducting airways) loaded to the third latent variable (Lung3). Please Note that Sacin loaded equally with 0.285 and 0.291 to latent variable Lung1 and Lung2 respectively. Please Note that Sacin loaded equally with 0.285 and 0.291 to latent variable Lung1 and Lung2 respectively. The numbers on the right hand
side represent the variance of the measures, i.e. variance in AX is 0.009, contrasting with the variance in RV/TLC % predicted being 0.738. Goodness of fit of the SEM model was evaluated through the following fit indices: Root Mean Square Error of Approximation (RMSEA), Comparative Fit Index (CFI), Tucker-Lewis Index (TLI). The closer CFI and TLI are to 1 and the closer RMSEA is to 0 the better is the model fit. The goodness of fit values (Supplemental methods) show there is good coherence of this model to SAD. Fall in FVC during hyperresponsiveness testing contributed to the model as well, when analyzed in the subgroup of asthmatics who had undergone
Legend to Figure 5. For abbreviations see Table 1
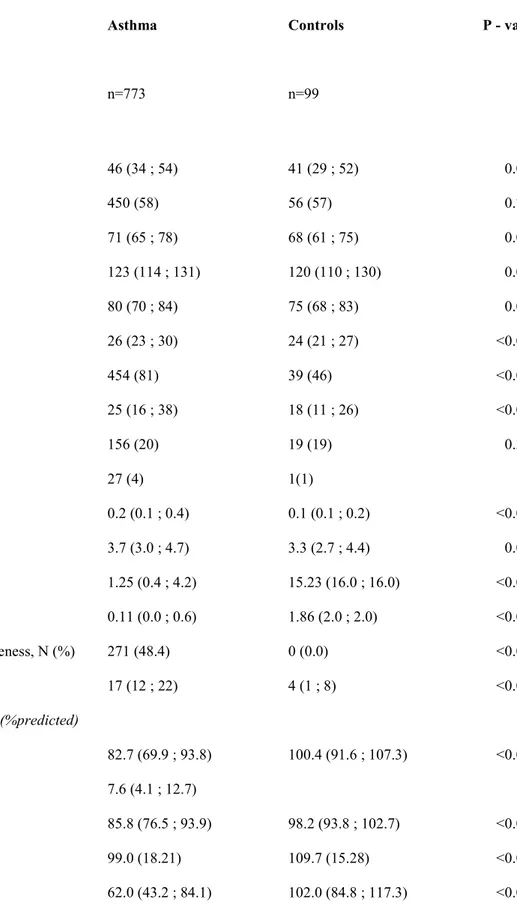
Table 1: Baseline clinical, physiologic and CT characteristics of asthma participants and controls without airway disease
Parameter Asthma Controls P - value
n=773 n=99 Clinical characteristics Age, years 46 (34 ; 54) 41 (29 ; 52) 0.007 Gender, female N (%) 450 (58) 56 (57) 0.754 Heart rate, bpm 71 (65 ; 78) 68 (61 ; 75) 0.004 BP syst, mmHg 123 (114 ; 131) 120 (110 ; 130) 0.009 BP diast, mmHg 80 (70 ; 84) 75 (68 ; 83) 0.055 BMI, kg/m2 26 (23 ; 30) 24 (21 ; 27) <0.001 Atopy (Phadiatop), N (%) 454 (81) 39 (46) <0.001 FeNO, ppb 25 (16 ; 38) 18 (11 ; 26) <0.001 Ex-smoker, N (%) 156 (20) 19 (19) 0.393 Current Smoker, N (%) 27 (4) 1(1) Eosinophils, 10⁹/L 0.2 (0.1 ; 0.4) 0.1 (0.1 ; 0.2) <0.001 Neutrophils, 10⁹/L 3.7 (3.0 ; 4.7) 3.3 (2.7 ; 4.4) 0.010 PC20, mg/mL 1.25 (0.4 ; 4.2) 15.23 (16.0 ; 16.0) <0.001 PD20, mg 0.11 (0.0 ; 0.6) 1.86 (2.0 ; 2.0) <0.001 Moderate-severe hyperresponsiveness, N (%) 271 (48.4) 0 (0.0) <0.001 Fall in FVC, % 17 (12 ; 22) 4 (1 ; 8) <0.001
Lung Physiology characteristics (%predicted)
FEV1, %predicted 82.7 (69.9 ; 93.8) 100.4 (91.6 ; 107.3) <0.001
Change FEV1, %predicted 7.6 (4.1 ; 12.7)
FEV1/FVC, %predicted 85.8 (76.5 ; 93.9) 98.2 (93.8 ; 102.7) <0.001
IVC, %predicted 99.0 (18.21) 109.7 (15.28) <0.001
FEF25-75, %predicted 56.6 (37.6 ; 75.6) 90.7 (75.6 ; 108.1) <0.001 RV, %predicted 117.1 (98.4 ; 138.9) 95.6 (87.0 ; 115.7) <0.001 TLC, %predicted 104.9 (95.9 ; 115.5) 104.8 (96.7 ; 112.5) 0.616 RV/TLC, %predicted 106.1 (91.6 ; 125.8) 92.5 (80.6 ; 109.6) <0.001 FRC, %predicted 108.7 (93.4 ; 126.7) 107.6 (91.9 ; 121.4) 0.419 Raw, %predicted 143.0 (91.4 ; 231.1) 77.6 (62.9 ; 99.5) <0.001 sGaw, %predicted 60.5 (42.5 ; 94.7) 85.0 (61.3 ; 124.6) <0.001 R20, %predicted 114.6 (97.4 ; 134.9) 96.5 (84.7 ; 110.2) <0.001 R5-R20, %predicted 278.6 (91.2 ; 640.9) 69.5 (0.0 ; 161.7) <0.001 X5, %predicted 130.4 (94.4 ; 184.7) 94.6 (77.6 ; 119.7) <0.001 AX, %predicted 209.3 (95.0 ; 510.0) 66.1 (49.9 ; 108.0) <0.001 Scond*VT, %predicted 180.5 (100.7 ; 305.3) 95.6 (44.8 ; 149.6) <0.001 Sacin*VT, %predicted 107.2 (76.7 ; 154.8) 94.1 (61.6 ; 129.8) 0.014 CT Scan characteristics MLD Inspiratory, HU -837.93 (-856.95 ; -811.97) -839.89 (-853.81 ; -812.76) 0.651 MLD Ratio E/I 0.83 (0.77 ; 0.88) 0.80 (0.73 ; 0.87) 0.081 VI-856 7.82 (2.5; 19.5) 7.83 (1.5; 15.5) 0.347
Lung Volume Ratio 0.50 (0.43 ; 0.60) 0.47 (0.38 ; 0.56) 0.156
Percentile 15 Inspiratory -921 (-935;-904) -929 (-940;-899) 0.463
Median LA/BSA Inspiratory 10.4 (2.93) 11.4 (2.83) 0.027
Median LA Inspiratory 19.0 (15.7 ; 23.3) 21.3 (18.5 ; 25.6) 0.013
Pi10 Inspiratory 7.21 (6.59 ; 7.77) 6.70 (6.28 ; 7.84) 0.073
Po20 %WA Inspiratory 7.41 (6.67 ; 8.50) 7.33 (6.42 ; 9.02) 0.732
Legend to Table 1: All parameters are presented as Mean (standard deviation), Median (Quartile1 - Quartile 3), or N (%) as appropriate. BP= Blood Pressure, Syst=Systolic, BMI= Body Mass Index, FeNO=Fraction of exhaled Nitric Oxide, WBC=White Blood Cell, RV= Residual Volume, FRC=Functional Residual Capacity, PC=Provocative Concentration, PD=Provocative Dose, PC20 and PD20 = the provocative concentration and dose, respectively, that cause a 20% fall in
FEV1 from baseline FEV1 during methacholine challenge, Fall in FVC, % fall in FVC at PC20 or PD20; FEV1=Forced
Expiratory Volume in the 1st second, FVC= Forced Vital Capacity, FEF50=Forced Expiratory Flow at 50% of FVC,
IVC=Inspiratory Vital Capacity, FEF25-75= Forced Expiratory Flow at 25%-75% of FVC,RV= Residual Volume,
TLC=Total Lung Capacity, FRC= Functional residual Capacity, Raw- airway resistance, sGaw= specific airway conductance, R5-R20= Peripheral Airway Resistance, X5= Resistance at 5 Hz, AX= Area of Reactance, Scond*VT= ventilation inhomogeneity in the conductive zone of the lungs, Sacin*VT= Ventilation inhomogeneity of the acinar zone of the lungs, CT= Computed tomography, MLD Ratio E/I= Mean Lung Density Expiratory to Inspiratory ratio, E=Expiratory, I=Inspiratory, LA= Lumen Area (mm2), BSA= Body Surface Area (m2), VI-856= Voxel index at -856
Table 2 Characteristics of asthma participants Parameter GINA 1, N (%) 135 (17.5) GINA 2, N (%) 85 (11.0) GINA 3, N (%) 207 (26.8) GINA 4, N (%) 300 (38.8) GINA 5, N (%) 46 (6.0) Medication use SABA, N (%) 671 (86.8)
Short acting anticholinergics, N (%) 9 (1.2)
LABA, N (%) 86 (11.1)
ICS, uncombined N (%), 183 (23.9)
Extra-fine ICS, N (%) 58 (7.5)
Non-extra-fine ICS, N (%) 127 (16.4)
ICS mean daily dose ( BDP equivalent), µg 669 (446)
ICS/LABA, N (%) 460 (59.5)
ICS/LABA mean daily dose (BDP-equivalent), µg 882 (634)
Extra-fine ICS/LABA, N (%) 124 (16.0)
Non-extra-fine ICS/LABA, N (%) 336 (43.5)
Oral corticosteroids, N (%) 22 (2.8)
Oral corticosteroids mean daily dose, mg 7.5 (5.0 ; 20.0)
Montelukast, N (%) 144 (18.6)
LAMA, N (%) 29 (3.8)
Biologics, N (%) 32 (4.1)
Duration of disease, years 16.7 (5.6 ; 29.3)
Age 1st diagnosis <18 years, % 39
Unscheduled consultations past 12 months, N 0.3 (1.4)
Exacerbations past 12 months, N 0.2 (0.6)
ACT, total score 21.0 (18.0 ; 24.0)
ACT < 15, % 13
ACQ-6, total score 0.8 (0.3;1.5)
ACQ-6 > 1.25, % 33
EQ-5D-5L, VAS score 80.0 (70.0 ; 90.0)
Mini AQLQ, total score 5.6 (4.7 ; 6.3)
Legend to Table 2. Data are presented as N (%) or Median (Q1 to Q3 ranges) as appropriate. ACT=Asthma Control Questionnaire, ACQ-6= Asthma Control Questionnaire-6, EQ-5D-5L= Standardized measure of health status descriptive system, Mini AQLQ= Mini Asthma Quality of Life Questionnaire. Number of exacerbations and unscheduled consultations are based on the past 12 months. The daily dose of ICS (inhaled corticosteroids) is expressed in BDP equivalents, µg/day
Table 3. Prevalence rates (%) of abnormal SAD parameters (>ULN or <LLN) according to GINA stages
Legend to Table 3. for abbreviations see Table 1. GINA severity was based on past treatment used. Note that the highest prevalence of SAD is always in GINA5, the lowest prevalence across all GINA stages is with Sacin.
Parameter, % GINA 1 GINA 2 GINA 3 GINA 4 GINA 5
FEF25-75 41.4 43.0 50.5 54.5 80.4 FEF50 37.3 49.4 54.1 55.3 75.0 % fall FVC 71.7 67.9 75.2 72.7 84.2 RV/TLC 14.0 16.3 19.3 28.1 31.1 FRC 16.2 23.4 19.1 24.5 27.3 R5-R20 29.9 40.0 36.5 50.5 70.6 AX 32.4 34.4 35.4 49.2 67.7 X5 22.8 31.8 28.5 33.2 53.1 Scond 20.5 20.0 30.0 33.3 63.6 Sacin 12.3 17.8 18.5 20.5 40.9
Table 4. Relationship of lung physiology variables with number of exacerbations and unscheduled consultations Number of exacerbations
Independent variables included in the final model Coefficient P-value
type 1 P-value type 3
FEF25-75, corrected for FVC -1.226 0.034
R5-R20, kPa/L/s 2.894 0.010
Raw, kPa*s/L -2.286 0.014
RV/TLC, ratio 2.773 0.038
sGaw, 1/kPa*s -0.316 0.027
Height, cm -0.053 <.001
PC20 and PD20 categories – Very mild vs Normal -1.058 0.017 0.006
PC20 and PD20 categories - Mild vs Normal -1.624 <.001
PC20 and PD20 categories - Moderate-severe vs Normal -1.212 0.004
Sex - Female vs Male 0.717 0.026
Number of unscheduled consultations due to worsening symptoms
Independent variables included in the final model Coefficient P-value
type 1 P-value type 3 FEV1 , L 0.647 <.001 FRC , L -0.425 0.007 RV/TLC, ratio 4.659 0.001 sGaw , 1/kPa*s) -0.466 <.001
PC20 and PD20 categories – very mild vs normal -0.999 0.004 0.023
PC20 and PD20 categories - mild vs normal -0.888 0.008
PC20 and PD20 categories - moderate-severe vs normal -0.792 0.012
Sex (male/female) - Female vs Male 0.647 0.023
Legend to Table 4. MBNW parameters were not used, since this would restrict the number of asthmatics to be analyzed (see Methods). P-value type 3 assesses the statistical difference in hyperresponsiveness severity stages. For abbreviations see Table 1.
Table 5. Clinical characteristics of asthma participants in Clinical SAD Group1 and Clinical SAD Group2
Parameter Group1 (n=452) Group2 (n=312) P-value
Clinical SAD score -0.256 (-0.34;-0.16) 0.284 (0.12;0.56) <0.001
Age, years 43 (30;53) 50 (40;58) <0.001 Gender, female N (%) 257 (57) 186 (60) 0.448 Heart rate, bpm 70 (64;77) 72 (65;80) 0.023 BP syst, mmHg 120 (110;130) 125 (117;135) <0.001 BP diast, mmHg 78 (70;82) 80 (72;87) <0.001 BMI, kg/m2 25 (22;28) 28 (25;32) <0.001 Atopy, N (%) 262 (81) 187 (79) 0.531 FeNO, ppb 24 (16;37) 25 (16;39) 0.424 Ex-smoking, N (%) 90 (20) 65 (21) 0.474
Duration smoking, years 10 (5.1;16.7) 14 (8.0;20.0) 0.020
GINA 1/2, N (%) 157 (35) 60 (9) <0.001
GINA 3, N (%) 135 (30) 70 (22) <0.001
GINA 4/5, N (%) 160 (35) 182 (58) <0.001
ICS uncombined, N (%) 98 (22) 83 (27) 0.116
ICS/LABA, N (%) 254 (56) 202 (65) 0.018
ICS dose, BDP equivalence 603.2 (384.9) 739.9 (482.5) 0.079
ICS/LABA dose, BDP equivalence 818.8 (563.1) 959.6 (710.8) 0.078
Oral corticosteroids, N (%) 8 (1.8) 14 (4.5) 0.027
Eosinophils, 10⁹/L 0.21 (0.12;0.35) 0.26 (0.16;0.40) <0.001
Neutrophils, 10⁹/L 3.50(2.88;4.47) 3.90(3.07;4.91) <0.001
FEV1, %predicted 90.2 (80.1 ; 98.4) 70.1 (58.8 ; 81.8) <0.001
Change FEV1, %predicted 6.5 (3.6 ; 9.9) 10.2 (5.5 ; 14.9) <0.001
FEV1/FVC, %predicted 90.1 (83.4 ; 96.6) 78.3 (70.5 ; 86.0) <0.001
FEF50, %predicted 75.2 (59.1 ; 94.8) 44.4 (31.5 ; 59.7) <0.001
IVC, %predicted 103.3 (18.0) 93.1 (17.0) <0.001
RV, %predicted 108.9 (92.7 ; 127.2) 134.2 (110.9 ; 158.8) <0.001 TLC, %predicted 104.3 (95.7 ; 114.0) 105.9 (95.9 ; 116.9) 0.239 FRC, %predicted 107.3 (91.7 ; 123.0) 111.2 (94.8 ; 129.9) 0.011 Raw, %predicted 110.1 (81.4 ; 167.8) 192.3 (139.6 ; 309.3) <0.001 sGaw, %predicted 66.5 (47.4 ; 105.1) 47.0 (33.9 ; 72.4) <0.001 R20, %predicted 107.8 (92.2 ; 125.7) 126.3 (109.7 ; 147.9) <0.001 R5-R20, %predicted 129.6 (29.0 ; 304.0) 636.3 (378.2 ; 1065.0) <0.001 X5, %predicted 109.1 (80.9 ; 140.5) 199.0 (151.6 ; 254.6) <0.001 AX, %predicted 115.3 (65.3 ; 198.3) 613.6 (384.7 ; 868.3) <0.001 Scond*VT, %predicted 144.6 (75.9 ; 239.7) 245.2 (161.7 ; 392.1) <0.001 Sacin*VT, %predicted 93.1 (70.6 ; 127.0) 140.8 (95.8 ; 190.5) <0.001
No. unscheduled consultations , N 0.15 (0.57) 0.50 (2.08) 0.001
No. exacerbations, N 0.16 (0.52) 0.29 (0.76) 0.002
>= 1 exacerbation, N (%) 50 (11.1) 59 (18.9) 0.002
Duration of disease, years 11.6 (4.4 ; 24.5) 21.5 (9.4 ; 35.0) <0.001
Age at 1st Diagnosis, years 25 (10 ; 41) 22 (7 ; 41) 0.131
Age at 1st Diagnosis < 18 years, N(%) 162 (36.2) 134 (42.9) 0.059
ACT, total score 22.0 (19.0 ; 24.0) 20.0(17.0 ; 23.0) <0.001
ACT score < 15, N (%) 40 (8.9) 60 (19.2) <0.001
ACQ-6, total mean score 0.66 (0.2 ; 1.3) 1.00 (0.5 ; 1.8) <0.001
ACQ-6 score > 1.25, N (%) 124 (27.4) 126 (40.4) <0.001
EQ-5D-5L, VAS score 83.0 (75.0 ; 90.0) 80.0 (70.0 ; 90.0) <0.001
Mini-AQLQ, total score 5.7 (4.8;6.4) 5.5(4.5;6.3)
CT Scan characteristics
MLD Inspiratory, HU -844.53(-859.56 ; -815.71) -831.65(-854.46 ; -808.68) 0.086
MLD Ratio E/I 0.82 (0.76 ; 0.87) 0.84 (0.78 ; 0.90) 0.007
VI-856 6.96 (1.92 ; 18.27) 9.54 (3.18 ; 21.30) 0.068
Lung Volume Ratio 0.49 (0.41 ; 0.56) 0.51 (0.45 ; 0.62) 0.008
Percentile 15 Inspiratory -922.33 (-937.51 ; -906.97) -917.72 (-930.20 ; -900.38) 0.054
Median LA Inspiratory 20.37 (17.32 ; 23.47) 17.82 (14.59 ; 22.08) <0.001
Pi10 Inspiratory 7.12 (6.54 ; 7.77) 7.28 (6.59 ; 7.78) 0.641
Po20 %WA Inspiratory 7.49 (6.71 ; 8.52) 7.27 (6.57 ; 8.41) 0.458
Legend to Table 5. Data are presented as N (%), Mean (SD) and Median (interquartile ranges) as appropriate; for abbreviations see Table 1 and Table2.