“Study of seawater intrusion in the coastal areas
of Circeo National Park and Litorale Romano
Natural Reserve, for the implementation of
numerical modeling methods”
Phd Student: Fabio Manca
Grazie alle Maestre Mascarucci, Pisani e Scifo,
che mi hanno insegnato ad imparare.
Grazie ai bambini della Scuola Popolare Piero Bruno,
per avermi insegnato che un maestro
Index FIGURE INDEX ... 4 TABLE INDEX ... 9 RIASSUNTO ... 10 ABSTRACT ... 11 GENERAL INTRODUCTION ... 12
STRUCTURE OF THE THESIS AND AIMS... 13
REGIONAL GEOLOGICAL AND HYDROGEOLOGICAL SETTING ... 14
REFERENCES ... 16
COLLABORATIONS ... 17
SECTION A: THE TIBER RIVER DELTA ... 18
1. WIND-INDUCED SALT-WEDGE INTRUSION IN THE TIBER RIVER MOUTH (ROME-CENTRAL ITALY) ... 19
ABSTRACT ... 19
1.1INTRODUCTION ... 19
1.2STUDY AREA ... 20
1.3AVAILABLE DATA AND METHODS ... 21
1.3.1 FG and TC Data analysis ... 23
1.3.2 River and sea levels ... 26
1.3.3 Seawater temperatures ... 27
1.3.4 Wind data ... 28
1.4DISCUSSION ... 29
1.5CONCLUSIONS ... 30
1.6REFERENCES ... 32
2. SEA SALT AEROSOL SALINIZATION OF GROUNDWATER IN THE LITORALE ROMANO NATURAL RESERVE (ROME – CENTRAL ITALY) ... 34
ABSTRACT ... 34
2.1INTRODUCTION ... 34
2.2GEOLOGICAL AND HYDROGEOLOGICAL SETTING ... 34
2.3MATERIALS AND METHODS ... 37
2.4RESULTS ... 38
2.5DISCUSSION ... 42
2.6CONCLUSIONS ... 44
2.7REFERENCES ... 45
3. GEOCHEMICAL INVESTIGATION OF THE TIBER RIVER DELTA (ROME – CENTRAL ITALY), FOR THE ASSESSMENT OF THE SALINIZATION SOURCES ... 46
3.2.1 Low-stand System Tracts deposits ... 51
3.2.2 Transgressive System Tract deposits ... 51
3.2.3 High-stand System Tract deposits ... 51
3.3HYDROGEOLOGICAL SETTING ... 53
3.4HYDROLOGICAL SETTING ... 53
3.5MATERIAL AND METHODS ... 55
3.6RESULTS ... 55 3.6.1 Hydrogeology ... 55 3.6.2 Groundwater chemistry ... 58 3.7DISCUSSION ... 62 3.8CONCLUSIONS ... 66 3.9REFERENCES ... 68
SECTION B: THE PONTINA PLAIN ... 71
4. SEAWATER INTRUSION ASSESSMENT IN THE CIRCEO NATIONAL PARK AREA (LATINA – CENTRAL ITALY), RELATED TO THE LANDSCAPE MODIFICATION INDUCED BY RECLAMATION ACTIVITIES ... 72
ABSTRACT ... 72
4.1INTRODUCTION ... 72
4.2GEOLOGICAL, HYDROGEOLOGICAL AND HYDROLOGICAL SETTING ... 73
4.3MATERIALS AND METHODS ... 74
4.3.1 Geological cross sections ... 74
4.3.2 Hydrogeological and hydrological surveys ... 76
4.3.3 Morphological analysis ... 77 4.4RESULTS ... 78 4.4.1 Cross sections ... 78 4.4.2 Hydrogeological pattern ... 78 4.4.3 Hydrological pattern ... 85 4.4.4 Morphological analysis ... 91 4.5DISCUSSIONS ... 93 4.6CONCLUSIONS ... 96 4.7REFERENCES ... 98
5. INCREASING SALINITY PATTERN DURING THE FALLS IN AN UNCONFINED AQUIFER NEARBY A CANAL ESTUARY: ASSESSMENT OF THE PROCESSES USING NUMERICAL MODELING ... 100
ABSTRACT ... 100
5.1INTRODUCTION ... 100
5.2GEOLOGICAL, HYDROGEOLOGICAL AND HYDROGRAPHICAL SETTING ... 101
5.3 METHODS ... 104
5.3.1 Survey data methods... 104
5.3.2 FEFLOW ... 105
5.3.3 Numerical modeling methods ... 106
5.4RESULTS AND DISCUSSION ... 111
5.4.1 Hydraulic gradient effect on saline plume propagation ... 115
5.4.2 river concentrations Sensitivity analysis ... 116
5.5CONCLUSIONS ... 117
GENERAL CONCLUSIONS ... 120 ANNEX 1 ... 122 ANNEX 2 ... 124
F
IGURE
I
NDEX
FIG.0.1: THE STUDY AREAS LOCATED ALONG THE LATIUM REGION ... 15 FIG.0.2: HYDROGEOLOGICAL COMPLEXES OUTCROPPING ALONG THE LATIUM COAST LINE (AFTER CAPELLI ET AL.2012) ... 15 FIG.1.1: HALOACLINE PATTERNS (AFTER VALLE-LEVINSON,2010): A) LARGE RIVER DISCHARGE AND WEAK TIDAL FORCING RESULT IN SALT
-WEDGE ESTUARIES;B) WEAKLY STRATIfiED OR PARTIALLY MIXED ESTUARIES RESULT FROM MODERATE TO STRONG TIDAL FORCING AND WEAK TO MODERATE RIVER DISCHARGE;C) MODERATE TO LARGE RIVER DISCHARGE AND WEAK TO MODERATE TIDAL FORCING RESULT IN STRONGLY STRATIfiED ESTUARIES; D) STRONG TIDAL FORCING AND WEAK RIVER DISCHARGE RESULT IN VERTICALLY MIXED ESTUARIES ... 20 FIG.1.2:STUDY AREA: THE TWO RIVER BRANCHES DIVIDED BY THE SACRA ISLAND; LOCATION OF WATER GAUGES AND METEREOLOGICAL
STATIONS;F-MS:FIUMICINO MS;O-MS:OSTIA MS;M-WG:MEZZOCAMMINO WG;CDR-WG:CAPO DUE RAMI WG;FG: FIUMARA GRANDE WG ... 21 FIG.1.3:FIUMARA GRANDE MEASUEREMENTS POINTS ... 22 FIG.1.4:TRAIANO CANAL MEASUEREMENTS POINTS ... 22 FIG.1.5: THERMOHALINES ABOUT OF FIUMARA GRANDE BRANCH; SALINITY IS INDICATED IN BLUE WHEREAS TEMPERATURE IS IN RED.THREE
TYPES OF TREND BETWEEN THE TWO PARAMETERS CAN OCCUR: PARALLEL, WHEN SAL AND T ARE CONSTANT ALONG THE VERTICAL; CONVERGING, WHEN WATER STARTS TO BE BRACKISH; INTERSECTING, WHEN SALT-WATER WITH A T LOWER THAN FRESHWATER LIES ON RIVER BOTTOM.THE LOCATION OF THE MEASUREMENT POINTS IS INDICATED IN FIG.1.3 ... 24 FIG.1.6: CROSSED SECTION ABOUT THE SALINITY DISTRIBUTION IN FIUMARA GRANDE BRANCH, BETWEEN THE FG24 AND FG12 MEASUREMENT STATIONS.THE DATA BEFORE FG12 ARE NOT REPRESENTED BECAUSE OF THE SAME SALINITY OF WATER COLUMN.FG MOUTH IS LEFTWARD.SALT-WEDGE POSITION WAS NOTICED UP TO 8,8 KM FORM THE MOUTH.SEAWATER IS REPRESENTED RED, BRACKISH WATER IN YELLOW AND FRESHWATER IN CIANO.BOTH THE MIXING ZONE (BRACKISH) AND THE SEAWATER ZONE REACHED A MAXIMUM THICKNESS OF 3.0 M AT THE POINT FG21.THE ANOMALOUS MORPHOLOGY OF THE MIXING ZONE AT THE POINT FG19 IS PROBABLY DUE TO A FRESHWATER INFLOW OF A DRAINAGE PUMP, LOCATED ON THE HYDROGRAPHICAL RIGHT OF FIMARA
GRANDE BRANCH; BLACK POINTS INDICATE THE VERTICAL MEASUREMENT LOCATIONS.THE LOCATION OF THE MEASUREMENT POINTS IS INDICATED IN FIG.1.3 ... 25 FIG.1.7: THERMOHALINES ABOUT OF TRAIANO CANAL; BRANCH SALINITY IS INDICATED IN BLUE WHEREAS TEMPERATURE IS IN RED.THREE
TYPES OF TREND BETWEEN THE TWO PARAMETERS CAN OCCUR: PARALLEL, WHEN SAL AND T ARE CONSTANT ALONG THE VERTICAL; CONVERGING, WHEN WATER STARTS TO BE BRACKISH; INTERSECTING, WHEN SALT-WATER WITH A T LOWER THAN FRESHWATER LIES ON THE RIVER BOTTOM.THE LOCATION OF THE MEASUREMENT POINTS IS INDICATED IN FIG.1.4 ... 25 FIG.1.8: CROSSED SECTION OF SALINITY DISTRIBUTION IN TC BRANCH.TC MOUTH IS LEFTWARD WHILE FG IS RIGHTWARD.SALT-WEDGE
POSITION WAS NOTICED ALONG THE WHOLE TC BOTTOM.SEAWATER IS REPRESENTED IN RED, BRACKISH WATER IN YELLOW AND FRESHWATER IN CIANO; BLACK POINTS INDICATE THE VERTICAL MEASUREMENT LOCATIONS.THE LOCATION OF THE
MEASUREMENT POINTS IS INDICATED IN FIG.1.4 ... 26 FIG.1.9 LEVELS ABOUT THE THREE WATER GAUGES (WG) AND ANZIO TIDAL GAUGE (TG), WITH A 30 MINUTES FREQUENCY.AS IT CAN BE
OBSERVED GRAPHICALLY, THERE IS A STRICT RELATIONSHIP BETWEEN THE RIVER-WATER AND TIDAL FLUCTUATIONS.THE TIME SERIES IS FROM THE 15TH
MARCH TO THE 15TH
OF APRIL.THE LEFT Y AXIS IS ABOUT THE WGS LEVEL FLUCTUATION, WHILE THE LEFT Y AXIS IS ABOUT THE ANZIO TG FLUCTUATION ... 26 FIG.1.10: DOMINANT FREQUENCIES FOR THE LEVEL DATA ABOUT THE ANZIO TIDAL GAUGE AND THE THREE WATER GAUGES. DOMINANT
FREQUENCIES ARE 1.0 D-1,1.94 D-1 AND 2.0 D-1 AND THEY REPRESENT THE LUNAR DIURNAL, LUNAR SEMI-DIURNAL AND SOLAR SEMI
-DIURNAL CONSTITUENT ... 27 FIG.1.11: AVERAGE OF THE DAILY TIME-LAGS AND THE CORRESPONDING STANDARD DEVIATION ABOUT THE TREE WATER GAUGES, WITH
RESPECT TO ANZIO TIDAL GAUGE ... 27 FIG.1.12: COMPASS ROSES ABOUT THE WIND WITH A SPEED HIGHER THAN 4 M/S, SHOWING THE WIND DIRECTION PROVENANCES.THEY WERE
NORTHEASTERLY DURING THE MONTHS OF JANUARY AND FEBRUARY, SOUTHEASTERLY IN MARCH AND WESTERLY IN APRIL AND
FIG.1.13: THERMAL VALUES ABOUT FIUMARA GRANDE BRANCH BOTTOM.THE BRENCH MOUTH IS LOCATED LEFTWARD.MEASUREMENT POINTS ARE REPRESENTED IN BLACK.BLUE POINTS AND LINES REPRESENT T VALUES ABOUT FRESHWATER;YELLOW POINTS AND LINES REPRESENT T VALUES ABOUT BRACKISH WATER; RED POINTS AND LINES REPRESENT T VALUES ABOUT SEAWATER ... 29 FIG.1.14: THERMAL VALUES ABOUT TC BRANCH BOTTOM.THE BRENCH MOUTH IS LOCATED LEFTWARD, WHILE FG RIGHTWARD.
MEASUREMENT POINTS ARE REPRESENTED IN BLACK.YELLOW POINTS AND LINES REPRESENT T VALUES ABOUT BRACKISH WATER; RED POINTS AND LINES REPRESENT T VALUES ABOUT SEAWATER ... 30 FIG.1.15: DISCHARGE RATE AT RIPETTA WATER GAUGE DURING MARCH AND APRIL 2012.THE AVERAGE DISCHARGE RATE ABOUT MARCH AND
APRIL ARE 92.67 M3/S (RED LINE) AND 108 M3/S (BLACK LINE) RESPECTIVELY... 30 FIG.2.1: THE AREA OF THE LITORALE ROMANO NATURAL RESERVE ... 35 FIG.2.2:B-B’GEOLOGICAL CROSS-SECTION.LEGEND:1-HETEROMETRIC GREY-YELLOW SANDS, WITH GRAVEL LENSES.THE THICKNESS
RANGES TILL 20M.REPRESENT FLUVIAL DEPOSITS.(LITOFACIES 1/A IN BELLOTTI ET AL.,1989);2-SANDY PELITES, FREQUENTLY INTERBEDDED WITH BIOCLASTIC LEVELS AND VEGETAL REMINDERS, IN THE LOWER PART CLAYEY SILT AND GREEN CLAY, FOSSIL
-RICH, ARE PRESENT.THE HIGHEST THICKNESS HAS NOT YET BEEN DEFINED.REPRESENT A TRANSITION-PLATFORM COMPLEX
(LITOFACIES 3 IN BELLOTTI ET AL.,1989);3-GREY OR GREY-BLUE PELITES, INTERBEDDED WITH THIN SANDY LEVELS, PEAT LEVELS AND SANDY LENSES.THICKNESS OF SOME METERS.CONSTITUTE AN HAFF COMPLEX (LITOFACIES 3 IN BELLOTTI ET AL., 1989);4-THIN OR MEDIUM THIN GREY-RED SANDS, FEMIC-RICH, WITH VEGETAL REMAINDERS.REPRESENT THE EXISTING DUNE BAR.THICKNESS RANGES FROM 3 M TO 15 M (LITOFACIES 4/A IN BELLOTTI ET AL.,1989);5-HETEROMETRIC GREY SANDYS,
FEMIC-RICH, FOSSIL-RICH AND VEGETAL REMAINDERS.CONSTITUTE A COSTAL BARRIER.THICKNESS RANGES FROM SOME METERS TO 10 M (LITOFACIES 4/B IN BELLOTTI ET AL.,1989);6-GREY-YELLOW PELITES WITH THIN GRAVELS, DRYING STRUCTURES,
TRAVERTINE CONCRETIONS, ALTERED VOLCANIC DEPOSITS, PEAT AND FOSSIL LEVELS ( ALLUVIAL DEPOSITS LATU SENSU). THICKNESS OF 7-8 METERS (LITOFACIES 2 IN BELLOTTI ET AL.,1989);7-BEDDED PEATS, BLACK ORGANIC CLAYS, BLACK SANDS. THICKNESS RANGES FROM SOME DECIMETERS TO SOME METERS;8-HETEROMETRIC SANDS AND BROWN-RED SILTY SANDS,
TERRACED.THICKNESS RANGES FROM SOME METERS TO 20-25 M (“DUNA ANTICA” AUCT.)UPPER PLEISTOCENE;9-GREY SILTY CLAYS (“FORMAZIONE DI PONTE GALERIA” AUCT. P.P.) LOWER-MIDDLE PLEISTOCENE;10 -INCOHERENT GRAVELS OR IN SANDY
-SILTY MATRIX, RARELY HETEROMETRIC SANDS OR SILTY SANDS.THICKNESS RANGES FROM SOME METERS TO 10 METERS
(FORMAZIONE DI PONTE GALERIA AUCT.P.P., LITOFACIES 6 IN BELLOTTI ET AL.1989) LOWER-MIDDLE PLEISTOCENE;11-GREY
-BLUE CLAYS AND SILTY CLAYS, INTERBEDDED WITH GREY SANDY SILTS.UPPER PLIOCENE-PEISTOCENE P.P.;12-GREY CLAYS AND MARLS.PLIOCENE (FROM CARTA GEOLOGICA,F°149“CERVETERI”,1967);13-SURFACE OF THE SHALLOW AQUIFER- YEAR 2004; 14-SURFACE OF THE SHALLOW AQUIFER- YEAR 2002;15-GEOGNOSTIC BOREHOLE AND DATABASE CODE.(AFTER CAPELLI ET AL. (2007)) ... 36 FIG.2.3: DEPOSITIONAL MECHANISM OF SSA ACCUMULATION AND MOBILIZATION;A) WHEN WESTERLY WINDS OCCUR,SSA IS TRANSPORTED
LANDWARD AND ACCUMULATE ON THE TREE FOLIAGE;B) WHEN RAINS FALL, THE SSA IS SOLUBILIZED AND IS TRANSPORTED INTO THE GROUNDWATER, DETERMINING AN INCREASE OF CL- AND NA+ CONTENT (AFTER TUCCIMEI ET AL.(2010)) ... 36 FIG.2.4: CONTENT OF CL-(A) AND NA+(B) ABOUT WATER SAMPLES COMING FROM STEMFLOWS THROUGHFALLS AND GROUNDWATER.
CHEMICAL ANALYSIS SHOWED HOW HIGHER CONTENT OF THE TWO IONS WERE MEASURED NEAR THE COAST LINE, AS A
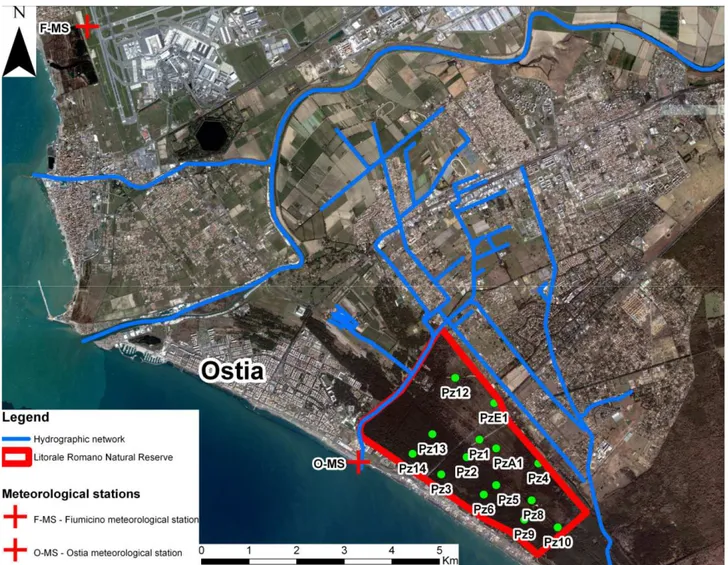
CONSEQUENCE OF THE BARRIER EFFECT ACTED BY THE PINE FOREST (AFTER TUCCIMEI ET AL.(2010)) ... 37 FIG.2.5: THE LOCATION OF THE PIEZOMETRIC NETWORK AND THE FIUMICINO AND OSTIA METREOLOGICAL STATIONS ... 38 FIG.2.6: WATER TABLE FLUCTUATION ABOUT THE PZ3.THE MAXIMUM WATER TABLE LEVEL WAS IN MAY 2011(1.47 M A.S.L.) AND THE
MINIMUM IN OCTOBER 2011(0.78 M A.S.L.).IT CAN BE OBSERVED HOW THE WATER TABLE LEVEL INCREASES VERY QUICKLY WHEN RAINS OCCUR ... 39 FIG.2.7: WATER TABLE ABOUT THE MAXIMUM AND MINIMUM LEVELS (MAY 2011(A) AND OCTOBER 2011(B) RESPECTIVELY).IN THE
OBSERVATION TIME A REDUCTION FROM 1.8‰ TO 0.9‰ OF THE HYDRAULIC GRADIENT WAS QUANTIFIED ... 39 FIG.2.8:EC VALUES ABOUT THE PIEZOMETERS NETWORK SURVEYED BETWEEN MAY 2011 AND MAY 2012.IT CAN BE OBSERVED HOW PZ3,PZ9
FIG.2.9:PIPER DIAGRAM REPRESENTING THE MAIN WATER TYPES. IT CAN BE OBSERVED HOW PZ10 AND PZ12 RESULTED TO BE ABOUT THE
CAHCO3 WATER TYPE; PZ6 LANDED IN THE TRANSITION ZONE BETWEEN CAHCO3AND CACL2 WATER TYPES, WHILE PZ12
LANDED IN THE TRANSITION ZONE BETWEEN CACL2AND NACLWATER TYPES ... 41
FIG.2.10: COMPASS ROSES DERIVED FROM A STATISTICAL ANALYSIS OF THE WIND SPEED HIGHER THAN 4 M/S (O’DOWD AND DE LEEUW,2007). IN THE PERIOD FROM MAY TO SEPTEMBER 2011 THE WINDS WERE WESTERLY; FROM OCTOBER 2011 TO MARCH 2012 THE WIND PATTERN WAS VARIABLE WITH WINDS FROM NORTHEASTERLY TO SOUTHEASTERLY; FROM APRIL TO MAY 2012, THEY STARTED AGAIN TO BE WESTERLY. ... 42 FIG.2.11: RELATIONSHIPS AMONG WIND PROVENANCE (COMPASS ROSES), RAINS (CUMULATE IN BLUE LINE) AND EC ABOUT THE PZ3(RED
BARS).IT CAN BE OBSERVED HOW IN THE PERIOD FROM MAY TO SEPTEMBER 2011A SSA ACCUMULATION OCCURRED ON THE TREE FOLIAGE.IN OCTOBER 2011, WITH THE BEGINNING OF THE RAINY SEASON, A GREAT QUANTITY OF RAINS FELL DOWN, INCREASING THE EC VALUES.ONCE THE SSA WAS WASH OUT A DILUTION ACTED BY THE RAIN WATER TOOK PLACE AND EC VALUES
DECREASED.THEY STARTED TO INCREASE AGAIN IN APRIL 2012, DUE TO A NEW ACCUMULATION CYCLE DETERMINED BY A NEWLY WESTERLY WIND PATTERN.THE BLACK LINE INDICATES THE PERIODS OF SSA DRY DEPOSITION ON THE TREE FOLIAGE ... 43 FIG.2.12:TRANSECT OF GROUNDWATER CHEMISTRY ABOUT THE FOUR PIEZOMETERS.IT CAN BE SEEN HOW THE RICHEST IN CL- AND NA+ ARE
THOSE LOCATED NEARBY THE COAST LINE.THEY SHOW MIX WATER TYPES, RANGING FROM NACL TO CA2CL.LAST TWO
PIEZOMETERS ARE ENRICHED IN CA2+ AND HCO3-, BECAUSE OF THEIR FRESHWATER COMPOSITION ... 44
FIG.3.1: THE STUDY AREA LOCATION; THE GEOLOGIC MAP IS AFTER FUNICIELLO ET AL.(2008), THE CROSS SECTIONS ARE AFTER MILLI ET AL. (2013) ... 47 FIG.3.2: CHRONOSTRATIGRAPHIC AND SEQUENCE-STRATIGRAPHIC SCHEME OF THE PLEISTOCENE DEPOSITS OF THE ROMAN BASIN (AFTER
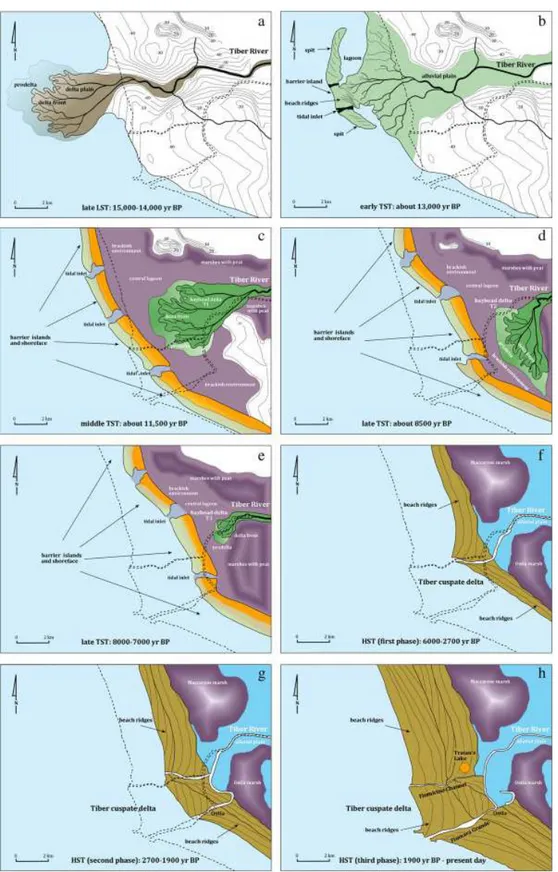
MILLI,1997;MILLI AND PALOMBO,2011).HST:HIGH-STAND SYSTEMS TRACT;TST:TRANSGRESSIVE SYSTEMS TRACT;LST: LOW-STAND SYSTEMS TRACT;ELST:EARLY LOW-STAND SYSTEMS TRACT;LLST:LATE LOW-STAND SYSTEMS TRACT (MILLI ET AL.2013)... 49 FIG.3.3: CROSS SECTIONS ABOUT THE TDS(AFTER MILLI ET AL.2013) ... 50 FIG.3.4: EVOLUTION OF THE TIBER RIVER BASIN: DEPOSITIONAL PHASES ACCORDING TO THE SEA-LEVEL CHANGES (MILLI ET AL.2013) ... 52 FIG.3.5: THE GROUNDWATER PATTERN OF THE TIBER RIVER DELTA TRACES THE TOPOGRAPHY AND THE HYDRAULIC HEAD IS LOCATED IN
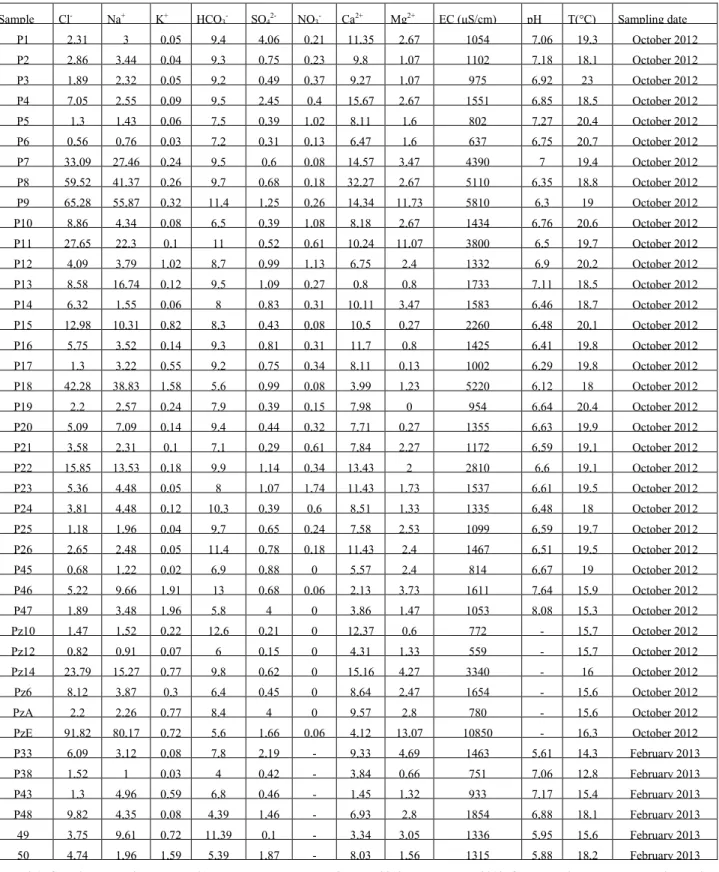
CORRESPONDENCE OF THE MORPHO-STRUCTURAL RIDGE OF ACILIA-POMEZIA (APR).FOR THE LEGEND SEE FIG.3.1 ... 54 FIG.3.6:GROUNDWATER PATTERN ABOUT OCTOBER 2012.FOR THE LEGEND SEE FIG.3.1 ... 56 FIG.3.7: GROUNDWATER PATTERN ABOUT FEBRUARY 2012.FOR THE LEGEND SEE FIG.3.1 ... 57 FIG.3.8: WATER TYPES ACCORDING TO THE CLASSIFICATION OF FREEZE AND CHERRY (1979).THE IONIC COMPOSITION OF THE WATER
SAMPLES SHOWS HOW BRACKISH WATER IS ENRICHED FIRSTLY IN NA+ AND CL- AND SECONDLY IN CA2+ AND MG2+ ... 59 FIG.3.9: LINEAR CORRELATION BETWEEN NA+ AND CL- ... 59 FIG.3.10: LINEAR CORRELATION BETWEEN CL- AND EC ... 60 FIG.3.11:TAS SHOWS THE MINERALOGICAL COMPOSITION OF THE MAIN VOLCANIC PRODUCTS OF THE SABATINI VOLCANIC COMPLEX AND
THE ALBAN HILLS (AFTER LE BAS ET AL.1986).MOST OF THE ROCKS LAND IN BASIC-INTERMEDIATE AREA, CHARACTERIZED BY
TEPHRI-BASANITES AND PHONOLITES, WHOSE MAJOR MINERALS ARE LEUCITE AND CLINOPIROXENE (DIOPSIDE AND
HEDENBERGITE) ... 61 FIG.3.12: DATA SAMPLES ABOUT THE OCTOBER 2012 AND FEBRUARY 2013 PLOTTED IN THE PIPER DIAGRAM.IT SHOWS HOW ALL THE WATER
TYPES ARE REPRESENTED IN THE STUDY AREA.IF THERE IS A CONSERVATIVE MIXING WITH PURE SEAWATER, THE CHEMICAL COMPOSITION OF GROUNDWATER SHOULD PLOT ALONG THE STRAIGHT RED LINE (RED LINE).IN CASE THE POINTS ARE LOCATED ABOVE OR BELOW THE STRAIGHT RED LINE, IT MEANS THAT A PROCESS OF CATION EXCHANGE IS OCCURRING.IT TAKES PLACE WHEN AN AQUIFER IS SUBJECT TO SEAWATER CONTAMINATION AND A CATION EXCHANGER, COMPOSED BY CLAYEY LEVELS, ACTS MAINLY ON CA2+ AND MG2+ OR NA+ ... 62 FIG.3.13: LOCALIZATION OF THE WATER TYPES IN THE STUDY AREA.THE LARGEST GROUP OF WATER SAMPLES IS COMPOSED BY
CA(HCO3)2.THEY ARE MAINLY LOCATED IN THE CENTRAL PART OF THE STUDY AREA, WHERE THE SANDY AND GRAVELLY
DEPOSITS THAT FORM THE APR OUTCROP.THE CACL2 WATER TYPE IS DISPOSED ALONG THE BORDERS OF THE STUDY AREA, NEAR
THE SEA AND TIBER RIVER. THIS WATER TYPE IS TYPICAL OF AREAS SUBJECT TO SALINIZATION OF GROUNDWATER.IT CAN BE PRODUCED BY TWO MAIN PROCESSES IN THE STUDY AREA: MIXING DERIVING BY AN INTRUSION OF SEAWATER AND SSA
CONTAMINATION.THE LAST THE NAHCO3 WATER TYPE WAS NOTICED IN WELLS LOCATED IN THE TIBER RIVER ALLUVIAL
DEPOSITS, CONTAINING MORE CLAYEY LEVELS AND THEREFORE MORE IONIC EXCHANGER.THEY PROBABLY REPRESENT THE PARTLY FLUSHED REMAINS OF AN ANCIENTLY ENTRAPPED SALINE WATER BODY ... 64 FIG.3.14:EC VALUES ABOUT PZE FROM APRIL 2003 TO SEPTEMBER 2012.ITS SALINITY COULD BE DUE TO THE PRESENCE OF CONNATE PALEO
-SALTY WATER, REACHED BY THE WELL BOTTOM.THE DECREASING EC TREND COULD BE CONNECTED TO A A FRESHWATER DILUTION OF THE PALEO-SALTY DEEP WATERS CAUSED BY THE FRESHER SURFICIAL GROUNDWATER ... 65 FIG.3.15:BEX ARE USEFUL TO EVALUATE THE SALINIZATION OF A COASTAL AQUIFER.WHEN A POSITIVE BEX IS PRESENT, IT INDICATES THAT
NA+ AND K+
HAVE CHANGED CA2+ AND MG 2+, DETERMINED BY SEAWATER INTRUSION; WHEN THE VALUE IS NEGATIVE IT MEANS THAT A FRESHENING OCCURRED AND CA2+ AND MG 2+ HAVE CHANGED NA+ AND K+ ... 65
FIG.3.16: HISTORICAL MAP OF THE TIBER DELTA AREA (IGM1880).THE SOLAR SALT WORKS WERE LINKED TO THE STAGNO DI OSTIA POND VIA A CANAL.STAGNO DI OSTIA POND, IN TURN, WAS LINKED TO THE SEA THROUGH THE STAGNO CANAL... 65 FIG.3.17: DIAGRAM SHOWING THE EVOLUTION OF WATER TYPES, DETERMINED BY THE INCREASE OF NA+ AND CL- COMING FROM SSA ... 66 FIG.4.1: HYDROGRAPHICAL PATTERN OF THE STUDY AREA ABOUT RIVERS, CANALS AND LAKES.THE TERRITORY OF THE CIRCEO NATIONAL
PARK IS SHOWN AS WELL ... 75 FIG.4.2: TRACKS OF THE GEOLOGICAL SECTIONS ABOUT THE STUDY AREA.THEY WERE MAINLY LOCATED IN THE NORTHERN PART BECAUSE OF A MAJOR DATA AVAILABILITY ... 76 FIG.4.3: LOCATION OF THE MONITORING NETWORK TO INVESTIGATE SEAWATER INTRUSION NEARBY THE COASTAL LAKES.FOR THE LEGEND
OF THE GEOLOGIC MAP SEE FIG.4.2 ... 77 FIG.4.4: THE SIX DETAILED CROSS SECTIONS AND THE RELATIVE TRACKS.THE AREA CAN BE DIVIDED IN TWO PARTS: THE INNER SECTOR, WITH
A HIGH DEPTH OF THE CLAYEY BASEMENT AND THE COASTAL PART, CHARACTERIZED BY A SHALLOW BASEMENT AND A MINOR HYDRAULIC POTENTIALITY ... 79 FIG.4.5: GROUNDWATER PATTERNS ABOUT THE THREE SURVEYS.THE GROUNDWATER DEPRESSIONS WERE IDENTIFIED DURING ALL THE
SURVEY PERIODS, ESPECIALLY IN THE CENTRAL SECTOR.THE POSITIONS OF THE SURVEY POINTS ARE INDICATED. ... 80 FIG.4.6: DATA ABOUT EC AND SAL ABOUT THE FOGLIANO LAKE.DATA WERE COLLECTED NEARBY THE P2 WELL, AT THE DOCK OF VILLA
FOGLIANO.THE GRAPHIC SHOWS HIGH VALUES BOTH OF EC AND SAL AT THE END OF THE SUMMER (OCTOBER), DECREASING GOING TO THE RAINY SEASONS. ... 81 FIG.4.7: DATA ABOUT THE FOGLIANO AND MONACI LAKES.THE GREEN LINE (FOGLIANO MOUTH) SHOWS A PARALLELISM WITH THE BLACK
ONE (FOGLIANO LAKE AT THE DOCK) RELATED TO THE SEA LEVEL FLUCTUATION.THE BLUE LINE (MONACI LAKE) SHOWS AN INDEPENDENT TREND, DUE TO THE SEAWATER INFLOW OF A DRAINING PUMP AND TO THE RAINFALL RATE (HYDRODATA AND DHI-ITALIA 2012) ... 81 FIG.4.8: A) DATA ABOUT THE WATER TABLE LEVEL OF THE MONITORING WELLS.THE MINIMUM VALUES IS ABOUT P3, WHOSE TOPOGRAPHIC
HEIGHT IS BELOW SEA LEVEL. B)BOXPLOT ABOUT THE EC VALUES OF THE NINE WELLS:P1,P2 AND P6 SHOWED HIGH VALUES OF
EC AND A HIGH VARIABILITY.THEIR BEHAVIOR DEPENDS ON THE CLOSENESS TO THE SALINIZED WATER BODIES ... 82 FIG.4.9: A) FOUR VERTICAL MEASUREMENTS ABOUT THE EC VALUES OF THE P2 WELL; B) WATER TABLE LEVELS OF THE SAME PERIOD.IT CAN
BE OBSERVED THE CLOSE CONNECTION BETWEEN THE DEPTH OF THE INTERFACE ZONE AND THE WATER TABLE LEVEL. ... 83 FIG.4.10: LACK OF CONNECTIONS BETWEEN THE SEA LEVEL (AT ANZIO TIDE GAUGE) AND WATER TABLE FLUCTUATION.THE WATER TABLE
DROPS INDICATE WITHDRAWALS ... 83 FIG.4.11: LATERAL INTRUSION NOTICED IN THE P2 WELL.IT CAN BE OBSERVED HOW THE WATER TABLE LEVEL INFLECTION DETERMINES AN
INCREASE OF EC VALUES.WATER TABLE FLUCTUATION DEPENDS ON THE RECHARGE RATE AND THE WITHDRAWALS ... 84 FIG.4.12: IDENTIFICATION OF SEAWATER INTRUSION USING A THERMAL APPROACH: FRESHWATER IN THE WELL AFTER THE 26TH
OF JANUARY
(ABOUT 1000 µS/CM) HOLDS A LOWER TEMP WITH RESPECT TO THAT OF THE PREVIOUS DAYS ... 84 FIG.4.13: TREND IN PHASE OPPOSITION OF THE EC AND WATER LEVEL VALUES, DUE TO THE PROCESS OF UPCONING, CREATED BY
GROUNDWATER PUMPING ... 85 FIG.4.14:LOCATION OF THE SURVEYED POINT IN THE PERENNIAL HYDROGRAPHICAL PATTERN.A DIFFERENTIATION FOR THE SALINIZED
FIG.4.17:SALINIZATION PATTERN AND LOCATION OF THE MEASUREMENT POINTS ABOUT THE ALLACCIANTE CANAL ... 88
FIG.4.18:SALINIZATION PATTERN AND LOCATION OF THE MEASUREMENT POINTS ABOUT RIO MARTINO RIVER ... 89
FIG.4.19:SALINIZATION PATTERN AND LOCATION OF THE MEASUREMENT POINTS ABOUT THE CICERCHIA CANAL ... 89
FIG.4.20:SALINIZATION PATTERN AND LOCATION OF THE MEASUREMENT POINTS ABOUT NOCCHIA AND CATERATTINO CANALS ... 90
FIG.4.21:SALINIZATION PATTERN AND LOCATION OF THE MEASUREMENT POINTS ABOUT PAPALE AND LAVORAZIONE CANALS ... 90
FIG.4.22SALINIZATION PATTERN AND LOCATION OF THE MEASUREMENT POINTS ABOUT THE SISTO RIVER ... 91
FIG.4.23: THERMOHALINES ABOUT THREE MEASUREMENT POINTS IN THE SISTO RIVER.RED LINES ARE ABOUT TEMP WHILE BLUE LINES ARE ABOUT SAL.SIS1 REPRESENTS DATA OF SAL AND TEMPERATURE ABOUT THE CLOSEST STATION TO THE MOUTH THE TREND BETWEEN THE TWO LINES CONVERGE AND MOVE TOWARD THE RIGHT PART OF THE GRAPHIC: IT MEANS THAT BOTH SALINITY AND TEMPERATURE INCREASE;SIS10 INTERCEPTS THE BRACKISH WATER LENS AND IN THIS CASE ONLY THE SAL VALUES INCREASE (MOVING RIGHTWARD), WHEREAS THE T VALUES KEEP CONSTANT;SIS15 IS ABOUT A VERTICAL MEASUREMENT IN A FRESHWATER COLUMN AND THE TREND BETWEEN THE TWO LINES IS PARALLEL.SINCE SIS10 SHOWS A VERTICAL CONSTANT T VALUE, BUT THE SALINITY INCREASES WITH THE DEPTH, IT MEANS THAT THE BRACKISH WATER LENS LYING ON THE RIVER BOTTOM IS EVIDENCE ABOUT AN OLDER SALT-WEDGE INTRUSION, WHICH REACHED THE THERMAL EQUILIBRIUM WITH FRESHWATER. ... 91
FIG.4.24: TOPOGRAPHY ABOUT 1927(A),2006(B) AND MORPHOLOGICAL ANALYSIS ACTED BY RECLAMATION WORKS (C) ABOUT THE 13 KM LENGTH COAST LINE.THE BLUE AREAS INDICATE A GAIN OF VOLUMES; THE RED AREAS INDICATE A LOSS OF VOLUMES AND THE GREY AREA REVEAL THE UNCHANGED AREAS (GRAGNANINI 2009) ... 92
FIG.4.25: LAND USE MAP DERIVED FROM SATELLITE IMAGES (EEA2006).THE CIRCLES CORRESPOND TO THE GROUNDWATER DEPRESSIONS IDENTIFIED DURING THE THREE REGIONAL SURVEYS (SEE FIG.4.5).IN RED THE LOCATION OF DEPRESSIONS IDENTIFIED IN MAY -JUNE 2011; IN YELLOW THE DEPRESSIONS IDENTIFIED IN OCTOBER-NOVEMBER 2011; IN GREEN THE GROUNDWATER DEPRESSIONS IDENTIFIED DURING THE FEBRUARY-MARCH 2012 SURVEY ... 94
FIG.4.26: WATER TABLE DEPRESSION CONES DUE TO GROUNDWATER PUMPING DURING THREE SPRING TIME DAYS.OBSERVING THE CONE OF THE 4TH OF APRIL, IT CAN BE NOTICED HOW THE DECREASE OF LEVEL STARTS AT MIDNIGHT AND THE MAXIMUM DEPRESSION IS AROUND 6 O’CLOCK A.M.THIS GRAPHIC CONFIRMS THAT IN PONTINA PLAIN WITHDRAWALS CAN OCCUR EVEN DURING THE NIGHT ... 94
FIG.4.27: CORRELATION BETWEEN GROUNDWATER SALINIZATION AND SALINITY PATTERN OF THE DRAINAGE NETWORK ... 95
FIG.4.28: A) MORPHOLOGY ABOUT 1927 AND 2003; B) TOPOGRAPHIC SECTION ABOUT THE MORPHOLOGY OF THE TWO PERIODS (GRAGNANINI 2009) ... 96
FIG.4.29:VOLUMETRIC ANALYSIS ABOUT THE RIO MARTINO AREA.A NET LOSS OF ABOUT 225000M3 WAS EVALUATED BY THE GIS SYSTEM (GRAGNANINI 2009) ... 96
FIG.5.1: LOCATION OF THE STUDY AREA AND THE POSITION OF THE NEW-DRILLED MONITORING NETWORK. ... 101
FIG.5.2: STRATIGRAPHY OF THE LAT12 BOREHOLE.AT ABOUT 11 METERS FROM THE GROUND LEVEL IT CAN BE OBSERVED THE CLAYEY-SILT LAYER, WHICH DIVIDE THE AQUIFER IN TWO PARTS ... 102
FIG.5.3: GEOLOGICAL CROSS-SECTION ABOUT THE STUDY AREA; THE HORIZON D REPRESENTS THE SHALLOW AQUIFER AND THE UNDERLYING CLAYEY-SILT, WHEREAS HORIZON C AND HORIZON B REPRESENT THE DEEP AQUIFER (D'APPOLONIA 1984) ... 103
FIG.5.4: WATER TABLE LEVEL COLLECTED HOURLY AT THE ENEA5 STATION ABOUT THE SHALLOW AQUIFER (ENEA5-12) AND THE DEEP AQUIFER (ENEA5-23)(SEE FIG.5.1 FOR THE LOCATION). ... 103
FIG.5.5:MOSCARELLO CANAL WATER DISCHARGE: ON THE LEFT IS VISIBLE A LOW FLOW PERIOD, WHILE ON THE RIGHT DURING A FLOOD EVENT ... 104
FIG.5.6: GROUNDWATER PATTERN ABOUT THE SHALLOW (ON THE LEFT) AND DEEP AQUIFER (ON THE RIGHT).WATER LEVELS WERE COLLECTED IN OCTOBER 2012 ... 104
FIG.5.7: SIMULATION TYPES OF FEFLOW(DIERSCH 2009) ... 106
FIG.5.8: BOXPLOT ABOUT THE EC VALUES SURVEYED IN THE MONITORING NETWORK IN 2012-13 SURVEYS. A) DATA ABOUT THE SHALLOW PIEZOMETERS B) DATA ABOUT THE DEEP AQUIFER.NUMBER IN BRACKETS REPRESENT THE DEPTH OF DATA SAMPLING ... 106
FIG.5.9:SAL AND WATER TABLE LEVEL ABOUT THE LAT12 PIEZOMETER.THE VALUES COLLECTED DURING THE FALLS, INSTEAD OF SHOWING A SAL DECREASING TREND, SHOWED INCREASING SAL VALUES ... 107
FIG.5.10: A) LOCATION OF THE 2D VERTICAL SECTION; B) 2D VERTICAL MODEL GEOMETRY: THE MODEL DESCRIBES AN UNCONFINED AQUIFER AND IT IS ASSUMED THAT A CLAYEY-SILT HORIZON LIES AT THE BOTTOM OF THE MODEL.THE MODEL GEOMETRY IS NOT IN SCALE.AH=119 M;BH=153 M;BC=5.5 M;CD=1.3 M;DE=8 M;EF=4.2M;FG=280 M;AG=11 M. ... 107 FIG.5.11: PARTICULAR OF THE MODEL AT THE RIVER BANK WITH A GRID DENSITY OF 31.35 TRIANGULAR ELEMENTS/M2; AT THE RIVER BOTTOM
IT IS POSSIBLE TO SEE A THICKENING OF THE GRID ... 109 FIG.5.12(A) A SIMULATION OF 1000 DAYS DETERMINED A SALT-WEDGE SHAPED PLUME IN STEADY-STATE CONDITIONS, NECESSARY FOR THE
MODEL IMPLEMENTATION;(B) ALSO A 30 DAYS SIMULATION CAN DETERMINE A SALT-WEDGE SHAPED PLUME BUT IT CANNOT BE USED FOR THE MODEL INITIAL CONDITIONS.THE PINK LINE INDICATES THE LAT12 PIEZOMETER POSITION AND THE BLACK LINE REPRESENTS THE 0 M A.S.L. LINE ... 110 FIG.5.13: TRANSLATED WATER TABLE AND CANAL DAILY AVERAGE LEVELS.IT CAN BE OBSERVED HOW THE CANAL LEVEL IS FREQUENTLY
HIGHER THAN WATER TABLE LEVEL, MAINLY DUE TO THE RAINFALL EFFECT ... 111 FIG.5.14: HYDRAULIC GRADIENT DIRECTION OBTAINED SUBTRACTING THE CANAL LEVEL TO GROUNDWATER LEVEL.POSITIVE VALUES (ABOVE THE RED LINE) INDICATE A HIGHER CANAL WATER LEVEL, WHILE THE NEGATIVE ONES (BELOW THE RED LINE) INDICATE A HIGHER WATER TABLE LEVEL.WHEN THE VALUES ARE POSITIVE THE HYDRAULIC GRADIENT IS DIRECTED TOWARD GROUNDWATER, VICE VERSA WHEN THEY ARE NEGATIVE AN OUTFLOW FROM THE AQUIFER TO THE CANAL IS EXPECTED ... 112 FIG.5.15:1ST
STAGE ABOUT THE SALT-WEDGE MOVEMENT, DOMINATED BY A CANAL-DOMINATED HYDRAULIC GRADIENT.IN THIS STAGE THE SALT-WEDGE SHAPED PLUME MOVES TOWARD THE INLAND BOUNDARY CONDITION AND AT ITS FINAL STAGE IT CHANGES IN A SALT
-DOME SHAPED PLUME.THE PINK LINE INDICATES THE LAT12 PIEZOMETER POSITION AND THE BLACK LINE REPRESENTS THE 0 M A.S.L. LINE ... 113 FIG.5.16:2ND
STAGE OF THE PLUME MIGRATION, DOMINATED BY A CANAL WARD HYDRAULIC GRADIENT.AT THIS STAGE ANOTHER SALT
-WEDGE DEVELOPED.THE PINK LINE INDICATES THE LAT12 PIEZOMETER POSITION AND THE BLACK LINE REPRESENTS THE 0 M A.S.L. LINE ... 113 FIG.5.17:3RD
STAGE OF THE SALINE PLUMES MIGRATION.AT THIS STAGE A NEW CANAL-DOMINATED HYDRAULIC GRADIENT DETERMINED A PLUME MOVEMENT TOWARD THE INLAND BOUNDARY.A NEW SALT-DOME WAS GENERATED.THE PINK LINE INDICATES THE LAT12
PIEZOMETER POSITION AND THE BLACK LINE REPRESENTS THE 0 M A.S.L. LINE ... 113 FIG.5.18: LAST STAGE OF THE MODEL SIMULATION: A NEW GROUNDWATER-DOMINATED HYDRAULIC GRADIENT MOVED BACK THE SALT-DOME
SHAPED PLUME TO THE CANAL, WHERE ANOTHER SALT-WEDGE IS DEVELOPING.THE PINK LINE INDICATES THE LAT12
PIEZOMETER POSITION AND THE BLACK LINE REPRESENTS THE 0 M A.S.L. LINE ... 114 FIG.5.19: LOCATION OF THE OBSERVATION POINT 1(OP1) LOCATED AT THE AQUIFER BOTTOM (PINK FLAG).THE PINK LINE INDICATES THE
LAT12 PIEZOMETER POSITION AND THE BLACK LINE REPRESENTS THE 0 M A.S.L. LINE ... 114 FIG.5.20: GRAPH SHOWING SIMULATED AND OBSERVED GROUNDWATER-LEVEL ALTITUDES (A) AND CONCENTRATIONS (B) FOR THE TRANSIENT
MODEL ... 115 FIG.5.21: TREND LINE ABOUT THE EXPERIMENTAL AND SIMULATED DATA, THAT SHOW AN INCREASE OF THE SAL VALUES DURING THE FALLS
... 115 FIG.5.22: SIMULATED SAL VALUES COLLECTED AT THE OP1 LOCATED AT THE LAT12 PIEZOMETER.IT CAN BE SEEN A STRICT DEPENDENCE OF
SAL TREND ON THE HYDRAULIC GRADIENT STAGES ... 116 FIG.5.23: RESULTS OF SIMULATION OF DIFFERENT SAL SCENARIOS ON THE CONCENTRATIONS AT OP1 FROM DAY 1 TO DAY 170.SCEANARIO1
-VARIABLE SAL OF 1 G/L,12 G/L AND 35 G/L;SCENARIO2- CONSTANT SALINITY OF 35 G/L;SCENARIO3- CONSTANT SALINITY OF 1
G/L;SCENARIO4- CONSTANT SALINITY OF 15 G/L;SCENARIO5- RANGING SALINITY BETWEEN 12-35 WITHOUT FLUSHING EVENTS
... 117
TABLE INDEX
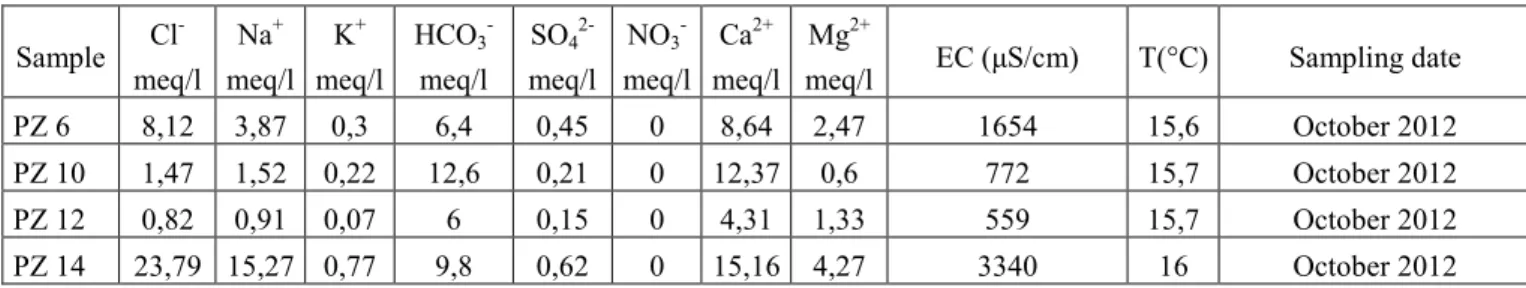
TABLE 1.1: MONTHLY AVERAGE TEMPERATURES REGISTERED EVERY 1 HOUR………..……28 TABLE 2.1:CHEMICAL ANALYSIS OF THE MAJOR ELEMENTS EXPRESSED IN MEQ/L, ABOUT OCTOBER 2012………...40
R
IASSUNTO
Le piane costiere rappresentano le aree maggiormente abitate del pianeta poiché favoriscono un rapido sviluppo sia dal punto di vista urbano, agricolo che industriale. La principale risorsa delle piane costiere è rappresentata dalle acque sotterranee, che ben si prestano a soddisfare le esigenze idriche per queste attività. Gli acquiferi costieri rappresentano il punto di incontro tra le acque dolci di natura continentale e le acque salate di origine marina. Le acque dolci tendono a sovrastare le acque salate a causa della loro minor densità, dando vita ad un delicato equilibrio. Alcuni processi, sia naturali che antropici, possono tuttavia turbare questo equilibrio, determinando un incremento di salinità nelle acque sotterranee. La principale attività umana in grado di determinare la salinizzazione degli acquiferi costieri è la risalita della zona di interfaccia dovuta ai pompaggi (upconing). Fattori naturali sono invece l’intrusione laterale, la dissoluzione di evaporiti, la contaminazione da acque salate fossili, gli aerosol marini e l’intrusione del cuneo salino lungo i fiumi. Proprio questi ultimi due processi sono stati approfonditi nel presente lavoro, poiché poco studiati in ricerche di carattere regionale.
L’obiettivo di questa tesi è stato lo studio della salinizzazione delle falde costiere indotta da fiumi o canali antropici, determinata dall’azione dei venti o dalla variazione del deflusso fluviale nel tempo, in zone dove coesistono aree protette ed aree fortemente antropizzate: il Delta del Tevere e La Piana Pontina. Le due aree sono state scelte poiché presentano numerose analogie: entrambe sono composte da sistemi acquiferi sedimentari multistrato e presentano una morfologia costiera fortemente condizionata da opere di bonifica dei secoli scorsi. La maggiore differenza consiste nella presenza di diversi corpi idrologici: nel Delta del Tevere è presente un grande fiume che condiziona i meccanismi di salinizzazione dell’area, mentre nella Piana Pontina sono i laghi costieri ed i canali di bonifica a determinare la distribuzione ed il movimento delle acque salate.
Questo studio è stato eseguito con numerosi metodi come i rilevamenti idrologici ed idrogeologici, rilevamenti multitemporali dei parametri chimico-fisici delle acque di falda lungo le aree costiere, rilevamenti idrochimici, utilizzo di tecniche di monitoraggio remoto, analisi statistiche per l’interpretazione dei dati metereologici e l’utilizzo delle più innovative tecniche di modellazione numerica. Nell’area del Delta del Tevere si è riconosciuta l’importanza dell’effetto dei venti sui processi di salinizzazione, osservando che i venti possono causare sia la messa in posto del cuneo salino nella foce del Tevere, sia la deposizione dello spray marino sulle chiome degli alberi della Riserva Naturale del Litorale Romano. Il cuneo salino nel Tevere, osservato fino ad 8.8 km dalla foce, è ritenuta la causa più probabile di salinizzazione nell’area alluvionale di Ostia Antica. Inoltre i rilevamenti idrogeochimici regionali svolti in quest’area, hanno consentito l’identificazione di processi di freshening legati a scambio ionico, dovuti alla presenza di saline attive nell’area nei secoli scorsi.
Nell’area Pontina, in corrispondenza della fascia costiera che ospita il Parco Nazionale del Circeo, la salinizzazione è risultata legata alla presenza di acqua marina nei canali di bonifica e nei laghi costieri.
Come suggerito dal titolo della tesi, lo scopo finale del lavoro è stato l’implementazione di un modello numerico per analizzare i processi di salinizzazione. La modellazione numerica consente infatti di investigare ed analizzare pù approfonditamente ciò che avviene in un sistema idrogeologico complesso. La modellazione è stata realizzata usando il
software FEFLOW per tentare di comprendere le relazioni tra la salinizzazione delle acque sotterranee e quelle di un
canale di bonifica. Il modello in 2D, implementato in regime di trasporto di flusso e massa transitorio, è stato sviluppato alla foce del Canale Moscarello (Pianura Pontina), dove si è rilevata la presenza del cuneo salino. Il canale è risultato soggetto a significative variazioni di flusso, capaci di determinare un gradiente idraulico con conseguente trasporto di massa nell’adiacente acquifero. Questo trasporto di acqua attraverso il fondo alveo è risultato in grado di determinare il movimento di un plume salino presente nell’acquifero, condizionando quindi i valori di salinità raccolti in un piezometro.
A
BSTRACT
Coastal plains represent the most populated areas of the world because they allow an industrial, urban and agricultural development. Groundwater is the main resource in coastal plains and it can satisfy the water demand for these activities. Coastal aquifers represent the place where continental freshwater and seawater meet. Freshwater tends to overly seawater because of its lower density, creating a fragile balance. Nevertheless some processes, both natural and anthropic, can perturb this balance determining groundwater salinization. The main human induced salinization process is the upconing. Natural processes can be the lateral intrusion, evaporite dissolution, fossil water contamination, sea spray aerosol deposition and salt-wedge intrusion in river mouths. Last two processes were deepened in the present study because they are usually not so diffused in regional researches. The aim of this thesis was the study of groundwater salinization induced by rivers or anthropic canals, determined by the wind action or the variation of fluvial discharge rate in time, in areas where protected and anthropic areas coexist: the Tiber Delta and the Pontina Plain. The areas were chosen because they exhibit analogies: both are composed by multi-layered sedimentary aquifers and coastal morphology is strongly affected by reclamation works of the past centuries. The major difference is represented by the presence of different hydrological bodies: in the Tiber Delta area a great river is present and it influences salinization mechanisms in the hydrogeological system, whereas in the Pontina Plain lakes and reclamation canals determine the distribution and movement of seawater.
This study was developed with several methods, such as hydrological and hydrogeological surveys, multi-temporal chemo-physical surveys of groundwater, hydrochemical surveys, remote sensing techniques, statistical analyses about meteorological data and the use of the most innovative techniques of numerical modeling.
In the Tiber Delta area the importance of the westerly winds for the salinization processes was investigated. In fact the winds determine both a salt-wedge emplacement in the Tiber mouth during the falls, and a groundwater salinization in the Litorale Romano Natural Reserve pine forest because of sea spray aerosols deposition.
The salt-wedge presence in the Tiber River, noticed up to 8.8 km from the Tiber mouth, is supposed to be the more likely reason of the seawater intrusion processes identified in the alluvial area of Ostia Antica. Furthermore regional hydrochemical analyses permitted to identify freshening processes ascribable to ion-exchange, related to the presence of historical solar salt works in the Ostia Antica area.
In the Pontina Plain, along the coastal area which hosts the Circeo National Park, salinization resulted linked to the presence of seawater in reclamation canals and lakes.
As suggested by the dissertation title, the final aim of the work was the implementation of a numerical model, to detect salinization processes. The use of numerical modeling is a further investigation tool to analyze and quantify what happens in a complex hydrogeological system. The implementation of numerical modeling was performed using the software FEFLOW 6.0, to understand the relationships between groundwater and a reclamation canal salinization. The 2D model, implemented in a transient flow-mass transport state, was located at the Moscarello Canal mouth (Pontina Plain), where a salt-wedge intrusion was noticed. The canal resulted to be subject to a strong discharge modification, which is able to determine a hydraulic gradient and a consequent mass transport in the adjacent aquifer. This transport through the canal bottom resulted able to induce the movement of a saline plume present in the aquifer, determining hence an enhancement of salinity values collected in a piezometer.
G
ENERAL
I
NTRODUCTION
Coastal plains usually represent preferential areas regarding the anthropic, industrial and agricultural settlements (Capaccioni et al. 2005). Coastal aquifers are the subsurface equivalents of coastal areas where continental fresh groundwater and seawater meet (Post 2005). The effects of increasing groundwater extraction determine an increasing salinity in coastal aquifers. Salinity is an indication of the concentration of dissolved salts in surficial waters or groundwater. The ions responsible for salinity include the major cations (Ca2+, Mg2+, Na+ and K+) and major anions
(CO32-, HCO3-, SO42- and Cl-) but the most significant are Na+ and Cl- because they are the main components of
seawater (Sverdrup et al. 1942).
Usually freshwater and seawater are in a dynamic balance in a coastal aquifer. This balance was described for the first time by Drabbe and Badon Ghyben (1889) and Herzberg (1901) and it is also known as the Ghyben-Herzberg relation:
Eq.1
Eq.1 relates the elevation of the water table (h) to the depth of the boundary of the interface between freshwater and the underlying saltwater zones of an aquifer (z) and it is based on the balance of the height of two columns of fluids of differing density. Freshwater (ρf) has a density of about 1.000 g/cm3 at 20°C, whereas that of seawater (ρs) is about
1.025 g/cm3. Although the difference between the density of freshwater and seawater is small, Eq. 2 indicates that this
density contrast results in 40 m of freshwater below sea level for every 1 m of freshwater above sea level, that is:
Eq.2
As stated above, the Ghyben-Herzberg relation describes the dynamic balance between freshwater and seawater in a coastal aquifer. Actually other processes can determine an aquifer salinization, either naturally or resulting from human activities (NRM 2014).
Natural salinity, as known as primary salinity, can occur for several processes including:
• sea salt aerosol (SSA) deposition: it consists in the dry deposition of sea spray particles transported by the wind from the sea surface to the land, where they accumulate on the coastal tree foliage (Lewis and Schwartz 2004); • lateral intrusion: it is the movement of seawater from sea to the bottom of an aquifer as a consequence of a
recharge reduction (Ward et al. 2009);
• salt-wedge intrusion: it happens when a water course carrying freshwater, reaches a basin with saline water (sea, ocean or inland sea) and the saline water tends to propagate into the river mouth, affecting the quality of water (UNESCO 1991);
• evaporite dissolution: it takes place when a dissolution of evaporite deposits occurs, with a consequent increase of salt content (Panno et al. 2006)
• fossil seawater contamination: this salinization is due to the mixing between groundwater and paleo-saline waters. Paleo-saline waters are defined as groundwater formed under previous climatic conditions and hydrogeological settings (Edmunds 2001).
Human activity as well can determine salinization processes, known as secondary salinity. The main process are: • upconing: it occurs when a pumping of freshwater causes a cone of the freshwater head around the well (Bear
et al. 1999). This cone, in turn, determines an upward movement of seawater for the Ghyben-Herzberg Principle;
• reclamation activities: they can determine a reduction of the dune systems and consequently facilitate the movement of saline waters inland (Antonellini et al. 2008); furthermore the dug of a drainage network can increase the potentiality of seawater to penetrate coastal areas;
• irrigation: especially in arid and semi-arid zones, high water table levels can determine a mobilization of salts accumulated near the soil surface (Smedema and Shiati 2002).
An easy and diffused method to detect the salinity presence in groundwater and surficial waters is the Electrical Conductivity. In fact it can represent an indirect salinity marker because a linear relationship exists between EC and Cl
-content (Cruz et al. 2011; Kelly 2005). The main method to identify the salinity presence in this PhD thesis was the Electrical Conductivity, measured in coastal wells, piezometers, lakes, rivers and drainage canals. This work developed with the help of the research group of the “Laboratorio di Idrogeologia Numerica e Quantitativa (LINQ)” of the Roma Tre University. Field investigations covered a time range from the beginning of 2011 to the end of 2013. They were carried out in two areas located in two coastal plains along the Tyrrhenian coast line of the Latium Region. They were chosen because in the last decades the LINQ carried out several researches in these areas, which allowed to have a great stratigraphic and well data availability. Furthermore the areas show very similar geological characteristics because they consist in sedimentary multi-lyered coastal aquifers and they were interested by reclamation activities in the past centuries. The surveyed areas include the Litorale Romano Natural Reserve (near Rome) and the Circeo National Park (nearby Latina City). Both the study areas show a dense hydrografical network deriving from the reclamation activities and the presence of natural rivers, which drive the salinization processes.
Study areas include also the coastal plain of the Tiber River, lying on the hydrographical left of the Tiber River and the whole Pontina Plain sector, delimited by the coast line and the Sisto River (Fig.0.1). In Pontina Plain a further area was investigated. It is located on the hydrographical right of the Moscarello Canal mouth, occupied by an ex-industrial area belonging to “Società per la Gestione degli Impianti Nucleari (SOGIN)” (Fig.0.1). At the end of the surveys an overall surface of about 300 km2 was investigated, 260 km2 and 40 km2 for Pontina Plain and the Tiber Delta respectively.
Studies were conducted using 2500 € of research founds. The economic support was provided by the University of Roma Tre. Money was spent for the data collection, to participate to national and international congresses and to move to the University of Queensland, (Brisbane, Australia), to implement a numerical model.
STRUCTURE OF THE THESIS AND AIMS
The present work is divided in five chapters and it is structured as a series of scientific papers, due to the several salinization processes identified during the experimental surveys. This work organization, suggested by the most recent guidelines coming from Cambridge University (Gustavii 2013), gives a lot of advantages such as a major probability to be read by others and a quicker and wider possibility to spread the papers through electronic journals. Furthermore a paper structure is well defined, established and universal and every chapter can be separated from the overall work. At the moment of writing, chapter 1, titled “Wind-induced salt-wedge intrusion in the Tiber River mouth (Rome-Central Italy)” has already been published on the Environmental earth Sciences international journal (see appendix 1).
The thesis is divided in two sections: chapters 1-3 belong to the Section A, which describes salinization processes about the Tiber River Delta area; chapters 4-5 are part of the Section B, which includes the topics faced in the Pontina Plain area.
The two study areas were contextualized by means of regional surveys, to analyze groundwater patterns and their evolution in time. Furthermore Multi-temporal chemo-physical surveys along the coastal areas and remote sensing techniques allowed to identify the main salinization processes, discerning the anthropic and natural salt contamination sources. Statistical analisys were developed for the meteorological data interpretation.
Despite of several hydrogeological salinization processes, the dissertation holds a main guideline: it focused on groundwater salinization induced by rivers and anthropic canals, due to wind effect and river discharge modification in time, in areas where anthropic and protected areas coexist. The study of the effect of the river discharge on coastal aquifer salinization was performed with the help of the most innovative techniques of numerical modeling, improved at the Department of Civil Engineering of the University of Queensland, Brisbane, Australia.
The Tiber River Delta regional surveys described in the chapter 3 were combined with hydrogeochemical analyses and allowed to relate the salinity sources to the above mentioned salinization processes: the salt-wedge presence in the Tiber River, noticed up to 8.8 km from the Tiber mouth, is the more likely reason of the seawater intrusion processes identified in the alluvial area of Ostia Antica. SSA deposition is the main vehicle of salinization in the Castel Fusano Natural Reserve pine forest, located along the coast line. Hydrogeochemical analyses permitted further to identify freshening processes ascribable to ion-exchange, related to the presence of historical solar salt works in the Ostia Antica area.
Chapter 4 focused on groundwater salinization related to the presence of seawater in the anthropic canal network and in the coastal lakes of the Pontina Plain, in the area of the Circeo National Park. In that area a strict connection between surface and groundwater salinization was identified, also because of the great reclamation activities of the past century. As suggested by the dissertation title, the final aim of the work was the use of numerical modeling, to detect salinization processes. The use of numerical modeling is a further investigation tool to analyze and quantify what happens in a complex groundwater system. Chapter 5 is about the implementation of numerical modeling using FEFLOW 6.0 (Diersch 2009), to understand the relationships between groundwater and river salinization. The model was implemented at the Moscarello Canal mouth (SOGIN area), in which a salt-wedge intrusion was noticed. The canal, anthropic and dug in the past century, resulted to be subject to a strong discharge modification, which is able to determine inflows of water in the adjacent aquifer. The inflows of water from the canal bottom resulted to be able to push a saline plume present in the aquifer.
REGIONAL GEOLOGICAL AND HYDROGEOLOGICAL SETTING
Geological setting about the Italian peninsula comes from the convergence between the African and the European Plates, that determined the Apennine orogenesis and the Tyrrhenian basin opening (Vai and Martini 2001). The subduction of the African plate under the European plate had a climax in the Miocene and Medium Pliocene (Selvaggi and Chiarabba 1995; Piromallo and Morelli 2003), when the convergence and subduction determined the Apennines formation. Tectonic units were composed mainly by carbonate rocks about the Mesozoic and Cenozoic, that constitute several mounts of the Latium Region [i.e. Lepini Mounts, and the isolated Circeo Mount (Parotto and Praturlon 1975)]. In the Miocene, tectonic convergent processes migrated toward the Adriatic Sea and extensional tectonics developed on the Tyrrhenian side, which created normal faults with a NW-SE trend (Mattei et al. 2008). These faults bordered sedimentary basins, lying in unconformity on the previous orogenic structures (Bossio et al. 1998). Along the crustal discontinuities the volcanism developed from the Medium Pleistocene along the Latium Tyrrhenian margin (De Rita et al. 1994; Peccerillo 2005).
In the Pliocene and Lower Pleistocene, the Tyrrhenian edge was subject to several transgressive and regressive phases, that created thick sedimentary deposits (Barberi et al. 1994; Cosentino et al. 2006). At the base of the sedimentary succession, thick clayey deposits developed. They represent the regional aquiclude of the two study areas. The morphology of the impermeable basement was described by Barberi et al. (1994) and results strongly affected both by tectonics and the presence of the volcanic complexes (i.e. Colli Albani Volcanic Complex).
In the Tiber Delta Area, the impermeable basement is overlaid by the Tiber Depositional Sequence
(Milli et al. 2013). In the Pontina Plain the regional aquiclude is overlaid by clastic sediment of marine, alluvial, marsh, lagoon and beach ridge environment (Barbieri et al. 1999; Kamermans 1991).
From a historical point of view, the two macro areas show several similarities: both of them were interested by strong reclamation activities in the past centuries, that changed the morphological and hydrological pattern substantially (Amenduni 1884; Brunamonte and Serangeli 1996; Serva and Brunamonte 2007). The human activities, along with the geological characteristics, determine complex groundwater patterns, whose morphology changes in time.
Boni et al. (1988) and Capelli et al. (2012) gather together the outcropping deposits located in the studied areas, categorizing them according to the hydraulic potentiality (Fig.0.2). The most represented hydrogeological complex is called “Coastal dune complex” and includes dune sands, beach sands and fluvial sands, with thickness up to tens of
meters. In the study areas swamp-fluvial-lacustrine deposits outcrop as well, provided of low hydraulic potentiality. They are mainly composed by silts and clays, with local intercalations of gravels and travertine and the thickness can reach tens of meters. In the Tiber Delta area the recent alluvial hydrogeological complex outcrops, formed by fluvial sands, clays, gravels and silts from the Tiber River. The hydraulic potentiality ranges between low to medium-high and the thickness is up to one hundred meters. Both the study areas are characterized in general by low hydraulic gradients and are recharged both by zenithal recharge and from the surrounding mounts that are: Colli Albani Mounts in the Tiber area and Lepini Mounts in the Pontina area.
REFERENCES
Amenduni G (1884) Sulle opere di bonificazione della plaga litoranea dell’Agro Romano che comprende le paludi e gli stagni di Ostia, Porto, Maccarese e delle terre vallive di Stracciacappa, Baccano, Pantano e Lago dei Tartari. Relazione del progetto generale 15/7/1880. Ministero Lavori Pubblici,
Antonellini M, Mollema P, Giambastiani B, Bishop K, Caruso L, Minchio A, Pellegrini L, Sabia M, Ulazzi E, Gabbianelli G (2008) Salt water intrusion in the coastal aquifer of the southern Po Plain, Italy. Hydrogeology Journal 16 (8):1541-1556. doi:10.1007/s10040-008-0319-9 Barberi F, Buonasorte G, Cioni R, Fiordelisi A, Foresi L, Iaccarino S, Laurenzi MA, Sbrana A, Vernia L, Villa IM (1994) Plio-Pleistocene geological
evolution of the geothermal area of Tuscany and Latium. Memorie Descrittive della Carta Geologica Italiana 49:77-134
Barbieri A, Carrara C, Castorina F, Dai Pra G, Esu D, Gliozzi E, Paganin G, Sadori L (1999) Multidisciplinary study of Middle-Upper Pleistocene deposits in a core from the Piana Pontina (central Italy). Giornale di geologia 61:47-73
Bear J, Cheng AH-D, Sorek S, Ouzer D, Herrera I (1999) Geophysical investigations. In: Jacob Bear AHDCSSDO, Ismael H (eds) Seawater Intrusion in Coastal Aquifers - Concepts, Methods and Practises. Kluwer Academic Publishers, Dordrecht, The Nederlands, pp 9-50
Boni C, Bono P, Capelli G (1988) Carta Idrogeologica del territorio della Regione Lazio. Scala 1:250.000. Pubblicazione Speciale Regione Lazio Vol. Unico. Studio Marinelli, Roma
Bossio A, Costantini A, Foresi LM, Lazzarotto A, Mazzanti R, Mazzei R, Pascucci V, Salvatorini G, Sandrelli F, Terzuoli A (1998) Neogene-Quaternary sedimentary evolution in the western side of the Northern Apennines (Italy). Memorie della Società Geologica Italiana 52:513-525
Brunamonte F, Serangeli S (1996) Evoluzione naturale ed intervento antropico nello sviluppo dei fenomeni di subsidenza nella Pianura Pontina. Memorie della Società Geologica Italiana 51:823-836
Capaccioni B, Didero M, Paletta C, Didero L (2005) Saline intrusion and refreshening in a multilayer coastal aquifer in the Catania Plain (Sicily, Southern Italy): dynamics of degradation processes according to the hydrochemical characteristics of groundwaters. Journal of Hydrology 307 (1-4):1-16. doi:10.1016/j.jhydrol.2004.08.037
Capelli G, Mastrorillo L, Mazza R, Petitta M, Baldoni T, Banzato F, Cascone D, Di Salvo C, La Vigna F, Taviani S, Teoli P (2012) Carta Idrogeologica del Territorio della Regione Lazio. Scala 1:100.000 (4 Fogli). S.EL.CA., Firenze - Italy
Cosentino D, Federici I, Cipollari P, Gliozzi E (2006) Environments and tectonic instability in central Italy (Garigliano Basin) during the late Messinian Lago-Mare episode: new data from the onshore Mondragone 1 well (Garigliano plain, central Italy). Sedimentary Geology 188-189:297-317
Cruz JV, Coutinho R, Pacheco D, Cymbron R, Antunes P, Freire P, Mendes S (2011) Groundwater salinization in the Azores archipelago (Portugal). Environmental Earth Sciences 62 (6):1273-1285. doi:10.1007/s12665-010-0615-2
De Rita D, Bertagnini A, Carboni G, Ciccacci S, Filippo M, Faccenna C, Fredi P, Funiciello R, Landi P, Sciacca P, Vannucci N, Zarlenga F (1994) Geological-petrological evolution of the Cerini Mountains area (Latium, Central Italy). Memorie Descrittive della Società Geologica Italiana 49:291-322
Diersch HJG (2009) FEFLOW Reference Manual. DHI-WASY GmbH, Berlin
Drabbe J, Badon Ghyben W (1889) Nota in verband met de voorgenomen puboring nabij Amsterdam. Amsterdam
Edmunds WM (2001) Paleowater in European coastal aquifers – the goals and main conclusions of the PALAEAUX project. In: Edmunds WM, Milne CJ (eds) Paleowaters in Coastal Europe, vol 189. vol Geological Society Special Publication. The Geological Society, Bath, pp 1-16 Gustavii B (2013) How to Prepare a Scientific Doctoral Dissertation Based on Research Articles. Cambridge University Press, New York
Herzberg B (1901) Die wasserversorgundeinigerNordseebâder. Journal gasbeleuchtung und Wasserversorgung 44:815-819, 824-844
Kamermans H (1991) Faulted land: the geology of the Agro Pontino. In: A. Voorrips SHLHK (ed) The Agro Pontino survey project, methods and preliminary results. Amsterdam, p 131
Kelly D (2005) Seawater intrusion Topic Paper. vol 6. WRIA, Island County
Lewis ER, Schwartz S (2004). In: Board AB (ed) Sea Salt Aerosols Production; Mechanism, Methods, Measurement and Models. Washington DC, USA, pp 1-5
Mattei M, Funiciello R, Parotto M (2008) Roma e contesto geodinamico dell'Italia Centrale. In: Funiciello R, Praturlon A, Giordano G (eds) La Geologia di Roma dal cetro storico alla periferia, vol 1. vol Memorie Descrittive della Carta Geologica d'Italia. S.EL.C.A., Firenze, pp 13-24
Milli S, D'Ambrogi C, Bellotti P, Calderoni G, Carboni MG, Celant A, Di Bella L, Di Rita F, Frezza V, Magri D, Pichezzi RM, Ricci V (2013) The transition from wave-dominated estuary to wave-dominated delta: The Late Quaternary stratigraphic architecture of Tiber River deltaic succession (Italy). Sedimentary Geology 284:159-180. doi:10.1016/j.sedgeo.2012.12.003
NRM (2014) Department of Natural Resources and Mines. Government of Queensland. www.nrm.qld.qov.au.
Panno SV, Hackley KC, Hwang HH, Greenberg SE, Kaprac IG, Landsberger S, O'Kelly DJ (2006) Characterization and identification of Na-Cl sources in ground water (vol 44, pg 176, 2006). Ground Water 44 (2):129-129. doi:10.1111/j.1745-6584.2006.00200.x
Parotto M, Praturlon A (1975) Geological summary of the Central Appennines. Quaderni della Ricerca Scientifica 90:257-311 Peccerillo A (2005) Plio-Quaternary volcanism in Italy Petrology, Geochemistry, Geodynamics
Piromallo C, Morelli A (2003) P wave tomography of the mantle under the Alpine-Mediterranean area. Journal of Geophysical Research: Solid Earth 108 (B2). doi:10.1029/2002JB001757
Post VEA (2005) Fresh and saline groundwater interaction in coastal aquifers: Is our technology ready for the problems ahead? Hydrogeology Journal 13 (1):120-123. doi:10.1077/s10040-004-0417-2
Selvaggi G, Chiarabba C (1995) Seismicity and P-wave velocity image of the Southern Tyrrhenian subduction zone. Geophysical Journal International 121:818-826. doi:10.1111/j.1365-246X.1995.tb06441.x
Serva L, Brunamonte F (2007) Subsidence in the Pontina Plain, Italy. Bulletin of Engineering Geology and the Environment 66 (2):125-134. doi:10.1007/s10064-006-0057-y
Smedema LK, Shiati K (2002) Irrigation and salinity: a perspecive review of the salinity hazards of irrigation development in the arid zone. Irrigation and Drainage Systems 16:161-174
Sverdrup HU, Johnson MW, Fleming RH (1942) Chemistry of Seawater. In: Inc. P-H (ed) The Oceans - Their Physics, Chemistry and General Biology. New York, pp 165-227
UNESCO (1991) Guidelines on the study of seawater intrusion into rivers. United Nations Educational, Scientific and Cultural Organization, Paris Vai GB, Martini I (2001) Anatomy of an orogen: The Appennines and adjacent Mediterranean basin. Bodmin Kluwer Academic, Dodrecht Ward J, Werner AD, Howe B (2009) Saltwater intrusion in Southern Eyre Peninsula. Eyre Peninsula Groundwater, Allocation and Planning Project,
C
OLLABORATIONS
The research activity was conducted in collaboration with many state and local authorities. In the Tiber Delta they were:
• the office of “Servizio di Polizia Provinciale e Protezione Civile” led by Alessio Argentieri, which offered the means to realize the navigation along the Tiber River; the surveys were supported by Dr. Sara Taviani and Dr. Stefano Viaroli
• the surveys inside the Litorale Romano Natural Reserve were conducted with the authorization of the “Dipartimento X - Tutela Ambientale e del Verde and Protezione Civile - Ufficio Gestione Riserva Naturale
Statale Litorale Romano”, of the “Roma Capitale” municipal bureau. This departement was led before by
Romano Maria Delli Santi and after by Tommaso Profeta and under the supervision of the “Corpo Forestale
dello Stato”;
• the surveys in the archeological area of Ostia Antica were possible thanks to the “Soprintendenza Speciale per
i Beni Archeologici” of the “Ministero dei Beni e delle Attività Culturali e del Turismo”, under the
authorization of Maria Rosaria Barbera;
• some surveys were possible also thanks to local authorities as “FIDAL Lazio” and the “Consorzio di Casal
Palocco”;
• a special thanks for the logistical support about the surveys goes to Claudio Papiccio, an agent of the “Polizia
Municipale di Roma Capitale” corps;
• the chemical analytical laboratory to evaluate the water types of the samples collected in the roman area, was offered by the Prof. Paola Tuccimei of the University of Roma Tre;
In the Pontina plain they were:
• the surveys in Pontina Plain were possible thanks to the “Ufficio Territoriale per la Biodiversità di Fogliano”, led by Sergio Zerunian. The personnel of the “Corpo Forestale dello Stato” and especially Alessandra Noal, offered assistance during the data collection and for the logistic base in the Circeo National Park guestrooms; • some aspects of the Pontina Plain studies were carried out with the precious help of Vinicio Gragnanini; • in the ex-industrial area of Borgo Sabotino the collaboration was carried out with the “Società per la Gestione
degli Impianti Nucleari” (SOGIN) staff, under the supervision of Giancarlo Ventura and the precious help of
Michele Rosati;
• the numerical model about the data collected in the SOGIN area was implemented at the University of Queensland, Brisbane, Australia, under the supervision of the Prof. Ling Li and Dr. Pei Xin;
Finally the help of many students was important for the data collection. Three Master’s degrees were supervised and the students Emanuele Ruta, Barbara Zaccaria and Marco Fantini worked hard to obtain good scientific results.
1. WIND-INDUCED
SALT-WEDGE
INTRUSION
IN
THE
TIBER
RIVER
MOUTH
(ROME-CENTRAL
ITALY)
ABSTRACT
The wind effect on river water quality was illustrated by means of thermohaline measurements carried out in the Tiber River in May 2012. The survey was carried out using a boat, in stations located in the two Tiber branches: Fiumara Grande and Traiano Canal. Thermohaline variables (salinity and temperature) were used to describe the water-type patterns and to define the salt-wedge position. Although the river flow rate was rather high, saltwater intrusion happened. Wind data suggested that the more probable cause of salt-wedge intrusion was the wind action. Especially wind speeds higher than 4 m/s are able to dominate the sea current at surface layers, determining an increase in the sea level. Therefore westerly winds determined a seawater inflow in the river mouths.
1.1 INTRODUCTION
Coastal areas are the most important environments for the human development due to the great water resources availability and climatic quality. The increasing urbanization, industrialization and agricultural requirements lead to various problems such as depletion of groundwater, deterioration of water quality, land subsidence and salinization (Capaccioni et al. 2005; Park et al. 2012). Really salinization became a very important issue in water management problems all over the world (Barlow and Reichard 2010; Trabelsi et al. 2012) and it is mainly caused by:
• evaporite dissolution (Ahmed et al. 2013); • fossil seawater (Farid et al. 2013); • seawater intrusion (Tran et al. 2012).
Seawater intrusion is defined as the mass transport of saline waters into zones previously occupied by fresher waters (Bear et al. 1999). In coastal areas, rivers are preferential way to lead seawater inland, through salt-wedge intrusion (Custodio and Llamas 2005). Salt-wedge intrusion happens when a water course carrying fresh-water, reaches a basin with saline water (sea, ocean or inland sea) and the saline water tends to propagate into the river mouth, affecting the quality of water (UNESCO 1991). Whereby the salt’s front position moves upstream in close proximity to pumping areas, the direction of flow between the aquifer system and the river can be reversed, determining seawater intrusion in groundwater (Barlow 2003). In the last decades several authors (Eagling et al. 2012; Pezzetta et al. 2011; Teien et al. 2006; Wong 1994; Wong et al. 2013) are pointing attention on estuarine environments to understand the problem of mobilization of metals and trace elements, connected to seawater intrusion. For this reason, understanding how the salt-wedge intrusion occurs, can help researchers to understand water chemistry modifications. Several authors (Fagerburg and Alexander 1994; Sierra et al. 2004; Zhou et al. 2012) have focused attention on salt-wedge intrusion in several world rivers, emphasizing the importance of freshwater river discharge, because it can represent a hydraulic barrier to the salt-wedge progress inland. Other authors (Lenkopane et al. 2009; Robinson et al. 2007a; Robinson et al. 2007b) concentrated their studies on tidal effect and how it can strongly affect the salinization of a river, and consequently groundwater salinization. The implications of river morphology on salt-wedge propagation were investigated both by laboratory experiments (Fujiwara et al. 1997) and by experimental surveys (Qian and Ishikawa 2003), demonstrating for example, the importance of shallow bathymetries in the river bottom morphology, on the intensity and frequency of a saltwater wedge intrusion effect. River discharge and morphology can therefore influence the salt-wedge shape. Pritchard (1955) classified the river estuaries on the basis of vertical structure of salinity. This classification considers the competition between buoyancy forcing from river discharge and mixing from tidal forcing. Mixing from tidal forcing is proportional to the volume of oceanic water entering the estuary during every tidal cycle (Valle-Levinson 2010). Fig.1.1 shows salinity patterns with respect to different equilibrium cases, between river discharge and tide
In this context several studies have been conducted to understand the relationships between the winds and the wind induced flows, in gulfs (Murray and Johns 1997) or straits (Valle-Levinson and Blanco 2004) and how wind can even strongly influence wind-forced upwelling dynamics (Macias et al. 2012; Roegner et al. 2011). deCastro et al. (2000) focused attention on wind and tidal influence on water circulation in an estuary, finding close connections between wind direction and the current developing at the sea surface layer. This assumption is based on the quadratic stress law of Large and Pond (1981): Uw=√ ρa /ρw W, where, Uw is water velocity, ρa and ρw are air and water densities respectively
and W is wind speed. This provides a wind induced water velocity of about 3% of the wind velocity. In particular deCastro et al. (2000) noticed that winds with speed higher than 4 m/s are able to induce a sea current speed, bigger than the one induced by tide.
In this study data collected in the Tiber River were analyzed. The aim of the study is to detect the connections between the wind-induced sea-flows movement and the related salt-wedge emplacement, based on the temperature pattern detected at the river mouth.
Fig. 1.1: haloacline patterns (after Valle-Levinson, 2010): A) large river discharge and weak tidal forcing result in salt-wedge estuaries; B) weakly stratified or partially mixed estuaries result from moderate to strong tidal forcing and weak to moderate river discharge; C) moderate to large river discharge and weak to moderate tidal forcing result in strongly stratified estuaries; D) strong tidal forcing and weak river discharge result in vertically mixed estuaries
1.2 STUDY AREA
Tiber River is 405 km in length and it rises in Tuscany at about 1268 m a.s.l.. Its basin comprises 1.7*104 km2 and it crosses the regions of Tuscany, Emilia Romagna, Umbria and Latium. After crossing the urban area of Rome (La Vigna et al. 2010; La Vigna et al. 2013) it flows into the Tyrrhenian Sea forming an estuary with two branches, the northernmost Traiano Canal (TC) and the southernmost Fiumara Grande (FG), divided by a small island (Fig.1.2). The Tiber River at its mouth flows in the alluvial sediments about the High Stand System Tract of the Tiber Depositional Sequence, developed from 6000 to 5000 years BP. This sequence is mainly composed by clay, silt, sand and organic matter lenses (Milli et al. 2013, for a further description see chapter 3.2). These deposits allow a hydraulic communication between groundwater and the river. In general flow paths are directed toward the river, except in the area of Ostia Antica (Fig.1.2), where the ground level is below the river level and water table is below the mean sea level (see chapter 3.6).
Tiber River shows variable discharge, increasing in the October-June period and decreasing from July to September. Data collected from the Ripetta water gauge during the decade 2002-2011 (IdrograficoLazio 2012a), show an average monthly value of discharge of about 162 m3/s with maximum and minimum values of about 478 m3/s and 73 m3/s, in December 2005 and August 2007 respectively. TC receive about the 20% of the Tiber flow rate (Mikhailova et al. 1999). The Tiber River mouth is considered an arched estuary (Ricci Lucchi 1980) of the wave dominated type (Wright