1
Università degli studi “Roma Tre”
Dipartimento di Economia
Scuola Dottorale in Economia e Metodi Quantitativi
Dottorato in Economia dell’Ambiente e dello Sviluppo
XXVIII ciclo
Climate change and developing countries
Giorgia Sforna
Supervisor: Prof.ssa Valeria Costantini
Co-Supervisors: Dott.ssa Mariangela Zoli , Dott. Alessandro Antimiani, Prof. Luca Salvatici
Coordinatore: Prof. Luca Salvatici
2 Contents
Introduction………... 3
Do bilateral commercial relationships influence the distribution of CDM projects?... 5
Interpreting bargaining strategies of developing countries in climate negotiations... A quantitative approach
44
Assessing costs and benefits of current climate change negotiations... 77
3
Introduction
Climate change is one of the greatest challenges the world is facing. Nevertheless, its impacts are not uniformly distributed: developing countries are those which suffer the most. In other words, they are the most vulnerable to climate change, even though they are not responsible for it. Based on this paradox, the Common But Differentiated Responsibilities Principle (CBDR) represents the core principle of the current climate regime: the Kyoto Protocol (KP). It states that “[t]he Parties should protect the climate system for the benefit of present and future generations of humankind, on the basis of equity and in accordance with their common but differentiated responsibilities and respective capabilities. Accordingly, the developed country Parties should take the lead in combating climate change and the adverse effects thereof” (Art. 3.1). Consequently, at the beginning of climate debate the main objective was to get Annex I countries to ratify the KP whereas developing country concerns remained marginal. However, last years have been characterized by an increasing role of developing countries both in emission levels and climate negotiations. Indeed, during the current negations to define a new climate regime to be implemented in 2020, the attention devoted to developing countries' interests results in several decisions concerning both adaptation and mitigation (NAMAs, NAPs, Green Climate Fund, Technology Transfer Mechanism). Moreover, the share of GHG emissions by developing countries, and in particular emerging economies, is expected to substantially increase in the future. This has exacerbated the debate about the CBDR Principle, considering how crucial active involvement of the developing part of the world is in climate actions. In this regard, the Paris Agreement, reached last December during the 21st Conference of the Parties (COP21), is still based on the principles of equity and CBDR but represents a timid step forward towards a burden sharing involving all countries. Indeed, it states that “Developed country Parties should continue taking the lead by undertaking economy-wide absolute emission reduction targets” while “developing country Parties should continue enhancing their mitigation efforts, and are encouraged to move over time towards economy-wide emission reduction or limitation targets in the light of different national circumstances” (Art. 4.4).
In the light of the foregoing considerations, the research project aims to investigate how the role of developing countries in the fight against climate change has been changing over time. The research consists of three papers. The first one investigates the role of developing countries in the Kyoto Protocol
4
first commitment period (2008-2012) and, in particular, the focus is on the Clean Development Mechanism (CDM), the only instrument that directly involves them. The second paper analyzes the role of these countries in post 2012 negotiations, with particular emphasis on the role that their heterogeneity plays in the formation of coalitions and in the negotiation process. Finally, the third one investigates costs and benefits of ongoing climate negotiations and the role that a compensatory measure specifically designed to meet developing countries’ needs can have in fostering the realization of a more effective climate agreement.
5
Do b
Do b
Do b
Do bilateral commercial relationships
ilateral commercial relationships
ilateral commercial relationships
ilateral commercial relationships influence the distribution
influence the distribution
influence the distribution
influence the distribution
of CDM
of CDM
of CDM
of CDM projects?
projects?
projects?
projects?
1. Introduction1. Introduction 1. Introduction 1. Introduction
Climate change is recognised as one of the greatest environmental, social and economic threats facing the world. It is a phenomenon that influences all countries, from the most industrialised to the poorest ones, and affects several aspects of daily life. For this reason, the debate on climate change has increased in recent years as well as international efforts to combat this threat. In 1994, the UNFCCC (United Nation Framework Convention on Climate Change) entered into force with the aim of achieving the “stabilisation of greenhouse gas concentrations in the atmosphere at a level that would prevent dangerous anthropogenic interference with the climate system. Such a level should be achieved within a time frame sufficient to allow ecosystems to adapt naturally to climate change, to ensure that food production is not threatened and to enable economic development to proceed in a sustainable manner” (art. 2).
The instrument used to achieve this goal is the Kyoto Protocol (KP) which was adopted in Kyoto, Japan, on 11 December 1997 and entered into force on 16 February 2005. The Protocol divides countries into Annex I and Non-Annex I parties, broadly corresponding to industrialised and developing countries. In this regard it is worth noting that developing countries that constitute the Non-Annex I parties are a very heterogeneous group, which includes emerging economies as well as least developed countries.
Since the Kyoto Protocol recognises that developed countries are mainly responsible for the current concentration of greenhouse gas (GHG) emissions in the atmosphere as a result of more than 150 years of industrial activity, it exclusively commits Annex I countries to reduce their emissions in accordance with the principle of common but differentiated responsibilities. The overall goal is to achieve the reduction of GHG emissions to an average of 5.2% compared with 1990 levels over the implementation period 2008-2012.
Under the KP, developed countries must meet their targets primarily through national measures. However, there are also additional tools available for reaching domestic targets represented by Flexible Mechanisms: Emission Trading (ET), Joint Implementation (JI) and the Clean Development Mechanism (CDM).
6
Despite the fact that the first commitment period (2008–2012) of the KP has already passed, the Parties are still discussing what the future of the KP will be. During the 17th Conference of Parties (COP 17), held in Durban in December 2011, the Parties agreed on a set of issues including the implementation of the Green Climate Fund (GCF). The GCF aims to help developing countries cope with climate change, in particular by fostering the diffusion of clean technologies. However, the most important agreement reached during the COP 17 was the deal known as the “Durban Platform for Enhanced Action” in which Parties agreed on the extension of the KP for a second commitment period lasting from 2013 to 2020 (although some countries such as Canada, Japan and Russia did not sign it). Parties will also create a new international treaty by 2015, which should be operational in 2020. Most importantly, this new treaty will contain legally binding commitments for all countries. Moreover, developed countries ask for greater involvement of emerging economies such as Brazil, China and India, in the fight against climate change. So far, these countries have been considered as developing countries and, for this reason, they do not have commitments under the Protocol.
Indeed, at present, the only instrument that also involves developing countries is the CDM. It allows a country with an emission reduction commitment to implement an abatement project in developing countries. These projects can earn Certified Emission Reduction (CER) credits, one of which is equivalent to one ton of CO2 (tCO2e), that can be used by industrialised countries to meet their emission reduction targets under the KP, can be banked for future commitments or can be traded on the carbon market.
The main characteristic of the CDM is related to the fact that it was created in order to achieve a dual purpose: (i) lower the overall cost of reducing GHG emissions released to the atmosphere, giving industrialised countries some flexibility in how they meet their emission reduction targets; (ii) stimulate a sustainable development path in developing countries (Art. 12 of the KP).
As such, the CDM presents a great opportunity for developing countries (especially Least Developed Countries, LDCs), in that hosting a project can both start a new development path and increase a country’s participation in the international forum. This dual objective requires that both goals should be achieved without necessarily giving preference to one over the other. In other words, whether cost efficiency or sustainable development is the leading objective should be a matter of choice for the investing partners.
7
Despite the dual aims of the CDM, the geographical distribution of CDM projects has so far been very uneven, and the goal of fostering a sustainable development path in the least developed economies appears to have been less important than considerations regarding the cost efficiency of such abatement projects. Approximately 70% of registered CDM projects have only been implemented in just three countries - Brazil, China, and India - with only 1.6% of projects implemented in Sub-Saharan Africa. This means that even if the CDM was created to direct investment flows to the poorest developing countries, most of the investments are concentrated in emerging economies and have ignored those countries that need them the most. Thus, we are dealing with a paradox since the richest developing countries are those that benefit the most from this mechanism.
The uneven distribution of projects represents one of the major shortcomings of the CDM. However, there have only been a few analyses in the literature that have sought to delineate the causes of this. So far most of literature has focused on (i) the ability of CDM projects to create sustainable development in host countries, (ii) the capacity to reduce abatement costs in investing countries and (iii) the actual effect of technology transfer (TT) from rich countries to poor economies.
With regard to the first point, we must bear in mind that sustainable development has been defined as development that meets the needs of the present without compromising the ability of future generations to meet their own needs (WCED, 1987) and is characterised by the fact that it encompasses the three dimensions of environment, society and economy. This means that CDM projects promote sustainable development if they contribute to the improvement of the economic, environmental and social conditions of host countries and they can only be implemented if the Designated National Authority (DNA) recognises that they meet the sustainability criteria set by developing countries.1 For this reason, we need to know which criteria are considered the most important ones.
For example Brent et al. (2005) conducted an analysis in order to investigate the main sustainability criteria that a CDM project should respect in the context of South Africa from industry and national government perspectives. This study indicates three main aspects, one for each sustainable dimension: capacity development (training and skills development of project participants and beneficiaries) is
1 The registration of a proposed CDM project activity can only take place once approval letters are obtained from the
DNA of each Party involved, including confirmation by the host Party that the project activity helps it to achieve sustainable development (3/CMP.1, Annex, paragraph 40(a)).
8
recognised as the most important social criterion; water resources (water availability and use, human health impacts etc.) is the most important environmental criterion and the macroeconomic benefits criterion (employment creation, poverty alleviation, increase in export potential etc.) is emphasised as the most important for the economic dimension of sustainable development.
With regard to the second issue concerning abatement cost reductions, it should be stressed that, although the CDM in principle offers a suite of potential contributions to sustainable development (Boyd et al., 2009), recent studies suggest that the CDM’s contribution to local sustainable development has been limited (Olsen, 2007; Sutter and Parreño, 2007). In particular, Sutter and Parreño (2007) analyse the first 16 registered CDM projects to see whether a trade-off between objectives exists. They compare their contribution in terms of emission reductions and sustainable development, measured by three components: local employment generation, the distribution of carbon revenue and local air quality effects. They find a strong contrast that shows how the trade-off is strongly in favour of the cost-efficient emission reduction objective (95.7% of CERs) but neglects the sustainable development objective.
The third aspect related to the CDM that has been widely discussed is represented by its contribution in terms of technology transfer. In fact, although the primary objective of the CDM was not explicitly related to technology transfer, transfer is seen as an important indirect consequence of it. The participation of communities in the implementation of CDM projects can enhance local capacity by starting a process of ‘learning by doing’, which can lead to higher levels of ‘know-how’, education, and the creation of employment. In this way, projects can contribute to a structural change in terms of innovative activity, considered as a major channel through which technological capabilities may lead to better competitiveness performance (see, among others, Montobbio and Rampa, 2005).
However, according to Millock (2002), TT in the CDM context can act as an incentive for cost-effective emissions reductions under bilateral CDM contracts when there is asymmetric information between the investor and the host party. In other words, it provides a motivation that counterbalances any incentives to cheat on emission reductions. In the absence of TT, the host country (i.e. the agent) would have an incentive to exaggerate the emission reduction costs in order to receive a higher compensatory transfer payment,2 whereas, with the technology transfer included, overstating this cost means that the value of
9
the technology for the developing country is emphasized and the agent’s original incentives not to reveal the actual costs are partially counterbalanced.
Finally, of the studies conducted in order to investigate the actual role of the CDM in determining the extent of the transfer of technologies, an example is represented by Haščič and Johnstone (2011), in the field of wind power. They find that the direct contemporaneous effect of the CDM has a positive influence on the transfer between Annex I and Non-Annex I countries whereas, if the cumulative stock of projects is taken into account, the effect is negative. This happens because the implementation of CDM also has an effect on absorptive capacity for host countries so that, according to this study, measures to encourage both technology transfer and domestic innovation capacity should be complementary.
However, the issue related to the relationship between the CDM and the creation and transfer of technology is very controversial especially because using the CDM as a tool to achieve multiple purposes can lead to outcomes that are sometimes conflicting (Bosetti et al., 2011).3
Although the CDM has been widely investigated in recent years, as already mentioned, little attention has been paid to one of its greatest shortcomings: the uneven distribution of projects.
The purpose of this work is to rectify this lack. The main research question here is whether the distribution of CDM investments can be explained by the existence of a well-established bilateral relationship between developed and developing countries. In Section 2, some of the previous literature is considered and a description of some stylized facts concerning the implementation and distribution of CDM projects is provided. Section 3 provides a description of the dataset and empirical methodology used in this analysis. The empirical results gleaned by the econometric estimations are discussed in Section 4. It is concluded in Section 5 that cost-effectiveness as a criterion for abatement efforts has not been the only driving force influencing the decision on destination markets and that bilateral export flows from Annex I economies towards non-Annex I countries explain a large portion of the geographical distribution fact that if, at a later time, the host countries will be subject to a binding emission reduction target, only more expensive options of abatement will remain.
3 According to Bosetti et al. (2011), for example, the effect of reducing emissions from deforestation (RED) on
energy technology R&D and low-carbon technology investments follows two channels: on the one hand, RED makes it possible to reach the policy target with less emission reduction so that investments in the development of new technologies decrease; on the other hand, RED affects technology investments through the impact on fossil fuel prices: since RED allows greater flexibility in reducing fossil fuel consumption, the prices of fossil fuels are higher under the RED than under no-RED policy scenarios and this increases the relative profitability of investments in alternative carbon-free technologies.
10
of CDM projects. Some policy recommendations are also offered. 2.
2. 2.
2. Implementation and distribution of CDM projectsImplementation and distribution of CDM projectsImplementation and distribution of CDM projectsImplementation and distribution of CDM projects 2.1. Literature review
Several factors have been identified in the literature as determinants of the distribution of CDM projects. According to Jung (2005), three factors explain what makes host countries attractive to investing countries and thus the distribution of projects: the emission reduction potential, the general investment environment and the institutional capacity. The latter is particularly important: a country can only host a CDM project if it has ratified the KP and if it has an operating DNA. A host country must also indicate the development priorities that Annex I (i.e. developed) countries should take into account in their projects. As it is, not all developing countries have the experience and the institutional capacity to satisfy these requirements. Foreign direct investment (FDI) flows have also been recognized to be a main factor in attracting CDM projects to host countries. As Desanker (2005) has argued, the lack of FDI in African countries is one of the main reasons why African countries have not attracted many CDM projects. A deeper analysis is carried out by Winkelman and Moore (2011) who develop a probit model that aims to investigate which aspects of developing countries can be considered as attractors of CDM projects where the dependent variable represents binary information about whether a country has hosted projects or not. According to this study, the main factors that contribute to determining the distribution of projects across Non-Annex I countries are represented by the presence of a high level of overall emissions, domestic human capital and a growing electricity sector in host countries. In this case, the level of emissions is considered as the main determinant for CDM distribution: the higher the GHG emissions, the higher the potential for profitable projects by exploiting competitive abatement cost conditions.
Wang and Firestone (2010) also consider GHG emission levels (both in developed and developing countries) as the primary determinant of CDM projects. By relying on a modified gravity model, they build an econometric model in order to investigate the relevance of some aspects that could explain CDM distribution. The most robust findings relate to the role played by GHG emissions since CDM permits are positively correlated to total emissions of host and investing countries and inversely proportional to the geographic distance. In addition, they also investigate some factors that influence transaction costs such
11
as distance, project size, the existence of good infrastructure and the degree of openness of developing countries as well as specific relationships between host and developed country such as a common language or the existence of past colonial relationships.
According to Wang and Firestone (2010), specific emphasis is also given to the degree of openness of host countries to international markets, as a sign of a broad capability to maintain external relationships and reduce transaction costs. Nevertheless, they only considered the level of international trade unilaterally from the perspective of host countries and, indeed, trade-related bilateral relationships were ignored.
In order to fill this gap, in this study the role of trade bilateral relationships is explicitly modeled by modelling a gravity equation where export flows from each investor to each host country are accounted for among the explanatory variables. More specifically, as already mentioned, the research question is if and to what extent the distribution of CDM investments can be explained by the existence of a well-established bilateral relationship (existing trade flows) as a privileged channel of international relationships.
Two ancillary research questions are also tested. Firstly, by considering the energy system of both investors and host countries, we can detect some effects related to the higher installed capacity to produce renewable energy. If we consider renewable energy production as a proxy of the domestic efforts in new green technologies, ceteris paribus, we might expect leaders in renewable technologies to correspond to those countries with a higher propensity to invest in CDMs, in order to maximise benefits from domestic efforts in such new environmental technology domains thanks to the exploitation of competitive advantage in the international market.
Secondly, this study also considers the specific influence played by the quality of the institutions both in investing and hosting countries in order to investigate which aspects of institutional quality influence CDM investments propensity the most.
2.2 The role of sustainable development
The focus here will mainly be on the second policy objective of the CDM, namely sustainable development. The empirical analysis presented here will contribute to disentangling the factors that
12
explain why the objective of stimulating sustainable development in poor economies is not one of the most important criteria used for choosing the destinations of a CDM project. Descriptive statistics of the distribution of CDM projects rely on official information provided by the United Nations Framework Convention on Climate Change (UNFCCC) and the CDM Pipeline from 2005 to 2011. These data give information on the number of projects implemented (by scope, host country and investor), as well as the amount of investments and issued CERs by a host country.
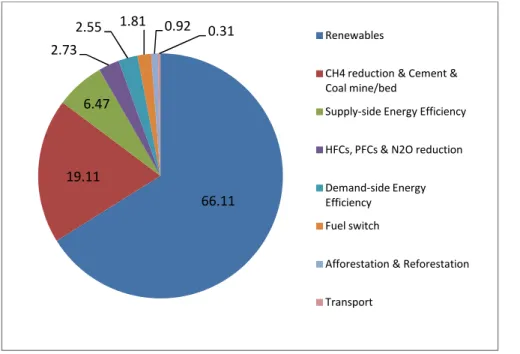
As of 31 December 2011, there were 3931 implemented projects. However, these are distributed unequally in terms of both project type and geography. Figure 1 shows the distribution of projects by type. It is worth noting that 66% of the implemented projects are in the renewables sector, and the percentages of other types of project are considerably lower.
Figure 1 Figure 1 Figure 1
Figure 1 –––– ProjectProjectProject distribution by scope (% of total projects as of 31 December 2011)Projectdistribution by scope (% of total projects as of 31 December 2011)distribution by scope (% of total projects as of 31 December 2011)distribution by scope (% of total projects as of 31 December 2011)
Source: Adapted from UNEP (2012)
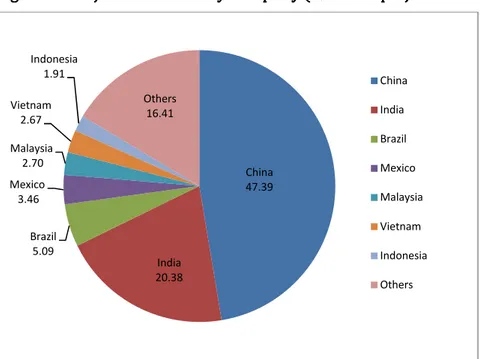
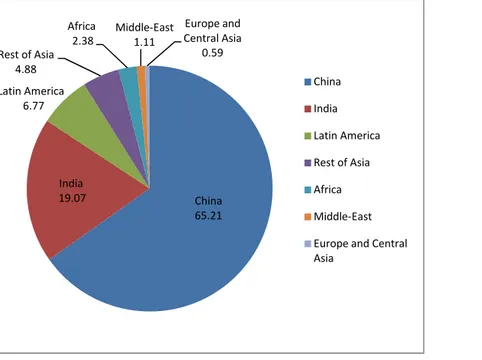
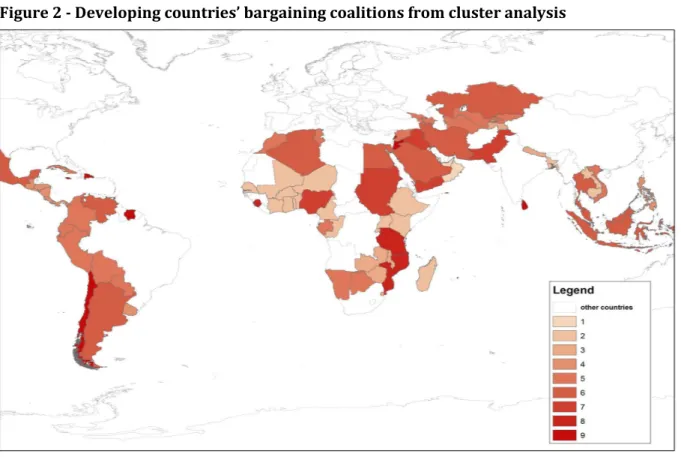
Regarding the geographical distribution of CDM projects, as of 31 December 2011 only 73 developing countries were host to a project (with many hosting just one; see Figure 2). China hosts almost half of the projects, while the LDCs host only 4.6% of them. Even worse, only 1.58% of CDM projects are in Sub-Saharan Africa, where most of the LDCs are located (Figure 3).
66.11 19.11 6.47 2.73 2.55 1.81 0.92 0.31 Renewables
CH4 reduction & Cement & Coal mine/bed
Supply-side Energy Efficiency HFCs, PFCs & N2O reduction Demand-side Energy Efficiency
Fuel switch
Afforestation & Reforestation Transport
13 Figure 2
Figure 2 Figure 2
Figure 2 –––– Project distribution by Project distribution by Project distribution by host party (% of total projects as of 31 December 2011)Project distribution by host party (% of total projects as of 31 December 2011)host party (% of total projects as of 31 December 2011) host party (% of total projects as of 31 December 2011)
Source: Own elaboration on UNFCCC (2012)
Figure 3 Figure 3 Figure 3
Figure 3 –––– Regional distribution (% of total projects as of 31 December 2011)Regional distribution (% of total projects as of 31 December 2011)Regional distribution (% of total projects as of 31 December 2011)Regional distribution (% of total projects as of 31 December 2011)
Source: Own elaboration on UNFCCC (2012).
As a matter of fact, this diagram shows that the CDM is far from achieving its dual purpose, becoming little more than a tool for cost reduction for developed countries, without contributing to the achievement of sustainable development in the poorest countries. In fact, even if sustainability criteria are satisfied for the granted projects, the goal of providing development opportunities to all host countries is a long way off..
China 47.39 India 20.38 Brazil 5.09 Mexico 3.46 Malaysia 2.70 Vietnam 2.67 Indonesia 1.91 Others 16.41 China India Brazil Mexico Malaysia Vietnam Indonesia Others Sub-Saharan Africa 1.58
Asia and Pacific 81.68 Europe 0.38 LAC 17.73 MENA 1.49 Sub-Saharan Africa Asia and Pacific Europe
Latin America and the Caribbean (LAC)
Middle East and North Africa (MENA)
14
The money invested in the CDM, which was around US$188 billion by 2011, was mainly invested in China (65%) (Figure 4).
Figure 4 Figure 4 Figure 4
Figure 4 ---- Destination of CDM investments (% of total investments as of 31 December 2011)Destination of CDM investments (% of total investments as of 31 December 2011)Destination of CDM investments (% of total investments as of 31 December 2011)Destination of CDM investments (% of total investments as of 31 December 2011)
Source: own elaboration on UNEP (2012).
If we compare results in Figures 2 and 4, we can see that CDM investment flows in China have been even larger than the number of projects. This means that there is a great concentration of large size projects in China. Moreover, the number of CERs issued by the host party reflects the distribution of projects, as illustrated in Figure 5. If we compare Figures 2 and 5, it is also worth noting that the only difference is represented by the Republic of Korea. Even if it has hosted fewer projects than Brazil and Mexico, a larger amount of CERs have been issued (9.44% of total CERs) in this country. This evidence tells us that there is some heterogeneity in reduction costs and investment efficiency in implementing CDM projects in different countries.
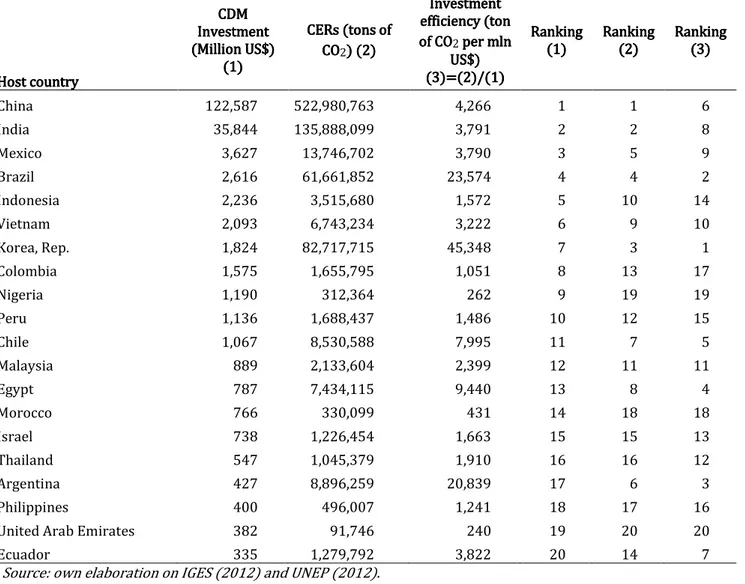
The total number of CERs issued has been increasing over the years. It went from about 350 million up to 2009 to 496 million in 2010 and reached 877 million in 2011 (IGES, 2012; UNFCCC, 2009). As each CER is equivalent to one ton of CO2-eq, this means that so far about 877 Mt CO2-eq. have been abated through CDM projects. Finally, although CDM projects mostly follow the emission reduction objective and neglect the sustainable development one (Sutter and Parreño, 2007), the distribution of projects does not always respect a cost effectiveness criterion. For this reason, Table 1 shows the “Investment efficiency”
China 65.21 India 19.07 Latin America 6.77 Rest of Asia 4.88 Africa 2.38 Middle-East 1.11 Europe and Central Asia 0.59 China India Latin America Rest of Asia Africa Middle-East Europe and Central Asia
15
(calculated as the ratio between the number of CERs and the relative amount of investments) for the first twenty host countries.4
FFFFiiiiggggururureeee 5555 ---- CERs issued by host party (up to 31 December 2011)ur CERs issued by host party (up to 31 December 2011)CERs issued by host party (up to 31 December 2011) CERs issued by host party (up to 31 December 2011)
Source: own elaboration on IGES (2012).
A comparison of the host country ranking for CDM Investment and Investment Efficiency shows that host countries (corresponding to the top ranks) have not been those with the highest efficiency (with the exception of Brazil). The best example is China. It is first in the ranking of host countries both in terms of amount of investments (Ranking (1)) and in terms of issued CERs (Ranking (2)), but if we look at its position in the ranking in terms of efficiency (Ranking (3)), we can see that it loses five positions and is in sixth place. It can also be seen that India, ranked second for CDM Investment and CERs issued, but only eighth for Investment Efficiency, is in a similar position. Conversely, countries such as the Republic of Korea and Argentina, are quite highly ranked in terms of Investment Efficiency despite the fact that they do not attract much investment (they are, respectively, in first and third place in terms of efficiency, gaining six and fourteen positions with respect to the ranking in terms of amount of investments). This phenomenon can be partially explained by the presence of decreasing returns to scale of CDM projects due to concentration. However, these data suggest that there must be other factors that are influencing
4
The best way to compare abatement investment efficiency should be to rely on marginal abatement cost (MAC) curves in the developing countries where CDMs are implemented. As a matter of fact, detailed MACs are available only for few countries, thus forcing us to consider the only suitable information as the average abatement cost here given by the inverse of the investment efficiency index.
China 59.66 India 15.50 Korea, Rep 9.44 Brazil 7.03 Mexico, 1.57 Others 6.80 China India Korea, Rep Brazil Mexico Others
16
the distribution of projects, which continue to be in emerging economies rather than more cost-effective developing countries.
If cost effectiveness is the leading factor driving investment decisions, when a large concentration in few selected host countries leads to decreasing returns to scale, or in other words, investment efficiency as described by Column (3) in Table 1 is lower, then one might expect CDM project concentration to decrease.
Table 1 Table 1 Table 1
Table 1 –––– Efficiency IndicesEfficiency IndicesEfficiency IndicesEfficiency Indices
Host country Host country Host country Host country CDM CDM CDM CDM Investment Investment Investment Investment (Million US$) (Million US$) (Million US$) (Million US$) (1) (1) (1) (1) CERs (tons of CERs (tons of CERs (tons of CERs (tons of CO CO CO CO2) (2)) (2)) (2) ) (2) Investment Investment Investment Investment efficiency (ton efficiency (ton efficiency (ton efficiency (ton of CO of CO of CO
of CO2 per mln per mln per mln per mln US$) US$) US$) US$) (3)=(2)/(1) (3)=(2)/(1) (3)=(2)/(1) (3)=(2)/(1) Ranking Ranking Ranking Ranking (1) (1) (1)
(1) Ranking Ranking Ranking Ranking (2)(2) (2)(2) Ranking Ranking Ranking Ranking (3)(3)(3)(3)
China 122,587 522,980,763 4,266 1 1 6 India 35,844 135,888,099 3,791 2 2 8 Mexico 3,627 13,746,702 3,790 3 5 9 Brazil 2,616 61,661,852 23,574 4 4 2 Indonesia 2,236 3,515,680 1,572 5 10 14 Vietnam 2,093 6,743,234 3,222 6 9 10 Korea, Rep. 1,824 82,717,715 45,348 7 3 1 Colombia 1,575 1,655,795 1,051 8 13 17 Nigeria 1,190 312,364 262 9 19 19 Peru 1,136 1,688,437 1,486 10 12 15 Chile 1,067 8,530,588 7,995 11 7 5 Malaysia 889 2,133,604 2,399 12 11 11 Egypt 787 7,434,115 9,440 13 8 4 Morocco 766 330,099 431 14 18 18 Israel 738 1,226,454 1,663 15 15 13 Thailand 547 1,045,379 1,910 16 16 12 Argentina 427 8,896,259 20,839 17 6 3 Philippines 400 496,007 1,241 18 17 16
United Arab Emirates 382 91,746 240 19 20 20
Ecuador 335 1,279,792 3,822 20 14 7
Source: own elaboration on IGES (2012) and UNEP (2012).
If one looks at the main investors, it can be seen that exactly the opposite has occurred, because the concentration of final destination has increased over time for almost all countries considered. The largest investors (namely the United Kingdom, Switzerland, Japan, the Netherlands, Sweden, Germany, Spain, France), representing about 90% of total CDM projects, were selected over the whole period
2005-17
2011. A Herfindahl concentration index was computed for each investing country (Hit) in the form:
QRS = ∑ U∑\VWXVWXYZ[YZ[ Z]^ _ ` abc d (1) where i is the investor and CDMijt is the number of CDM projects made by country i in each j-th host
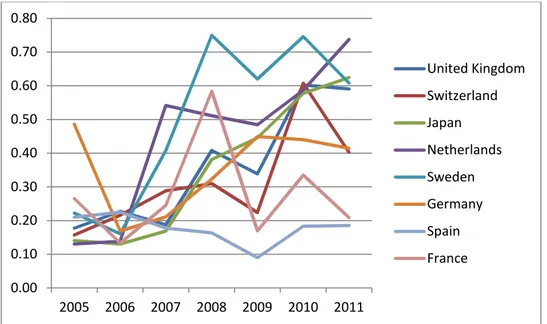
country for year t. The Herfindahl index ranges from 1/N to one, where N is the number of host countries. In order to compute a fully comparable index for the selected countries, this study considers the same host countries for all investors with a common N for all. Since as is common knowledge, values above 0.25 indicate a high concentration, it is quite clear from the trends shown in Figure 6 that the market was concentrated from the beginning of the analysed period as the Herfindahl index ranges from 0.15 to 0.50. More importantly, the concentration level has risen substantially for almost all large investors, with values ranging from 0.20 to 0.75.5
Figure 6 Figure 6 Figure 6
Figure 6 –––– Trend in Herfindahl concentration index of CDM projects for destination countries (eight main Trend in Herfindahl concentration index of CDM projects for destination countries (eight main Trend in Herfindahl concentration index of CDM projects for destination countries (eight main Trend in Herfindahl concentration index of CDM projects for destination countries (eight main investors, 2005
investors, 2005 investors, 2005
investors, 2005----2011)2011)2011)2011)
Source: own elaboration on UNFCCC (2012).
5 By looking at distinguished host countries for the four top investors (namely the United Kingdom, Switzerland,
Japan and the Netherlands), it is also worth noting that the largest concentration is given by increasing projects directed towards China, with a clear crowding out effect compared with projects directed towards all the other destinations (see Figure A1 in the Appendix).
0.00 0.10 0.20 0.30 0.40 0.50 0.60 0.70 0.80 2005 2006 2007 2008 2009 2010 2011 United Kingdom Switzerland Japan Netherlands Sweden Germany Spain France
By looking at Figure 7, United Kingdom is the country that has implemented most CDM followed by Switzerland, with a
other countries. Thus, there is quite a clear positive correlation implemented by investors and co
strong path dependency on inves cost effectiveness criterion. Sin Foreign Direct Investment decisio motivation for our principal resea
Although not all Annex I countries are invest
increasing over the years. This reflects the fact that during this period, CDM in mitigation actions has been growing.
environmental purpose (abatement targets compliance) do not seem to explain the implementation of CDM projects, as we can see by comparing the number of projects implemented by Annex I countries represented by figures on the t
by the grey line (Figure 7). Figure 7
Figure 7 Figure 7
Figure 7 ---- Comparison between the number of CDM projects implemented by Annex I countries and their Comparison between the number of CDM projects implemented by Annex I countries and their Comparison between the number of CDM projects implemented by Annex I countries and their Comparison between the number of CDM projects implemented by Annex I countries and their distance from Kyoto targets in terms of percentage of abatement
distance from Kyoto targets in terms of percentage of abatement distance from Kyoto targets in terms of percentage of abatement distance from Kyoto targets in terms of percentage of abatement
Source: Own elaboration on UNFCCC (2011, 2012).
18
Figure 7, United Kingdom is the country that has implemented most CDM very high number of projects compared wi
there is quite a clear positive correlation between concentration degree for final destination. This vestment decisions which is far from being full
nce common economic bilateral relationship decisions) are often strongly affected by path depe
arch question.
Although not all Annex I countries are investing in CDM, the number of projects
This reflects the fact that during this period, as previously argued, the role of CDM in mitigation actions has been growing. Nevertheless, the cost effectiveness objective
(abatement targets compliance) do not seem to explain the implementation of as we can see by comparing the number of projects implemented by Annex I countries
top of grey bars, and their distance from Kyoto targets
Comparison between the number of CDM projects implemented by Annex I countries and their Comparison between the number of CDM projects implemented by Annex I countries and their Comparison between the number of CDM projects implemented by Annex I countries and their Comparison between the number of CDM projects implemented by Annex I countries and their
distance from Kyoto targets in terms of percentage of abatement distance from Kyoto targets in terms of percentage of abatement distance from Kyoto targets in terms of percentage of abatement distance from Kyoto targets in terms of percentage of abatement
elaboration on UNFCCC (2011, 2012).
Figure 7, United Kingdom is the country that has implemented most CDM projects, ith those implemented by the number of projects This phenomenon reveals a ully explained by the sole ps (e.g., trade flows or endency, this confirms the ing in CDM, the number of projects implemented has been as previously argued, the role of Nevertheless, the cost effectiveness objective as well as the (abatement targets compliance) do not seem to explain the implementation of as we can see by comparing the number of projects implemented by Annex I countries
and their distance from Kyoto targets as represented Comparison between the number of CDM projects implemented by Annex I countries and their Comparison between the number of CDM projects implemented by Annex I countries and their Comparison between the number of CDM projects implemented by Annex I countries and their Comparison between the number of CDM projects implemented by Annex I countries and their
19
This distance was calculated in terms of the percentage of abatement, using 2009 data, the most recent emissions data available. Positive numbers indicate a greater distance from Kyoto targets and vice versa, as measured by the left hand side y-axis.
At a general level, it should be noted that there is no univocally determined correlation between the distance from Kyoto targets and the number of projects implemented: countries that are far from their objectives are also those that have implemented fewer projects (e.g., Australia, Canada, Luxembourg) and vice versa (e.g., France, Germany, Sweden, the United Kingdom). For example, the United Kingdom is the country that has implemented the greatest number of projects, even though it has reached its Kyoto target, whereas countries such as Australia and New Zealand have implemented very few projects, although they are very far from achieving their obligations. A first but unsatisfactory explanation could be given by the possibility that a country that has reached its Kyoto target may decide to invest in CDM in order to obtain CERs that afterwards could be sold to other developed countries that still have not reached their objectives. Nonetheless, all these descriptive facts provide a quite complex framework where several factors are behind the geographical concentration of CDM investment flows. This reinforces the motivation for our research question that CDM are influenced by factors other than pure cost minimisation and/or sustainable development criteria.
3. 3.3.
3. Econometric strategy and dataset descriptionEconometric strategy and dataset descriptionEconometric strategy and dataset description Econometric strategy and dataset description 3.1 Gravity model for bilateral relationships
Bilateral relationships among several countries in economic studies are often analysed by adopting an empirical model based on a gravity equation. Such a model is mostly used in trade analysis, but is also becoming widely used for other issues. One example is given by Picci (2010), where a gravity model is applied to patent data in order to investigate the degree of internationalisation of the inventive activity among European countries. Another example is specifically applied to CDM projects according to the modified gravity equation presented in Wang and Firestone (2010). This is the only example of gravity model applied to bilateral CDM relationships, where only a few elements are under scrutiny and further research is needed. According to a generalised gravity model of trade (Anderson, 1979; Bergstrand, 1985), the volume of trade between pairs of countries Yijis a function of their incomes, populations,
20
geographical distance, the existence of bilateral trade agreements or common languages, as follows: gRa = hRi^haijkRilkaimnRionaipqRairexp (sRa)tRa (2) where i stands for countries playing an active role in the investigated issue, called reporters in international economic terms, and j represents countries, also called partners.
In this specification, Xi and Xj indicate the role of economic size of trading partners, usually represented
by the GDP of the reporter and the partner, Pi and Pj are reporter and partner populations whereas Fi and
Fj represent all other specific reporter and partner features that may affect trade flows such as the quality
of institutions, infrastructures and technological capabilities. Zij represents any other factor aiding or
preventing trade between each pair of countries with a specific country-pair dimension. The most important bilateral driver included in Zij is represented by the geographical distance between the two
countries, measured in several ways. Another bilateral factor is given by the existence of past colonial relationships, a common language or the existence of a bilateral trade agreement. The basic idea is that trade relations are influenced by the economic size of the trading partner where the income and population dimensions are proxies of demand and supply of the importer and the exporter whereas geographical distance generally represents a proxy for transport and other transaction costs. Finally, αij
represents the specific effect associated with each bilateral trade flow as a control for all the omitted variables that are specific to each country-pair trade flow whereas uij is the error term.
According to the modified gravity model applied to CDM bilateral transactions developed by Wang and Firestone (2010), the log linearisation of eq. (2) results as:
wxyz{Ra = s|+ ~cwxzRa+ ~dwx•R + ~€wx•a+ ~•wxnR+ ~‚wxna+ ~ƒwxqRa+ „Ra (3) where the dependent variable CDMij represents the CDM permits purchased from credit country i in host
country j, Dij measures the geographical distance calculated by computing the great-circle distances
between credit and host countries’ capitals, Eiand Ejrepresent GHG emissions in investing and host
countries and Fi and Fj represent other structural features related to investing and host countries such as,
21
features according to the trade model related to the existence of common language and past colonial relationships.
3.2 The econometric model and dataset
According to the research hypothesis, the empirical model differs from Wang and Firestone (2010) in several ways. First of all, empirical estimations are based on a panel dataset where bilateral relationships are shaped over the period 2005-2011 when data on CDM projects are fully available from UNFCCC for each single year. This means that, unlike Wang and Firestone (2010), the dependent variable is not represented by 1st period CO2-equivalent emissions reductions (CERs) expected to be generated by the projects available for the whole period, but is represented by the number of projects implemented each year by investing countries in host countries. This methodological choice allows us to investigate the investment patterns in a temporal dimension as well. An important issue related to this aspect is given by the potential changes over time in CDM locations. It could be that one Annex I country, after having implemented several CDM projects in selected countries, faces increasing marginal abatement costs (MAC), especially if several CDM projects, also coming from other Annex I countries, are concentrated in those selected countries. This means that some changes in investment destinations may occur and only annual data allow this specific aspect to be investigated.
Second, within the country-pair features, the role of already existing commercial relationships is explicitly modelled by investigating the role of bilateral trade as a consolidated channel of international exchange that also facilitates CDM investment decisions. Third, the role of institutional quality is included in order to account for the well-known constraint faced by investors in CDM projects, where the capacity of managing such projects in host countries, as well as the existence of emissions inventory systems or well-established rules for international transactions, may influence investment behaviour.
In order to account for path dependency in bilateral relationships, some independent variables are modelled with one time lag, in order to have a clearer picture of how existing (path-dependent) bilateral relationships influence CDM final destination decisions. In order to do this, while CDM projects are shaped in the whole period 2005-2011, all the other regressors are provided for the period 2000-2011 in order to maintain all available observations for CDM while allowing independent variables to be lagged
22
appropriately. This modelling choice also allows us to reduce estimation biases deriving from potential endogeneity of some regressors. In particular, by strengthening bilateral relationships through CDM investments, one might expect a more favourable investment environment to be created that also facilitates bilateral commercial relationships. This specific point could constitute an interesting future research issue, but it is beyond the scope of this work.
The estimated empirical model is as follows:
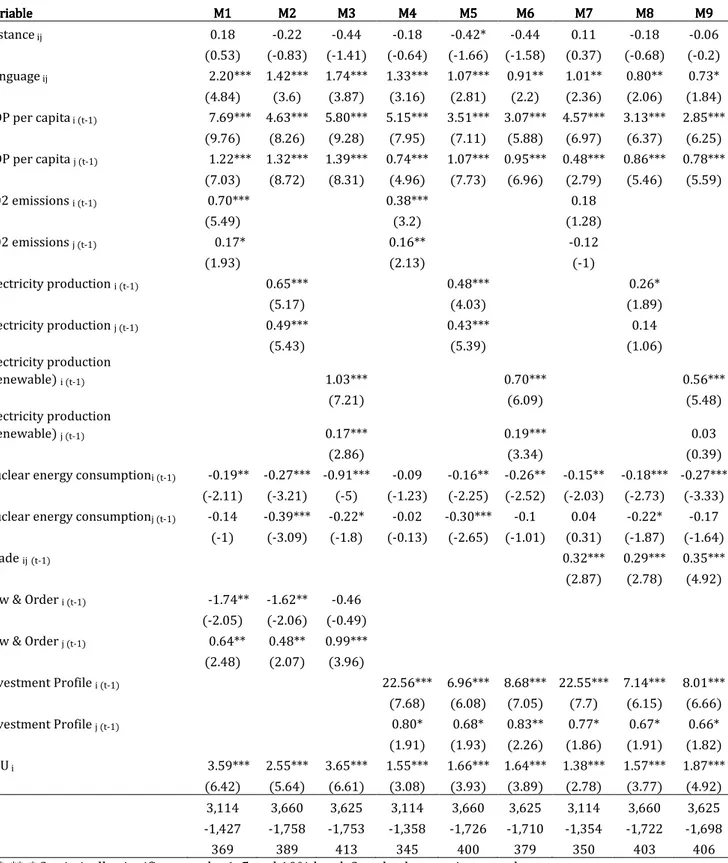
wxyz{Ra,S = sRa+ …R,S+ †a,S+ ~cwxzRa+~d‡ˆ‰xŠRa + ~€wx‹R,SŒ•+ ~•wx‹a,SŒ•+ ~‚wxŽRa,SŒ•+
~ƒwx•R,SŒ•+ +~•wx•a,SŒ•+ ~‘wx’R,SŒ•+ ~“wx’a,SŒ•+ ~c|‡•”R + „RaS (4) where p stands for the number of lags which are statistically robust. The criterion used to check for value of p is to minimise the number of lags. As a result, the empirical estimations presented in Section 4 are all derived by a temporal lag structure with p=1.
In this specification, the variable (lnD•–) represents the geographical distance between each pair of countries and is calculated as the great-circle formula taking distances from capitals and (‡ˆ‰xŠRa) is a dummy variable representing the existence of a common language for each country pair (Mayer and Zignago, 2006). According to a gravity-based trade theory, one might expect βc to be negative and βd to be positive since distances are commonly considered as a proxy of transport costs curbing transactions whereas the existence or not of a common language may facilitate international exchanges.6 Several remarks are in order. First, a set of explanatory variables representing the role of mass for i and j countries (wx‹R,SŒ• and wx‹a,SŒ•) is introduced here. Several measures of mass were tested because there are, as yet, no decisive empirical findings on this issue. One measure of mass is the economic size of reporters and partners modelled by using gross domestic product (GDP) per capita at purchasing power parity (PPP), available from the World Development Indicators (WDI) online database (World Bank, 2012).7 Second, as already stated, the number of projects and the investment dimension are strongly influenced by MACs. Here this issue is shaped by including country specific CO2 emissions level for i and j countries, as the sum of all GHG emissions expressed in CO2 equivalent terms provided by WDI. It is clear
6 The role of past colonial relationships is also controlled, but it is not a robust regressor.
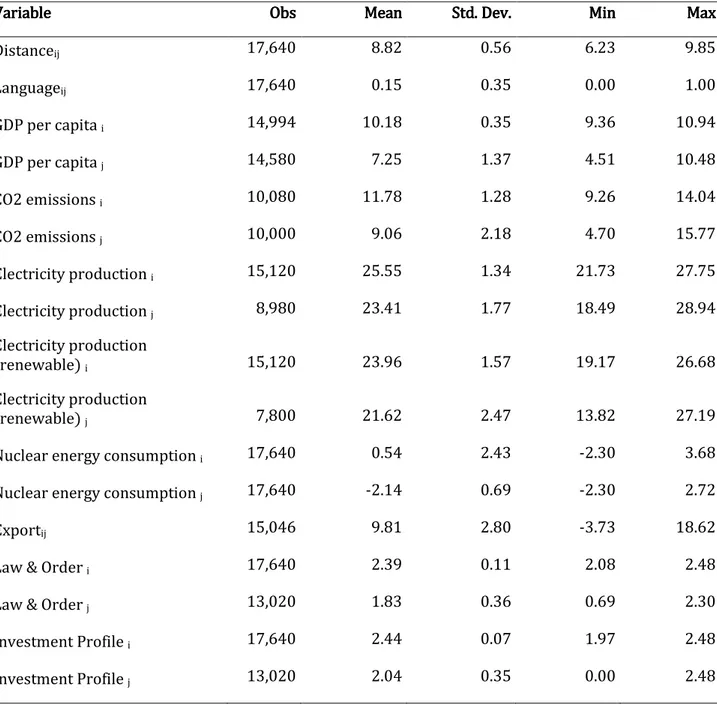
7 A complete description of all variables with acronyms, sources and main statistics is available in the Appendix,
23
that in this empirical framework, both β€ and β• are expected to assume positive values. With regard to the reporter’s emissions level, the higher the total emissions flow for each year, the harder the abatement efforts for respecting emission targets. This means that the propensity to invest in CDM projects for the purpose of reducing MACs should be higher. With regard to the host countries, the higher the level of total CO2 emissions, the wider the range of available abatement possibilities (i.e. the lower the MAC). Third, in order to gather information on the role of the energy system, the role of electricity production as well as the level of electricity produced by renewable sources was controlled for. Recalling the main findings of the trade-based gravity model, mass plays a role as a demand driver. This means that in both cases - by using GDP per capita or total electricity production - β€ and β• were expected to assume a positive sign. The larger the economic or energy system, ceteris paribus, the higher the demand for a wide range of abatement tools in order to be compliant with emission targets. With regard to electricity production by renewable sources, a theoretically based sign is only valid for the investing country. Bearing in mind that CERs may be banked and then sold into the carbon market, the gravity equation has been modelled in order to reply to the ancillary research question related to the hypothesis that the higher the domestic installed capacity of renewable electricity, the higher the potential to exploit such technologies by investing abroad. It may be that countries that are highly specialised in renewables coincide with the countries facing reduced constraints in terms of distance from achieving emission targets. Nonetheless, a large endowment of renewable energy sources also reveals a strong capacity to implement similar power plants abroad. As a matter of fact, even if one country is already compliant with emission targets thanks to its efforts to develop renewables domestically, it might find it convenient to invest in CDM projects that exploit renewable technologies in order to gain from accumulating CERs and selling them into the carbon market.
To answer the main research question, the role of bilateral trade relationships (lnT•–,˜Œ™) was tested, here modelled as bilateral export flows expressed in PPP terms from each investing country towards each host country with one temporal lag. To reduce potential variability in trade data dependent on pure computational issues, as a common choice in the trade literature for bilateral relationships, a two-year moving average value was computed. This means that for each country-pair the export value included in the analysis results as the average between the current value and that taken from the previous year.
24
In addition, because there have been several concerns in recent years regarding severe constraints given by a weak institutional setting of host countries, the quality of institutions of both investing and host countries was scrutinized, thus investigating the second ancillary research question. A weak institutional framework is widely recognised as a source of uncertainty for investment decisions in all economic issues (Rodrik et al., 2004). In CDM projects, the absence of a statistical office for the certification of emissions reductions in host countries, since in Non-Annex I countries emissions registry is not compulsory, and the low quality of rules for respecting legal aspects of contracts and agreements, have both been recognised as important concerns regarding when investment decisions should be taken. As a matter of fact, all CDM projects are complemented by a Memorandum of Understanding (MOU) where parties compile a formal statement in order to make sure that rules for certificating emission reductions and the commitment of investors to ensure sustainable development activities are respected. In a gravity model, both sides of each country-pair are included where the robustness of β• with a positive sign is a clear indication of the role played by institutional quality in acting as an attractor of investment decisions. On the contrary, no clear expectations at theoretical level should be given to the role of institutional quality in investing countries. On the one hand, countries with a higher level of institutional stability may be those with a stronger capacity to invest abroad since a domestic high institutional profile ensures a good overall investment environment for firms which are more robust and consequently more competitive on international markets. On the other, weak institutions may coincide with a scarce capacity to induce private firms to be compliant with domestic emissions reduction, thus increasing the necessity to invest in CDM in order to achieve a sufficient number of CERs required for fulfilling abatement targets.
Data for shaping institutional quality for i (wx•R,SŒ•) and j (wx•a,SŒ•) countries are taken from the Political Risk Services Index (PRI) provided by the PRS Group since it provides a homogeneous set of indices measuring various dimensions of political and socio-economic conditions for a large number of countries and a long time span. Within the 12 single indices provided by PRI, Law and Order (LO) and Investment Profile (IP) were selected. Law and Order is one of one of the most widely used institutional quality indices, and IP is the measurement most closely related to the object of the present analysis. As the maximum values of the two indices provided by the PRS Group are different (6 for LO and 12 for IP),
25
in order to conduct the analysis, these values were normalized to a common scale with 12 as the maximum value.
Finally, controls for two specific issues were included. The first consists in controlling for the role of electricity production from nuclear power plants for i (wx’R,SŒ•)) and j(wx’a,SŒ•)). As a matter of fact, when countries specialise in nuclear production, in order to comply with reduction targets, the most cost-effective way of reducing GHG emissions is to intensify nuclear energy production, which indirectly reduces the propensity to invest in CDM projects. It was expected that, for countries i and j, both β‘ and β“ would be negative, with a greater emphasis on investing countries. The second issue relates to the level of involvement in international climate change negotiations. According to the role played by different countries in COPs, it might be expected that European Union (EU) countries would show the largest propensity to invest in CDM projects in the analysed period because they form the bargaining bloc that is pushing for a post-Kyoto agreement with rather challenging abatement efforts. As a matter of fact, from the description provided in Section 2, clear EU predominant behaviour emerges in CDM distribution whereas some countries included in the so-called Umbrella Group (e.g., Australia and New Zealand) are lagging behind. Hence, it might be expected that these countries would both show a relative higher propensity to invest in CDM in order to reduce abatement costs and be first comers in this new market. For this reason, a dummy variable (‡•”R) was included, with a value of 1 assigned if the investing country was an EU member, and 0 otherwise.
Investing countries i are all countries included in Annex I list (∀› ∈ (1, {), •›žℎ { = 20) which have invested in one CDM project at least over the period 2005-2011 (i.e., Australia, Austria, Belgium, Canada, Denmark, Finland, France, Germany, Ireland, Italy, Japan, Luxembourg, the Netherlands, New Zealand, Norway, Portugal, Spain, Sweden, Switzerland, United Kingdom), while the host countries j (∀ ∈ (1, ’), •›žℎ ’ = 126) are all the potentially receiving countries as specified on the UNFCCC website, during the same period.8 The total number of potential observations in a panel setting is thus given by
8 The complete list of host countries is: Albania, Algeria, Angola, Antigua and Barbuda, Argentina, Armenia, Azerbaijan, The Bahamas, Bahrain, Bangladesh, Barbados, Belize, Benin, Bhutan, Bolivia, Bosnia and Herzegovina, Botswana, Brazil, Burkina Faso, Burundi, Cambodia, Cameroon, Cape Verde, Chad, Chile, China, Colombia, Comoros, Congo Dem. Rep., Costa Rica, Cote d'Ivoire, Cuba, Cyprus, Djibouti, Dominican Republic, Ecuador, Egypt, El Salvador, Equatorial Guinea, Eritrea, Ethiopia (excludes Eritrea), Fiji, Gabon, Gambia, Georgia, Ghana, Grenada, Guatemala, Guinea, Guinea-Bissau, Guyana, Haiti, Honduras, India, Indonesia, Iran Islamic Rep., Israel, Jamaica, Jordan, Kenya, Korea Dem. Rep., Korea Rep, Kuwait, Kyrgyz Republic, Lao PDR, Lebanon, Lesotho, Liberia, Libya,
26 ¢£¤. = {x’xŽ = 17,640.
As a matter of fact, since a panel estimation is carried out, in order to receive robust results, the dataset should be balanced, meaning that we need to set the same set of years and host countries for each investor even if there was no CDM project in that specific year or country. This leads to a dataset that is fully coherent with a theoretically-based gravity model (Anderson and van Wincoop, 2003) where the absence of a bilateral flow is also an input to be accounted for. In such a dataset, the presence of many zeros as well as the characteristic of being a discrete dependent variable may lead to statistical problems. Recent advancements in the econometric estimation of a gravity model provide useful suggestions in this regard. According to Santos-Silva and Tenreyro (2006), in order to solve potential sample selection problems, a maximum-likelihood (ML) estimator performs better than an OLS estimator. Conversely, following Helpman et al. (2008), a large part of the statistical bias produced by the existence of many zeros is not due to a sample selection problem but rather to neglecting the impact of firm heterogeneity in the decision on how much volume to export and the choice of the final destination market. In particular, a Heckman’s two-stage procedure is used to account for selection and heterogeneity biases in the case where some explanatory variables - related to the costs of establishing trade flows which affect firms’ decisions to export or not - are only included in the first stage equation (Wooldridge, 2010). This procedure is valid for continuous dependent variables and is theoretically derived specifically for trade data. In the present case, the discrete nature of the dependent variable allows us to rely on ML estimators rather than on a two-stage procedure. It is also worth mentioning that Helpman et al. (2008) specifically focused on the decision to trade by single firms whereas the framework of this analysis is rather different from a pure trade model. Since no information is available on the dimension of each single project (e.g., bilateral annual investments), ML is the best available option. In addition, our dependent variable has many zeros with large overdispersion. Econometric models specifically designed for this kind of variable are the Poisson Regression Model (PRM) and the Negative Binomial Regression Model (NBRM). Broadly Macedonia FYR, Madagascar, Malawi, Malaysia, Maldives, Mali, Malta, Mauritania, Mauritius, Mexico, Moldova, Mongolia, Morocco, Mozambique, Myanmar, Namibia, Nepal, Nicaragua, Niger, Nigeria, Oman, Pakistan, Panama, Papua New Guinea, Paraguay, Peru, Philippines, Qatar, Rwanda, Samoa, Saudi Arabia, Senegal, Sierra Leone, Singapore, Solomon Islands, South Africa, Sri Lanka, St. Lucia, Sudan, Suriname, Swaziland, Syrian Arab Republic, Tajikistan, Tanzania, Thailand, Togo, Trinidad and Tobago, Tunisia, Turkmenistan, Uganda, United Arab Emirates, Uruguay, Uzbekistan, Vietnam, Yemen, Zambia, Zimbabwe. It is worth mentioning that Montenegro and Serbia are excluded since all available data are provided for the two countries as an aggregate, and only Serbia shows one single CDM project over the whole period.
27
speaking, the PRM assumes that the dependent variable has a Poisson distribution, denoted by ¦~k¨›¤¤¨x(©), where © is the intensity parameter and the conditional mean is estimated from observed characteristics. In this way, the model extends the Poisson distribution by allowing each observation to have a different mean, referred to as incorporating observed heterogeneity. However, while the PRM is the natural starting point for the analysis of count data, it might be biased by an excess in zeros and an overdispersion problem. If the equidispersion assumption of the Poisson model, given by the equality of the conditional mean and the conditional variance, is violated, the model under-estimates the probability of a zero count and in general of low counts (Cameron and Trivedi, 1986).9
The additional dispersion can be accounted for in many ways. The NBRM addresses the failure of the PRM by introducing unobserved heterogeneity across the Poisson means. In the PRM model, the observation units are still Poisson distributed but there is a random variable, e.g. ª, that generates additional variability in the outcome, so that y~Poisson(μν). Given that our dependent variable is strongly overdispersed, a NBRM model is used to estimate eq. (4).10 The maximum likelihood method is used to estimate the model parameters.11
Finally, in order to account for unobservable country-pair specific heterogeneity (α•–), a fixed effects estimator was adopted by conditioning the probability of the counts for each group on the sum of the counts for the group.12 According to recent findings in gravity model estimations for a panel dataset, time variant fixed effects for reporters and partners should also be included (Baldwin and Taglioni, 2006).
9 Alternative methods are used for variables with excessive zeros (zero-inflated negative binomial regression,
Hurdle models, etc.). See Cameron and Trivedi (2009) for a more comprehensive discussion.
10 Mean and variance for the dependent variable are 0.15 and 7.96 respectively. The Likelihood-ratio test on the
overdispersion parameter is 4,511.5 with p-value 0.00, thus providing strong evidence of the overdispersion. Consequently, the NBRM is preferred to the PRM. See the Appendix for descriptive statistics of the dependent variable, and graphical representations of the observed and predicted probability assuming a Poisson and a negative binomial univariate distribution for the dependent variable (Figure A2).
11 The maximum likelihood negative binomial mean-dispersion estimator is not consistent if the variance
specification is incorrect. As an alternative estimation strategy the basic equation has been estimated with the PRM using the pseudo maximum likelihood approach. This approach only requires that the conditional mean function is correctly specified and allows consistent estimation of the coefficients also if the count variable is not Poisson distributed (Wooldridge, 1999). As a further robustness check, models have also been estimated with the generalised method of moments (GMM). The GMM estimator is of special interest when the model includes variables not strictly exogenous. In both cases results do not change substantially. Thus, in the following we just report those based on the NBRM, which in the absence of significant changes in the estimated coefficients remains the most efficient estimation method..
12 The Hausman test points out that the fixed effects estimator is more appropriate than the random effects
estimator. As a mere example, the Hausman test computed for model (3) in Table 2 assumes value 269.00 (with p-value 0.00), thus rejecting the null hypothesis that difference in coefficients is not systematic.
28
Hence, time-variant country effects for i and j were included, as expressed by …R,S and †a,S.13
4. 4. 4.
4. EmpiriEmpiriEmpirical resultsEmpirical resultscal resultscal results
In order to answer the research questions, the analysis is divided into two stages. In the first stage, we investigate the role played by the variables representing the economic and energy structure as drivers of the implementation of CDM projects. In the second stage, regressors representing the role of commercial bilateral relationships and the quality of institutions are introduced into the econometric model.
The results of the first part of the analysis are shown in Table 2. After analysing the role of GDP per capita and CO2 emissions separately (M1 and M2, respectively), additional estimations have been considered in which the economic aspect is analysed together with three alternative environmental variables: CO2-eq emissions, electricity production and electricity production from renewable sources (M3, M4 and M5, respectively). It is worth noting that all coefficients for these variables are positive and statistically robust for both investors and hosting countries. In particular, the effect associated with CO2 emissions reflects the results of previous studies, according to which the overall level of emissions can be considered a key driver for directing investments in CDM projects.14 According to the general empirical setting described in eq. (4), several lag structures have been tested in order to reduce potential endogeneity while obtaining robust results. The optimal lag structure appears to be p = 1, but the results remain quite robust and stable for lag values higher than 1.
An interesting point concerns the role played by renewable energies. As expected, the higher the installed capacity of renewable energy production, the higher the probability that one i-th Annex I country will be a large investor in CDM. Equally, the larger the renewables in host countries, the higher the propensity to absorb CDM projects.15
13It is worth mentioning that the original formulation of a NBRM model is given by an exponential function, while
statistical packages often automatically transform the equation in a log linear form, as exactly represented by eq. (4). In that case, coefficients for log transformed regressors are interpreted as elasticties, while coefficients related to variables in level (in this case all dummy variables) represent semi-elasticities.
14 Wang and Firestone (2010); Winkelman and Moore (2011).
15 Since potential multicollinearity bias may arise from considering economic and energy variables simultaneously,
correlation values between GDP per capita and alternatively CO2 emissions and all other energy-related variables are investigated. All correlation values are below 0.30. As a further robustness check, multicollinearity bias is also checked by computing Variance Inflation Factor (VIF) values for all covariates included in M3-M5 as well as condition numbers for the whole regressions. Values obtained for VIF for single variables are always below 5.00 and
29 Table 2
Table 2 Table 2
Table 2 –––– Testing for gravity model fitness to CDM investment decisionsTesting for gravity model fitness to CDM investment decisionsTesting for gravity model fitness to CDM investment decisions Testing for gravity model fitness to CDM investment decisions Variable Variable Variable Variable M1M1M1M1 M2M2 M2M2 M3 M3M3M3 M4M4 M4M4 M5M5M5M5 Distance ij -0.28 0.35* -0.17 -0.39 -0.48* (-1.11) (1.86) (-0.56) (-1.52) (-1.76) Language ij 0.96*** 0.3 2.18*** 1.43*** 1.18*** (2.67) (0.93) (4.95) (3.69) (2.77) GDP per capita i (t-1) 2.59*** 7.16*** 4.42*** 3.53*** (6.69) (9.95) (8.09) (6.1) GDP per capita j (t-1) 0.95*** 1.24*** 1.27*** 1.13*** (8.62) (7.8) (9.25) (8.61) CO2 emissions i (t-1) 0.09 0.69*** (1.08) (5.65) CO2 emissions j (t-1) 0.11** 0.26*** (2.08) (3.45) Electricity production i (t-1) 0.64*** (5.22) Electricity production j (t-1) 0.50*** (6.2)
Electricity production (renewable) i (t-1) 0.61***
(5.46)
Electricity production (renewable) j (t-1) 0.20***
(3.68) Nuclear energy consumption i (t-1) -0.06 -0.03 -0.15* -0.23*** -0.27**
(-1.04) (-0.58) (-1.76) (-2.96) (-2.47) Nuclear energy consumption j (t-1) 0.04 0.13 -0.19 -0.39*** -0.11
(0.42) (1.54) (-1.52) (-3.34) (-1.15) dEU i 0.67** -0.15 3.55*** 2.51*** 1.97*** (2.22) (-0.48) (6.67) (5.68) (4.61) N 5,019 3,330 3,330 3,880 3,839 ll -2,357 -1,607 -1,489 -1,823 -1,825 χ2 313 253 368 387 374
***, **, * Statistically significant at the 1, 5 and 10% level. Standard errors in parentheses.
Moreover, the two control variables (nuclear energy consumption and the EU dummy) are both significant in the last three regressions. With regard to the role of nuclear energy consumption, it is worth noting that the negative sign, as well as the fact that this variable is only robust for investing countries, reflects expectations and confirms the hypothesis that abating GHG emissions through nuclear production reduces the need to invest in CDM. With respect to the poor statistical robustness of host countries, in this case it is mainly explained by the fact that only very few j countries have nuclear production and consumption.
mean VIFs for the whole regressions are always below 2. For condition numbers, the condition of statistics below 50.00 is always respected.