1 © The Author 2014. Published by Oxford University Press on behalf of the European Orthodontic Society. All rights reserved.
For permissions, please email: [email protected]
Original article
Prediction of Class III treatment outcomes
through orthodontic data mining
Pietro Auconi
*
, Marco Scazzocchio
**
, Paola Cozza
***
,
James A. McNamara Jr
****
,
*****
and Lorenzo Franchi
******
*Private practice of Orthodontics, Rome, Italy, **Freelance Orthodontic Data Analyist, Rome, Italy, ***Department of Orthodontics, University of Rome Tor Vergata, Rome, Italy, ****Department of Orthodontics and Pediatric Dentistry, School of Dentistry, *****Center for Human Growth and Development, University of Michigan, Ann Arbor, USA, and ******Department of Surgery and Translational Medicine, Orthodontics, Università degli Studi di Firenze, Florence, Italy
Correspondence to: Lorenzo Franchi, Department of Surgery and Translational Medicine, Orthodontics, University of Flor-ence, Via del Ponte di Mezzo 46–48, 50127 FlorFlor-ence, Italy. E-mail: [email protected]
Summary
Objective: To determine whether it is possible to predict Class III treatment outcomes on the basis of a model derived from a combination of computational analyses derived from complexity science, such as fuzzy clustering repartition and network analysis.
Methods: Cephalometric data of 54 Class III patients (32 females, 22 males) taken before (T1, mean age 8.2 ± 1.6 years) and after (T2, mean age 14.6 ± 1.8 years) early rapid maxillary expansion and facemask therapy followed by fixed appliances were analysed. Patients were classified at T1 on the basis of high membership grade into three main dentoskeletal fuzzy cluster phenotypes: hyperdivergent (HD), hypermandibular (HM), and balanced (Bal) phenotypes. The prevalence rate of successful and unsuccessful cases at T2 was calculated for the three clusters and compared by means of Fisher’s exact test corrected for multiple testing (Holm–Bonferroni method).
Results: Unsuccessful cases were 9 out of 54 patients (16.7%). Once patients were framed into their cluster membership, the individualized pre-treatment prediction of unsuccessful cases was largely differentiated: HD and HM patients showed a significantly greater prevalence rate of unsuccessful cases than Bal patients (0% in Bal cluster, 28.6% in HM cluster, and 33.3% in HD cluster). Network analysis captured some noticeable interdependencies of Class III patients, showing a more connected interactive structure of cephalometric data sets in HM and HD patients compared with Bal patients. The results were confirmed after minimizing the geometrical connections between cephalometric variables in the model.
Conclusions: Fuzzy clustering repartition can be usefully used to estimate an individualized risk of unsuccessful treatment outcome in Class III patients.
Introduction
Our understanding of malocclusions and how best to treat them is hampered by the complexity of the craniofacial system in which they are manifested (1–3). Treatment outcomes for Class III malocclusion
patients are dependent on multiple factors including growth char-acteristics, facial morphology, environmental factors, direction and magnitude of corrective forces, treatment timing and duration, and patient’s compliance (4–6). While several studies (7–10) have been useful to understand Class III growth patterns, the different
European Journal of Orthodontics, 2014, 1–11 doi:10.1093/ejo/cju038
by Paola Cozza on September 9, 2014
http://ejo.oxfordjournals.org/
uncontrollable variables that can affect the co-morphologies of craniomaxillary and mandibular complexes in this dentoskeletal imbalance make statistical studies, as well as the individual growth trajectory, largely unachievable. Therefore, the prediction of treat-ment success or failure in a single patient based on few morphomet-ric determinants is problematic (11). Additional confounding factors in the prognosis of Class III malocclusion reside into the coexistence of various types of skeletal patterns and progression in the same patient: owing to different co-occurrence of characteristics, each child will exhibit his/her own particular phenotypic combination of unbalanced features (3).
Facial growth and development is a strictly controlled biological process, in which atypical growth begins when the biological bal-ance is disturbed. Recently, researchers have developed the ability of addressing to a more holistic diagnostic perspective inspired by com-plexity science, by developing models made up of interacting crani-ofacial components (3,6,12–15). Class III cranicrani-ofacial pattern can be considered as a complex biological nonlinear system, a collection of components whose actions are interconnected so that one compo-nent’s action changes the context for other components (12-15). In complex biological systems (e.g. the brain, the immune system, the cell, and the ecosystems), the richness of interactions makes that the whole system is greater than the sum of its parts, due to cooperation phenomena between structures, connectivity, and mutual empower-ment. These systems must be analysed in their entirety as a coherent unit: it is the pattern that matters, not the identity of the components (15). Macroscopic collective behaviours, such as ‘emergent order’, ‘self organization’, and ‘criticality’, originate from a network of local phenomena such as evolutionary preferential attachment (16), con-vergence toward attractors (17), competitive or cooperative behav-iours, and others (18,19).
Each orthodontic patient exhibits the convergence of disparate clinical and radiological features pertaining to Class I, II, and III malocclusions. Therefore, a possible approach to a growing patient with a malocclusion refers to a probabilistic many-valued logic
called fuzzy logic (20). Fuzzy clustering analysis allows the assign-ment and quantification of the individual membership grade to a specific cluster (for instance, the predominant Class III malocclusion features) and also the identification of a minor membership grade to other clusters (for instance, minor Class I malocclusion features in the same patient) (3).
Recently, fuzzy clustering approach has been able to correctly define the individual evolutionary craniofacial pattern (‘growth strategy’) and the linearity/randomness of the craniofacial trajectory during the Class III growth process (3).
Recent advancements in complexity science have made available further computational tools of analysis of large data sets in problems involving multiple interacting agents, reducing a biological and/or medical system in a simplified representation that captures the struc-ture of co-occurrences between components, allowing the huge quan-tity of factors to be examined simultaneously. Such patterns of local and global interconnection are called networks (16,17). The network’s inference allows to derive information on the identity and the state of the elements of a system, their functional relationships, and it extracts biological insight and prediction in complex biological processes.
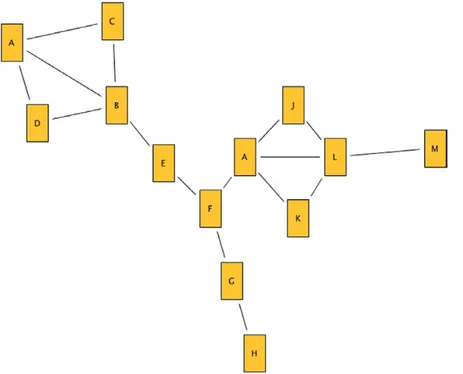
Through networks, the growing craniofacial system can be mod-elled as an aggregate structure of a variety of agents in which the clinical (radiographic, functional, etc.) characteristics can be trans-formed into nodes, and the relationships between these nodes are referred to as links (19). Each component of the network can be regarded as a processing unit of information. In the simple network shown in Figure 1, at first glance, some nodes appear to have more links with other nodes (B, I, and L). A more accurate analysis reveals that a very critical role is played by node F, which is a crucial inter-mediary node. Most of the information circulating in the system must flow from this node. If node F is removed, the network is dis-assembled into three groups of nodes that are no longer connected. Thus, node F plays a control role (intermediation, or ‘betweenness’) among the other network nodes, though it does not have a high cen-trality score (number of links of the node or ‘degree’).
Figure 1. A simple Network.
by Paola Cozza on September 9, 2014
http://ejo.oxfordjournals.org/
Transferring the network approach to orthodontics (in network analysis each node represents a cephalometric parameter, and the value of the link is the strength of the correlation between the nodes) can enable the identification of some general rules governing the pro-gression of the craniofacial system (3,21).
As these analyses have been able to deepen the relevance of crani-ofacial components in influencing the growth process (3,20), and as the poor treatment response to Class III malocclusion often reflects a condition that includes a growth disorder, the aim of this study was to determine whether it would be possible to predict the treatment outcomes in a group of 54 Class III growing patients on the basis of a model derived from fuzzy clustering repartition. Furthermore, the capability of the network analysis to identify sites of dentoskeletal imbalance and self-corrective combinations during treatment was analysed.
Subjects and methods
Subjects
The first step of the current investigation was to collect cephalo-metric data on a large cross-sectional sample of untreated Class III subjects (both males and females) in order to identify Class III phe-notypic groups at different chronologic ages by using fuzzy cluster analysis. This analysis was described already in a previous study (3) in which it was used to evaluate craniofacial growth in a sample of untreated Class III female subjects.
Pre-treatment lateral cephalometric records of 514 (241 males and 273 females) Class III Caucasian patients (including 54 treated patients), collected from the Department of Orthodontics of the University of Florence, Italy, and from the Graduate Orthodontic Program at the University of Michigan, Ann Arbor, Michigan were analysed. All subjects were enrolled previously in large descriptive estimates of craniofacial growth in Class III malocclusion (7,9) and in two clinical studies (22,23). The age ranged from 7 years and 1 month to 10 years and 11 months.
To be included in this study, the subjects had to satisfy all of the following criteria:
1. Caucasian ancestry;
2. no orthopedic/orthodontic treatment prior to cephalogram; 3 diagnosis of Class III malocclusion based on anterior crossbite,
accentuated mesial step relationships of the primary second molars, permanent first molar relationship of at least one-half cusp Class III, a negative Wits appraisal (<−2 mm), and ANB angle less than 0;
4. no congenitally missing or extracted teeth; and 5. no craniofacial syndromes.
Cephalometric analysis
The 514 subjects were examined separately in four age groups at 7 years (100 subjects, 35 males and 65 females), 8 years (168 sub-jects, 80 males and 88 females), 9 years (146 subsub-jects, 74 males and 72 females), and 10 years (100 subjects, 52 males and 48 females) of age.
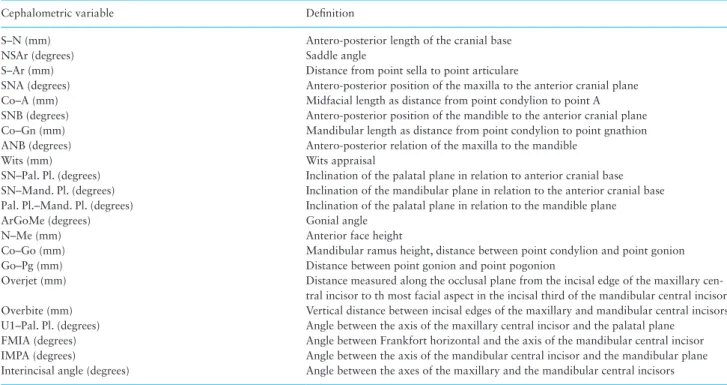
A cephalometric analysis comprising 22 variables (10 linear and 12 angular; Table 1) was performed. The data contained in each cephalogram were entered into cephalometric software (Dentofacial Planner Plus™, Version 2.5, Toronto, Ontario, Canada). A standard-ized enlargement factor (8%) was applied to all linear cephalometric measurements. The error of the method for the cephalometric meas-urements was evaluated by repeating the measures in 30 randomly selected cephalograms (Dahlberg’s formula). Error was on average 0.8 degree for angular measures and 0.9 mm for linear measures.
Fuzzy clustering
Clustering is the process of partitioning a finite collection of n ele-ments into class or clusters so that items in the same class are as similar as possible through minimization of intracluster variance. In ‘hard’ clustering, data are divided into distinct clusters, where each data element belongs to exactly one cluster; in ‘fuzzy’ clustering, Table 1. Cephalometric variables
Cephalometric variable Definition
S–N (mm) Antero-posterior length of the cranial base
NSAr (degrees) Saddle angle
S–Ar (mm) Distance from point sella to point articulare
SNA (degrees) Antero-posterior position of the maxilla to the anterior cranial plane Co–A (mm) Midfacial length as distance from point condylion to point A SNB (degrees) Antero-posterior position of the mandible to the anterior cranial plane Co–Gn (mm) Mandibular length as distance from point condylion to point gnathion ANB (degrees) Antero-posterior relation of the maxilla to the mandible
Wits (mm) Wits appraisal
SN–Pal. Pl. (degrees) Inclination of the palatal plane in relation to anterior cranial base SN–Mand. Pl. (degrees) Inclination of the mandibular plane in relation to the anterior cranial base Pal. Pl.–Mand. Pl. (degrees) Inclination of the palatal plane in relation to the mandible plane
ArGoMe (degrees) Gonial angle
N–Me (mm) Anterior face height
Co–Go (mm) Mandibular ramus height, distance between point condylion and point gonion Go–Pg (mm) Distance between point gonion and point pogonion
Overjet (mm) Distance measured along the occlusal plane from the incisal edge of the maxillary cen-tral incisor to th most facial aspect in the incisal third of the mandibular cencen-tral incisor Overbite (mm) Vertical distance between incisal edges of the maxillary and mandibular central incisors U1–Pal. Pl. (degrees) Angle between the axis of the maxillary central incisor and the palatal plane
FMIA (degrees) Angle between Frankfort horizontal and the axis of the mandibular central incisor IMPA (degrees) Angle between the axis of the mandibular central incisor and the mandibular plane Interincisal angle (degrees) Angle between the axes of the maxillary and the mandibular central incisors
by Paola Cozza on September 9, 2014
http://ejo.oxfordjournals.org/
analysis elements can belong to more than one cluster. Fuzzy cluster analysis is able to divide the subjects into classes and allows the indi-vidual membership grade to be assigned to a specific main charac-teristic (‘winner cluster’) and also to identify the minor membership grade with the other characteristics (20). A subject belonging, for example, to a cluster of hyperdivergence can share some character-istics with a subject belonging to a cluster of mandibular progna-thism. Fuzzy clustering algorithms measure the degree of belonging for each orthodontic feature vector in a cluster. Each feature vector may be assigned to multiple clusters with some degree of sharing, as measured by the membership function, to make more informed decisions about the timing and type of orthodontic interventions (3).
The output of fuzzy cluster analysis gives values representing the membership grade to individual cluster. These membership lev-els indicate the strength of the association between data elements and a particular cluster (20,24). The analysis was performed on the Class III cross-sectional sample by using the KNIME software (KNIME Desktop version 2.7.4 available at http://www.knime.org). After having subjected combinations of three to six variables to clus-ter analysis, the following five parameclus-ters provided the best pheno-typic grouping of patients: Co–A, Co–Gn, gonial angle (ArGoMe), palatal plane to mandibular plane, and overjet. The fuzzy algorithm converts the input value (‘crisp inputs’, i.e. the 22 cephalometric var-iables) in a fuzzy membership function. All subsequent applications of the fuzzy inference is not supervised by the operator. The output is determined by the KNIME software on the basis of the maximum ‘degree of truth’ in asserting the membership grade of the subjects to the clusters (20).
In fuzzy clustering, every point has a degree of belonging to clus-ters, as in fuzzy logic, rather than belonging completely to just one cluster. Thus, points on the edge of a cluster may be in the cluster to a lesser degree than points in the center of cluster. Any point x has a set of coefficients giving the degree of being in the kth cluster
wk(x). With fuzzy c-means, the centroid of a cluster is the mean of all
points, weighted by their degree of belonging to the cluster:
c
w x
x
w x
k k x m k m x=
( )
( )
∑
∑
The degree of belonging, wk(x), is related inversely to the distance
from x to the cluster center as calculated on the previous pass. It also depends on a parameter m that controls how much weight is given to the closest center.
Fuzzy cluster analysis defined three clinical clusters: subjects with increased mandibular dimensions [hypermandibular (HM) cluster], subjects with increased maxillomandibular divergence [hyperdiver-gent (HD) cluster], and subjects with intermediate characteristics between the first two (balanced or Bal cluster).
Fuzzy cluster membership was then evaluated in a subsample of 54 Class III patients (22 males and 32 females) treated consecutively with Rapid Maxillary Expansion and Facial Mask (RME/FM) ther-apy followed by comprehensive preadjusted edgewise therther-apy. This treated sample was collected from the Department of Orthodontics of the University of Florence, of the University of Rome Tor Vergata, and from the Graduate Orthodontic Program at the University of Michigan. All patients previously were enrolled in clinical studies (22,23).
Inclusion criteria for the treated sample were the same as those used for the cross-sectional untreated sample. For each patient of the treated group, fuzzy cluster membership was calculated before
therapy (T1, mean age 8.2 ± 1.6 years) when the pre-treatment lateral cephalogram was taken (treated group: 7 years, 13 subjects, 4 males and 9 females; 8 years, 13 subjects, 3 males and 10 females; 9 years, 15 subjects, 8 males and 7 females; 10 years, 13 subjects, 7 males and 6 females). All 54 patients were re-evaluated with a lateral cephalo-gram at the end of the second phase treatment with fixed appliances (T2, mean age 14.6 ± 1.8 years). Details about the Class III treat-ment protocols used in this sample have been described previously (22, 23). On the lateral cephalograms at T2, an evaluation of suc-cessful or unsucsuc-cessful outcome was carried out. Unsucsuc-cessful treat-ment was defined as the concurrent presence of Class III permanent molar relationship and negative overjet, as reported previously (25). The majority of the subjects showed a prepubertal stage of skeletal development (Cervical Stage, CS 3), with only 2% showing a post-pubertal stage of skeletal development (CS 4) (26). Male and female patients were pooled according to the results of Baccetti et al. (25), and Kim et al. (27). In these studies, no significant gender differences were identified either during early Class III growth processes (28) or in treatment response (25). In the sample analysed in the current study, no gender differences were found in fuzzy clustering reparti-tion (data available on request from the authors).
Network analysis and module detection
In order to extrapolate the information present in the whole tion matrix and sort out relevant features, a cut-off to the correla-tion values was used to consider only the most significant relacorrela-tions (16). The choice of filtering the correlation values at |rxy| > 0.60 reduced the complexity of the system and permitted the identifica-tion of many characteristics simply by visual inspecidentifica-tion. Network analysis can deepen the entanglement of the elementary components (‘nodes’ or ‘vertices’) or interactions (‘links’ or ‘arches’) of a system (Cytoscape 3.0, available at www.cytoscape.org) (17). In network analysis, a source of mistake could be related to the choice of filter-ing the correlation values at |rxy| > 0.60. Possibly, this decision could remove some biologically meaningful correlations. Furthermore, when two variables have reference points in common, they will be correlated, even though all the reference points vary independently (29). As such, the correlations between cephalometric measurements can be misleading, being potentially due to topographical (geomet-ric) rather than biological factors. In order to circumvent the pos-sible invalid networks, we performed a subsequent network analysis after deleting common topological cephalometric landmarks and reducing the filtering of correlation values at |rxy| > 10. Moreover, to further deepen the biological meaning of cephalometric correlations, we analysed two topological network indexes, the ‘betwenness’ and ‘stress’ metrics. Betweenness is a node centrality index. In biologi-cal terms, betweenness indicates the relevance of a characteristic as functionally capable of holding together binding characteristics. The betweenness of a node reflects the amount of control that this node exerts over the interactions of other nodes that lie inside a network. The stress of a node in a biological network can indicate the cru-cial role to maintain the coherence of the system. In a biological system, stress indicates the nodes heavily involved in growth and/ or biomechanical communications between components (13,16). Betweenness and stress metrics can be calculated using Cytoscape 3.0 (www.cytoscape.org).
‘Modularity’ refers to the relative degrees of connectivity in sys-tems. A ‘module’, or a ‘community’, is a unit whose components are tightly integrated internally but relatively independent from other modules (15). Variables within modules are highly mutually corre-lated: these interactions between parts generate covariation among
by Paola Cozza on September 9, 2014
http://ejo.oxfordjournals.org/
morphological traits. Positive correlations between quantitative traits suggest that they will simultaneously increase (or decrease) in size and shape (15,17). The modules can be obtained using the R function ‘walktrap.community {igraph}’.
Statistical analysis
Descriptive statistics (mean, standard deviation, minimum, and maximum) was calculated for each cephalometric variable in the four age groups for both the cross-sectional sample and the treated group at T1. Individual winner cluster membership was computed for both the cross-sectional sample and the treated sample in the four age groups. The prevalence rate of successful and unsuccessful cases were calculated for the three clusters (Bal, HM, and HD) and compared by means of Fisher’s exact test corrected for multiple test-ing (Holm–Bonferroni method).
Results
Descriptive statistics and statistical comparison (independent sample t tests) between a cohort of 73 untreated Class III 8-year-old female subjects (derived from Auconi et al. (3)) and 155 untreated 8-year-old Class III male and female subjects (derived from the untreated sample analysed in the current study). No significant differences were found for any of the cephalometric variables between the two groups when divided into Balanced, Hyperdivergent, and Hypermandibular clusters (Supplementary Table 1).
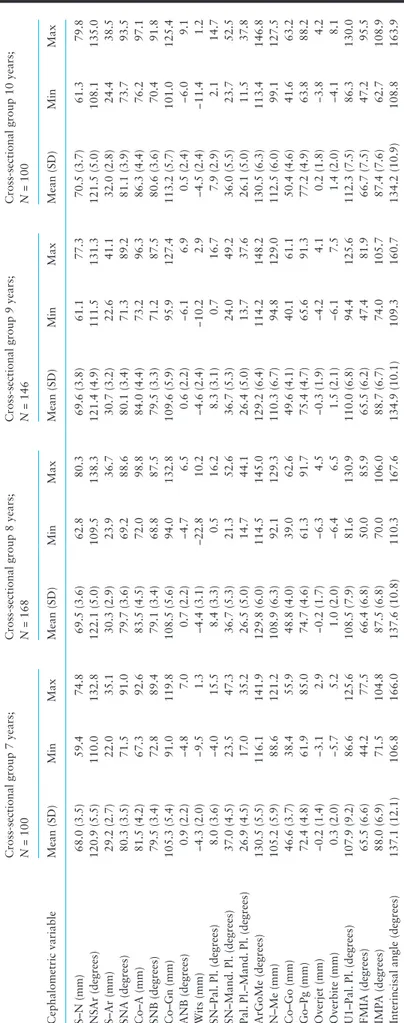
Descriptive statistics for each cephalometric variable in the four age groups for both the cross-sectional sample and the treated group at T1 are reported in Tables 2 and 3, respectively. Individual win-ner cluster membership for both the cross-sectional sample and the treated sample at T1 in the four age groups is reported in Table 4. It is interesting to note that the Class III growth process involves a pro-gressive shift from a higher prevalence of Bal to a higher prevalence of HM subjects (Table 4). Table 5 summarizes the results of early RME/ FM treatment obtained in a cohort of 54 Class III patients. At the end of treatment, unsuccessful results were observed in 9 out of 54 patients (16.7%). Once the patients were placed into the correct win-ner cluster membership, unsuccessful treatment outcome for Bal, HM, and HD patients was highly differentiated: 0% for Bal patients (0 out of 25 patients), 28.6% for HM patients (4 out of 14 patients), and 33.3% for HD patients (5 out of 15 patients), respectively. The preva-lence rate of unsuccessful Class III patients in both the HD and HM groups were significantly greater than in the Bal group. Supplementary Table 2 summarizes the method’s classification power in terms of sen-sitivity, specificity, and positive and negative predictive power.
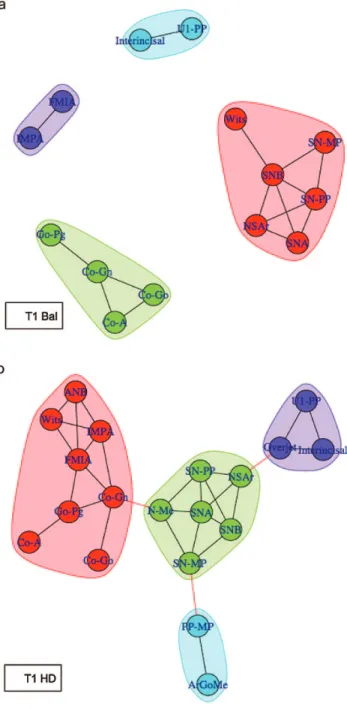
In the attempt to deepen the reason for the marked difference of the treatment effect in Bal, HD, and HM patients, we used tools from statistical physics to develop a theoretical framework for char-acterizing the structure of dentoskeletal interactions between the 54 patients. Network analysis (module repartition) of Bal, HD, and HM treated patients at T1 is reported in Figure 2. In Figure 2A, module repartition of Bal patients exhibits a balanced subdivision between cephalometric characteristics. The Bal network is completely divided into four modules, without links between such modules. The high covariance of cephalometric characteristics within each module conveys morphological integration between skeletal (top left) and dentoalveolar (bottom) characteristics. Figure 2B and 2C report the module repartition of cephalometric variables of HD and HM patients, respectively. Network topology of HD and HM patients shows a highly interlinked cohesive module structure between ceph-alometric characteristics.
Figure 3A reports the network topology of 20 HM and HD successfully treated patients, while Figure 3B reports the network topology of 9 HM and HD unsuccessfully treated patients. The dis-tances among the circles have the same magnification. The topology of modules is highly differentiated: the unsuccessful patients exhibit a more interlinked structure (i.e. more numerous and stronger cor-relations between circles) than the successful patients. In the unsuc-cessful group, there are several nodes with a high number of links (high ‘degree’): Co–A, Co–Gn, Go–Pg (nine links each); ArGoMe, and SNB (eight links each); Co–Go (seven links); etc.
Inferring network models from orthodontic data allows to understand the most influential morphological correlations that lead to dentofacial deformities. However, according to Halazonetis (29), the correlations between cephalometric characteristics may be at least in part misleading, as potentially related to topographical (i.e. geometrical) rather than biological factors. With the aim of extract-ing more consistent biological meanextract-ing from the topology of cepha-lometric correlations, we performed an additional network analysis of cephalometric data on 9 unsuccessful and 20 successful Class III patients based on seven topologically distant vertices that did not share geometric relationships (Supplementary Figure 1A and 1B). Compared with unsuccessful patients, successful patients exhibited different correlation coefficients between skeletal and dentoalveolar compensatory components (see, for example, the correlation coef-ficients between variables Go–Pg and IMPA in successful and in unsuccessful patients).
In Supplementary Table 3, the betweenness and stress scores observed in 20 successful and 9 unsuccessful Class III patients, related to IMPA, ArGoMe, overjet, and SN, were reported. In a bio-logical system, these network metrics reflect the amount of control that a node exerts over the interactions of other nodes of the sys-tem. The nodes pertaining to unsuccessful patients exhibited higher betweenness and stress scores than those observed in successful patients.
Discussion
Class III malocclusion can exist with any combination of skeletal and dental components and with any number of morphospatial dis-harmony and aberration of the craniofacial complex (30). As ortho-dontists, we know that our therapeutic decisions on patients with Class III malocclusion are based on assumptions concerning future growth that may or may not be correct. The emergence of a maloc-clusion during the growth process behaves as a complex nonlinear system involving a great number of variables and systems of vari-ables (2,4). Ultimately, changes of the general state of a biological system can be linked to the organizational level, i.e. to the specific mechanisms of reaction and to latent, often undervalued, ties pre-sent inside it. The growth of craniofacial system is never formalized into well-defined, closed categories, separated from each other. It is not easy to accept the idea that craniofacial development is shaped by forces that we do not understand or do not control. We have to deal with multiple or fragmented truths. Fuzzy Logic allows to deal with the dimensions of complementarity, vagueness, and uncertainty, which characterize many diagnosis and therapeutic decisions. There are two factors that can determine the variability of Class III treat-ment outcome: the type of growth that will occur in the future, and the possibility that treatment can influence the type of growth.
As RME/FM therapy has a limited influence on facial skeletal com-ponents, it is important to clarify in advance the pattern of interactions between growing craniofacial components that can be used to predict
by Paola Cozza on September 9, 2014
http://ejo.oxfordjournals.org/
Table 2.
Descripti
ve statistics for the cephalometric variables in the cross-sectional Class III group
Cephalometric variable
Cross-sectional group 7 years; N = 100 Cross-sectional group 8 years; N = 168 Cross-sectional group 9 years; N = 146 Cross-sectional group 10 years; N = 100
Mean (SD) Min Max Mean (SD) Min Max Mean (SD) Min Max Mean (SD) Min Max S–N (mm) 68.0 (3.5) 59.4 74.8 69.5 (3.6) 62.8 80.3 69.6 (3.8) 61.1 77.3 70.5 (3.7) 61.3 79.8 NS Ar (degrees) 120.9 (5.5) 110.0 132.8 122.1 (5.0) 109.5 138.3 121.4 (4.9) 111.5 131.3 121.5 (5.0) 108.1 135.0 S–Ar (mm) 29.2 (2.7) 22.0 35.1 30.3 (2.9) 23.9 36.7 30.7 (3.2) 22.6 41.1 32.0 (2.8) 24.4 38.5 SNA (degrees) 80.3 (3.5) 71.5 91.0 79.7 (3.6) 69.2 88.6 80.1 (3.4) 71.3 89.2 81.1 (3.9) 73.7 93.5 Co–A (mm) 81.5 (4.2) 67.3 92.6 83.5 (4.5) 72.0 98.8 84.0 (4.4) 73.2 96.3 86.3 (4.4) 76.2 97.1 SNB (degrees) 79.5 (3.4) 72.8 89.4 79.1 (3.4) 68.8 87.5 79.5 (3.3) 71.2 87.5 80.6 (3.6) 70.4 91.8 Co–Gn (mm) 105.3 (5.4) 91.0 119.8 108.5 (5.6) 94.0 132.8 109.6 (5.9) 95.9 127.4 113.2 (5.7) 101.0 125.4 ANB (degrees) 0.9 (2.2) −4.8 7.0 0.7 (2.2) −4.7 6.5 0.6 (2.2) −6.1 6.9 0.5 (2.4) −6.0 9.1 W its (mm) −4.3 (2.0) −9.5 1.3 −4.4 (3.1) −22.8 10.2 −4.6 (2.4) −10.2 2.9 −4.5 (2.4) −11.4 1.2 SN–Pal. Pl. (degrees) 8.0 (3.6) −4.0 15.5 8.4 (3.3) 0.5 16.2 8.3 (3.1) 0.7 16.7 7.9 (2.9) 2.1 14.7 SN–Mand. Pl. (degrees) 37.0 (4.5) 23.5 47.3 36.7 (5.3) 21.3 52.6 36.7 (5.3) 24.0 49.2 36.0 (5.5) 23.7 52.5 Pal. Pl.–Mand. Pl. (degrees) 26.9 (4.5) 17.0 35.2 26.5 (5.0) 14.7 44.1 26.4 (5.0) 13.7 37.6 26.1 (5.0) 11.5 37.8 ArGoMe (degrees) 130.5 (5.5) 116.1 141.9 129.8 (6.0) 114.5 145.0 129.2 (6.4) 114.2 148.2 130.5 (6.3) 113.4 146.8 N–Me (mm) 105.2 (5.9) 88.6 121.2 108.9 (6.3) 92.1 129.3 110.3 (6.7) 94.8 129.0 112.5 (6.0) 99.1 127.5 Co–Go (mm) 46.6 (3.7) 38.4 55.9 48.8 (4.0) 39.0 62.6 49.6 (4.1) 40.1 61.1 50.4 (4.6) 41.6 63.2 Go–Pg (mm) 72.4 (4.8) 61.9 85.0 74.7 (4.6) 61.3 91.7 75.4 (4.7) 65.6 91.3 77.2 (4.9) 63.8 88.2 Overjet (mm) −0.2 (1.4) −3.1 2.9 −0.2 (1.7) −6.3 4.5 −0.3 (1.9) −4.2 4.1 0.2 (1.8) −3.8 4.2 Overbite (mm) 0.3 (2.0) −5.7 5.2 1.0 (2.0) −6.4 6.5 1.5 (2.1) −6.1 7.5 1.4 (2.0) −4.1 8.1 U1–Pal. Pl. (degrees) 107.9 (9.2) 86.6 125.6 108.5 (7.9) 81.6 130.9 110.0 (6.8) 94.4 125.6 112.3 (7.5) 86.3 130.0 FMIA (degrees) 65.5 (6.6) 44.2 77.5 66.4 (6.8) 50.0 85.9 65.5 (6.2) 47.4 81.9 66.7 (7.5) 47.2 95.5 IMP A (degrees) 88.0 (6.9) 71.5 104.8 87.5 (6.8) 70.0 106.0 88.7 (6.7) 74.0 105.7 87.4 (7.6) 62.7 108.9
Interincisal angle (degrees)
137.1 (12.1) 106.8 166.0 137.6 (10.8) 110.3 167.6 134.9 (10.1) 109.3 160.7 134.2 (10.9) 108.8 163.9
by Paola Cozza on September 9, 2014
http://ejo.oxfordjournals.org/
Table 3.
Descripti
ve statistics for the cephalometric variables in the treated group at
T1
Cephalometric variable
T
reated group 7 years;
N
= 13
T
reated group 8 years;
N
= 13
T
reated group 9 years;
N
= 15
T
reated group 10 years;
N = 13 Mean (SD) Min Max Mean (SD) Min Max Mean (SD) Min Max Mean (SD) Min Max S–N (mm) 67.1 (1.5) 64.2 68.9 68.1 (3.4) 64.2 74.9 68.7 (3.7) 63.4 74.5 69.8 (3.5) 63.8 75.5 NS Ar (degrees) 121.9 (5.8) 112.3 131.4 121.8 (7.2) 107.4 132.2 122.9 (7.5) 109.5 137.8 123.5 (5.2) 114.6 132.7 S–Ar (mm) 29.0 (2.3) 25.3 32.6 29.5 (3.3) 23.2 33.6 30.5 (2.7) 25.9 34.9 31.6 (2.3) 27.6 35.6 SNA (degrees) 79.7 (4.0) 72.9 88.0 79.7 (5.0) 74.5 93.1 80.4 (3.7) 71.7 85.3 79.7 (4.9) 68.2 87.8 Co–A (mm) 79.5 (3.2) 73.9 83.8 81.9 (4.0) 75.2 88.1 82.4 (3.9) 75.7 89.9 83.8 (5.3) 75.4 95.8 SNB (degrees) 79.3 (4.0) 73.3 85.6 78.9 (4.8) 71.1 90.5 79.6 (3.5) 72.7 86.9 80.4 (4.5) 69.5 86.8 Co–Gn (mm) 103.7 (4.5) 96.9 112.4 107.7 (5.2) 98.5 116.4 109.7 (6.7) 100.9 123.7 113.1 (8.2) 100.1 130.9 ANB (degrees) 0.5 (1.3) −2.7 2.4 0.8 (2.1) −2.5 4.3 0.8 (1.8) −2.6 3.0 −0.7 (1.9) −3.6 2.5 W its (mm) −4.7 (2.2) −8.3 −1.7 −4.9 (1.7) −8.2 −2.4 −5.7 (2.3) −12.3 −3.3 −6.2 (2.0) −10.4 −2.9 SN–Pal. Pl. (degrees) 7.9 (3.7) 2.1 13.7 7.2 (3.3) −0.7 10.3 8.7 (3.2) 1.3 12.8 8.0 (3.4) 4.5 16.4 SN–Mand. Pl. (degrees) 36.1 (3.9) 30.6 43.5 37.8 (6.0) 29.4 51.8 37.8 (4.3) 32.1 43.9 36.1 (5.8) 27.3 51.9 Pal. Pl.–Mand. Pl. (degrees) 27.2 (4.7) 19.4 35.2 29.0 (5.5) 18.7 41.5 28.5 (4.7) 19.3 36.1 27.4 (4.0) 20.1 35.5 ArGoMe (degrees) 131.5 (5.3) 122.8 140.9 128.3 (7.3) 119.8 144.7 131.2 (5.3) 121.8 141.2 129.6 (5.7) 116.0 138.8 N–Me (mm) 103.2 (4.3) 97.8 108.3 107.8 (8.2) 94.0 121.2 111.0 (6.4) 101.2 120.6 113.2 (7.3) 102.5 129.2 Co–Go (mm) 47.9 (3.6) 42.9 56.5 49.5 (3.4) 43.7 56.5 49.8 (4.3) 45.1 61.2 52.1 (4.9) 44.5 61.2 Go–Pg (mm) 70.0 (3.7) 62.8 74.6 74.8 (4.9) 64.5 81.1 74.4 (6.0) 66.9 86.7 76.3 (6.8) 69.2 94.0 Overjet (mm) −1.3 (1.4) −3.3 0.9 2.3 (1.7) −5.1 0.9 −1.0 (2.3) −6.2 3.2 −0.3 (1.7) −4.4 1.8 Overbite (mm) −0.8 (1.3) −2.8 0.9 0.9 (1.1) −0.8 2.5 −0.7 (1.9) −4.3 1.9 0.3 (1.4) −1.2 3.5 U1–Pal. Pl. (degrees) 111.1 (9.4) 102.3 129.8 106.5 (5.6) 92.8 112.6 112.9 (8.8) 96.0 128.9 115.1 (8.4) 96.1 127.8 FMIA (degrees) 63.5 (7.2) 46.9 73.7 61.3 (7.8) 46.3 71.7 66.1 (5.9) 53.1 74.4 71.3 (6.1) 63.2 81.5 IMP A (degrees) 91.4 (8.4) 77.0 109.1 91.5 (5.9) 83.6 100.7 86.2 (6.0) 76.2 98.9 84.3 (5.8) 75.6 92.9
Interincisal angle (degrees)
130.8 (12.4) 106.0 144.5 133.2 (9.7) 120.6 150.8 133.2 (10.2) 119.6 155.2 134.3 (9.4) 115.6 151.3
by Paola Cozza on September 9, 2014
http://ejo.oxfordjournals.org/
which cases will respond successfully to treatment (11,23,25). Some authors found no measurable improvement of the skeletal pattern dur-ing expansion/protraction treatment, at most a dentoalveolar compen-sation (31,32), while others observed only a weak forward movement of the maxilla and backward rotation of the mandible (23,33). Perhaps these conflicting treatment results could be due to the lack of assign-ment of each patient into the appropriate clinical frame of reference.
Fuzzy cluster repartitions is able to reduce the variability in Class III facial growth direction: recently, patients with high mem-bership rate to HD, HM, and Bal phenotypes have been associated to linearity of growth progression within the limits of cluster char-acteristics (‘dominant evolutionary strategy’) (3). Our data from the whole cohort of 54 Class III treated patients showed that early RME/FM treatment leads to an overall unsuccessful outcome of 16.7% when evaluated at the end of comprehensive treatment with fixed appliances. This prevalence rate of unsuccessful cases is lower than that reported by previous studies (25%) (22,25,33). A possible explanation could be related to the larger sample size of patients analysed in the current investigation. However, and most impor-tantly, when patients were subdivided according to the membership to individual fuzzy cluster (on the basis of only five skeletal param-eters), a large difference in prevalence rates of unsuccessful patients was found: the prevalence rates of unsuccessful cases in Bal, HM, and HD patients were 0%, 28.6%, and 33.3%, respectively.
A high winner cluster indicates a dominant behaviour in which each node of the system is influenced by the behaviour of many other nodes who made the same choice (3). While the ‘hard’ cluster analysis express the main craniofacial characteristic, fuzzy clustering repartition
detects major and minor phenotypic characteristics for each patient, assigning the membership grade to each characteristic (3). For instance, if a patient expresses 60% Bal, 5% HM, and 35% HD characteristics, then the a priori probability of unsuccessful treatment can be calculated by summing the products: (0.60 × 0.0) + (0.05 × 0.28) + (0.35 × 0.33).
During the treatment process, each combination between crani-ofacial variables can introduce new boundaries. Hypothetically, the different treatment outcomes in Bal, HD, and HM patients could be interpreted from the network of the craniofacial interactions. The networks of components of a biological system exhibit topological structures, and these structures affect the way in which the system’s components behave (13,15). Computational tools from statisti-cal physics offer a very insightful way of extracting simple rules of interaction, from which a large variety of growth patterns may occur. Network analysis can collect, analyse, visualize, and interpret biological structures by considering the position of each component in the context of the network topology (16). This framing allows Table 5. Class III patients: successful and unsuccessful treatment
outcome for each phenotype and statistical comparisons Fisher’s test corrected for multiple testing (Holm–Bonferroni method) Bal versus HD S US Fisher’s Exact test; P = 0.004*
Bal 25 0
HD 10 5
HD versus HM S US Fisher’s Exact test; P = 1.000 (NS)
HD 10 5
HM 10 4
Bal versus HM S US Fisher’s Exact test; P = 0.012*
Bal 25 0
HM 10 4
HD = Hyperdivergent; HM = hypermandibular; S= successful; US= unsuc-cessful; NS = not significant.
*Statistically significant.
Table 4. Number of subjects for each fuzzy cluster in the total sam-ple (untreated and treated groups) and in the treated group at T1
Fuzzy cluster
Total sample
7 years 8 years 9 years 10 years
Bal 42 60 55 32 Hyperdivergent 25 57 45 33 Hypermandibular 33 51 46 35 Total 100 168 146 100 Treated group at T1 Bal 9 5 6 5 Hyperdivergent 1 6 5 3 Hypermandibular 3 2 4 5 Total 13 13 15 13
by Paola Cozza on September 9, 2014
http://ejo.oxfordjournals.org/
to highlight the critical components of the system (‘hubs’), areas of mutual influences between the system components (‘between-ness’), and the central role of regulation of each node (‘degree’) (16). Transferring this ‘wiring diagram’ to orthodontics could allow the formalizing of empirical knowledge already available to the practic-ing orthodontist. In this work, a particularly relevant clinical prob-lem was to define possible scenarios of craniofacial evolution that make sense in terms of predicting the future in a given malocclu-sion and to define how the observed topological network properties could be related to the individual response to treatment.
A network of interactions is called modular if it is subdivided into relatively autonomous, internally highly connected subnetworks, that is, ‘modules’ or ‘communities’ (34,35). Modules are small build-ing blocks of large networks: it is widely believed that these features play a very important role in the function of a network. They have many implications for functionality in terms of robustness and tol-erance to perturbations (35). Developmental interactions between parts in a module generate covariation among morphological traits because they transmit variation to the different traits jointly. As high correlated traits frequently evolve together, the ‘morphological inte-gration’ has became a more descriptive concept applying to groups of correlated phenotypic characters (35). Recently, Hidalgo et al. (36) have proposed the use of network analysis to integrate different clin-ical, radiographic, and functional data sets as a viable path toward elucidating the origin and progression of some diseases: patients diagnosed with pathological conditions that have more highly con-nected disease networks tend to progress sooner and get worse than those affected by less-connected diseases. Moreover, networks have revealed that diseases such as obesity, asthma, lipodystrophy, and
glioblastoma may not be as independent of each other as medical practitioners currently consider them to be (37).
As a whole, it should be emphasized that network representa-tion of the complexity of the biological systems only provides an overview of the system under investigation. Furthermore, as already mentioned, cephalometric landmarks are established relative to each other, thus the correlations between measurements may be, at least in part, due to purely geometric factors (38). The fundamental purpose of network analysis is not to decipher the biological form or form changes, but rather to capture information to probe the structure of
a
b
Figures 3. (A) Network analysis and module repartition of cephalometric parameters of 20 successfully treated Class III patients (HM + HD) before orthodontic treatment. (B) Network analysis and module repartition of 9 unsuccessfully treated Class III patients (HM + HD) before orthodontic treatment. The network of unsuccessful patients shows a highly interlinked structure. In biological terms, structures with many interconnections are considered to be particularly resistant to perturbations. The red lines indicate inter-module correlations while the black lines describe intra-module correlations. Figures 2. Network analysis of 54 Class III patients before orthodontic
treatment, after fuzzy clustering repartition. (A) Module repartition of cephalometric parameters of the 25 Class III Bal patients. Network topology exhibits a balanced sharing of four modules. (B) Module repartition of 15 hyperdivergent (HD) patients. (C) Module repartition of 14 hypermandibular (HM) patients. The topology of HD and HM modules reveals a more compact structure: most cephalometric features are strictly interrelated. In HD and HM patients there are several nodes working as bridges among modules. PP: palatal plane; MP: mandibular plane. The red lines indicate inter-module correlations while the black lines describe intra-module correlations.
by Paola Cozza on September 9, 2014
http://ejo.oxfordjournals.org/
dentoskeletal interaction (21). The most relevant aspect of network analysis is the ability to highlight the critical components of the sys-tem (hubs), and the relevance of a node to be functionally capable of holding together regulatory nodes (betweenness and stress) (16).
The visualization of the underlying structure of Class III maloc-clusion through module repartition could mitigate one of the main problematic characteristics of this dentoskeletal imbalance, the phenotypic heterogeneity, and address some missing links between Class III dentofacial deformities, craniofacial growth, and response to treatment. In this study, module analysis of the craniofacial com-ponents showed that the patterns of morphological co-depend-ence between Bal, HD, and HM patients are highly differentiated (Figure 2A–C). Class III patients diagnosed with malocclusion that have more tightly connected modules (HD and HM patients) showed significantly greater prevalence rates of unsuccessful cases (Figure 3A and 3B). These data offer an explicative hypothesis of the great difference of the treatment effects among Bal, HD, and HM patients. In network metrics, the ‘degree’ corresponds to the number of nodes adjacent to a given node, where adjacent means directly connected. Nodes with high degree (highly connected nodes) are called hubs: these nodes hold together several nodes with lower degree. In biological terms, the degree allows an immediate evalu-ation of the cohesive strength and the regulatory relevance of the node (16). In this study, Class III unsuccessful patients exhibited sev-eral highly connected nodes (Co–A, Co–Gn, Go–Pg: nine links each, ArGoMe and SNB: eight links each, Co–Go: seven links, etc.), while in successful patients only interincisal angle and Co–Gn are the most connected nodes (five links each). While at least in part the inter-actions between craniofacial characteristics are purely geometric in nature (Supplementary Figure 1A and 1B), densely connected struc-tures are known to be related to robustness and to scarce sensibility to perturbations (15, 34), thus displaying a very high homeostasis of the system. Hypothetically, the observed marked differences in the treatment effects shown by Bal, HM, and HD subjects could be related, at least in part, to the more interlinked topology of the regu-latory interactions of HM and HD patients (in a complex biological system, too many influences among the components paradoxically reinforce, and sometime paralyze, the system) (18). The poor skel-etal and dentoalveolar treatment effects observed in HD and HM patients could be interpreted through a similar logical paradigm: while the under-connected nodes of Bal patients facilitate the mech-ano-transduction of facemask-protraction forces (the mechanisms by which cells convert mechanical stimulus into chemical activity), the dense HM and HD interactive arrangement oppose the treat-ment forces. The high betweenness and stress scores observed in the unsuccessful patients between non-geometrically related cephalo-metric variables (Supplementary Table 3) confirm these assumptions, as both metrics indicate a strict control over the craniofacial interac-tions. Hypothetically, low stress and betweenness scores observed in successful cases could be linked to the fragility toward the treat-ment forces carried on the nodes that act as a fulcra of connection. Finally, the difference observed between successful and unsuccessful non-geometrically related craniofacial features in the correlations between skeletal and incisal proclination/retroclination characteris-tics (Supplementary Figure 1A and 1B, see, for example, the strength of correlations between Go–Pg and IMPA in successful and unsuc-cessful patients) might be related to the relevance of self-corrective dentoalveolar processes in influencing the Class III successful treat-ment outcomes.
Although treatment outcome in patients with Class III maloc-clusion may be unpredictable in details, analyses from statistical
physics make the general shape of the changing forms of crani-ofacial organization relatively predictable and simple, so improv-ing the interpretation of quantitative, patient-specific information, driving to detection of subsets of patients that are poor candidates for orthopedic treatment. On the basis of the conceptual framing emerging from this study, the prediction of the effects of treat-ment on dentofacial deformities of Class III patients can be related to the individualized structure of cephalometric characteristics, as highlighted by fuzzy clustering repartition.
Conclusions
The results of this study showed that the individual cluster member-ship evaluated before treatment in Class III patients by means of fuzzy clustering repartition can be used effectively to predict treat-ment outcomes of RME and facial mask therapy followed by fixed appliances. HD and HM patients showed a significantly greater prevalence rate of unsuccessful cases than Bal patients. The network analysis of craniofacial features of these patients provided a hypo-thetical conceptual descriptive framework of the observed differ-ences in outcome.
Supplementary material
Supplementary Figures and Tables are available at European Journal of Orthodontics online.
References
1. Merrifield, L.L. (1996) Differential diagnosis. Seminars in Orthodontics, 2, 241–253.
2. McDonald, F. and Ireland A.J. (1998) Diagnosis of the Orthodontic Patient. Oxford University Press, Oxford, UK, p. 18.
3. Auconi, P., Scazzocchio, M., Defraia, E., McNamara, J.A., Jr and Franchi, L. (2014) Forecasting craniofacial growth in individuals with Class III malocclusion by computational modeling. European Journal of Ortho-dontics, 36, 207–216.
4. Williams, S. and Andersen, C.E. (1986) The morphology of the potential Class III skeletal pattern in the growing child. American Journal of Ortho-dontics, 89, 302–311.
5. Battagel, J.M. (1993) The aetiological factors in Class III malocclusion. European Journal of Orthodontics, 15, 347–370.
6. Singh, G.D. (1999) Morphologic determinants in the etiology of Class III malocclusions: a review. Clinical Anatomy, 12, 382–405.
7. Reyes, B.C., Baccetti, T. and McNamara, J.A., Jr. (2006) An estimate of craniofacial growth in Class III malocclusion. The Angle Orthodontist, 76, 577–584.
8. Baccetti, T., Franchi, L. and McNamara, J.A., Jr. (2007) Growth in the untreated Class III subject. Seminars in Orthodontics, 13, 130–142. 9. Alexander, A.E., McNamara, J.A., Jr, Franchi, L. and Baccetti, T. (2009)
Semilongitudinal cephalometric study of craniofacial growth in untreated Class III malocclusion. American Journal of Orthodontics and Dentofacial Orthopedics, 135, 700.e1–14; discussion 700.
10. Wolfe, S.M., Araujo, E., Behrents, R.G. and Buschang, P.H. (2011) Crani-ofacial growth of Class III subjects six to sixteen years of age. The Angle Orthodontist, 81, 211–216.
11. Fudalej, P., Dragan, M. and Wedrychowska-Szulc, B. (2011) Prediction of the outcome of orthodontic treatment of Class III malocclusions–a system-atic review. European Journal of Orthodontics, 33, 190–197.
12. Goldenfeld, N. and Kadanoff, L.P. (1999) Simple lessons from complexity. Science, 284, 87–89.
13. Barabási, A.L. (2007) The architecture of complexity. IEEE Control Sys-tem Magazine, 27, 33–42.
14. Crutchfield, J. and Wiesner, K. (2010) Simplicity and complexity. Physics World, 23, 36–38.
by Paola Cozza on September 9, 2014
http://ejo.oxfordjournals.org/
15. Barabási, A.L., Gulbahce, N. and Loscalzo, J. (2011) Network medicine: a network-based approach to human disease. Nature Reviews, 12, 56–68. 16. Caldarelli, G. (2007) Scale-Free Networks: Complex Webs in Nature and
Technology. Oxford University Press, Oxford, UK, pp. 34–59.
17. Caldarelli, G. and Catanzaro, M. (2012) Networks: A Very Short Intro-duction. Oxford University Press, Oxford, UK, pp. 54–65.
18. Ma’ayan, A., Blitzer, R.D. and Iyengar, R. (2005) Toward predictive mod-els of mammalian cells. Annual Review of Biophysics and Biomolecular Structure, 34, 319–349.
19. Scala, A., Auconi, P., Scazzocchio, M., Caldarelli, G., McNamara, J.A. and Franchi, L. (2012) Using networks to understand medical data: the case of Class III malocclusions. PLoS ONE, 7, e44521.
20. Zadeh, L.A. (1965) Fuzzy sets. Information and Control, 8, 338–353. 21. Auconi, P., Caldarelli, G., Scala, A., Ierardo, G. and Polimeni, A. (2011)
A network approach to orthodontic diagnosis. Orthodontics and Crani-ofacial Research, 14, 189–197.
22. Westwood, P.V., McNamara, J.A., Jr, Baccetti, T., Franchi, L. and Sarver, D.M. (2003) Long-term effects of Class III treatment with rapid maxillary expansion and facemask therapy followed by fixed appliances. American Journal of Orthodontics and Dentofacial Orthopedics, 123, 306–320. 23. Masucci, C., Franchi, L., Defraia, E., Mucedero, M., Cozza, P. and
Bac-cetti, T. (2011) Stability of rapid maxillary expansion and facemask ther-apy: a long-term controlled study. American Journal of Orthodontics and Dentofacial Orthopedics, 140, 493–500.
24. Kosko, B. (1993) Fuzzy Thinking: The New Science of Fuzzy Logic. Hype-rion, New York, NY, pp. 18–39.
25. Baccetti, T., Franchi, L. and McNamara, J.A., Jr. (2004) Cephalometric variables predicting the long-term success or failure of combined rapid maxillary expansion and facial mask therapy. American Journal of Ortho-dontics and Dentofacial Orthopedics, 126, 16–22.
26. Baccetti, T., Franchi, L., McNamara, J.A., Jr. (2005) The cervical vertebral maturation (CVM) method for the assessment of optimal treatment timing in dentofacial orthopedics. Seminars in Orthodontics, 11, 119–129.
27. Kim, J.H., Viana, M.A., Graber, T.M., Omerza, F.F. and BeGole, E.A. (1999) The effectiveness of protraction face mask therapy: a meta-analy-sis. American Journal of Orthodontics and Dentofacial Orthopedics, 115, 675–685.
28. Baccetti, T., Reyes, B.C. and McNamara, J.A., Jr. (2005) Gender differ-ences in Class III malocclusion. The Angle orthodontist, 75, 510–520. 29. Halazonetis, D.J. (2011) Permutation method for evaluating topographic
craniofacial correlations. American Journal of Orthodontics and Dentofa-cial Orthopedics, 139, e211–e217.
30. Guyer, E.C., Ellis, E.E., 3rd, McNamara, J.A., Jr and Behrents, R.G. (1986) Components of class III malocclusion in juveniles and adolescents. The Angle Orthodontist, 56, 7–30.
31. Saadia, M. and Torres, E. (2000) Sagittal changes after maxillary protrac-tion with expansion in class III patients in the primary, mixed, and late mixed dentitions: a longitudinal retrospective study. American Journal of Orthodontics and Dentofacial Orthopedics, 117, 669–680.
32. Zentner, A., Doll, G.M. and Peylo, S.M. (2001) Morphological parameters as predictors of successful correction of Class III malocclusion. European Journal of Orthodontics, 23, 383–392.
33. Ngan, P. (2005) Early timely treatment of Class III malocclusion. Seminars in Orthodontics, 11, 140–145.
34. Wagner, G.P., Pavlicev, M. and Cheverud, J.M. (2007) The road to modu-larity. Nature Reviews, 8, 921–931.
35. Klingenberg, C.P. (2008) Morphological integration and developmental modularity. Annual Review of Ecology Evolution and Systematics, 39, 115–132.
36. Hidalgo, C.A., Blumm, N., Barabási, A.L. and Christakis, N.A. (2009) A dynamic network approach for the study of human phenotypes. PLoS Computational Biology, 5, e1000353.
37. Barabási, A.L. (2007) Network medicine–from obesity to the “disea-some”. New England Journal of Medicine, 357, 404–407.
38. Solow, B. (1966) The pattern of craniofacial associations. Acta Odonto-logica Scandinavica, 24(suppl 46), 1–174.
by Paola Cozza on September 9, 2014
http://ejo.oxfordjournals.org/