R E S E A R C H A R T I C L E
Open Access
Candidate genes and SNPs associated with
stomatal conductance under drought stress
in Vitis
Massimiliano Trenti
1*, Silvia Lorenzi
1, Pier Luigi Bianchedi
2, Daniele Grossi
3, Osvaldo Failla
3,
Maria Stella Grando
1,4*and Francesco Emanuelli
1,3Abstract
Background: Understanding the complexity of the vine plant’s response to water deficit represents a major challenge for sustainable winegrowing. Regulation of water use requires a coordinated action between scions and rootstocks on which cultivars are generally grafted to cope with phylloxera infestations. In this regard, a genome-wide association study (GWAS) approach was applied on an‘ad hoc’ association mapping panel including different Vitis species, in order to dissect the genetic basis of transpiration-related traits and to identify genomic regions of grape rootstocks associated with drought tolerance mechanisms.
The panel was genotyped with the GrapeReSeq Illumina 20 K SNP array and SSR markers, and infrared thermography was applied to estimate stomatal conductance values during progressive water deficit.
Results: In the association panel the level of genetic diversity was substantially lower for SNPs loci (0.32) than for SSR (0.87). GWAS detected 24 significant marker-trait associations along the various stages of drought-stress experiment and 13 candidate genes with a feasible role in drought response were identified.
Gene expression analysis proved that three of these genes (VIT_13s0019g03040, VIT_17s0000g08960, VIT_18s0001g15390) were actually induced by drought stress.
Genetic variation of VIT_17s0000g08960 coding for a raffinose synthase was further investigated by resequencing the gene of 85 individuals since a SNP located in the region (chr17_10,497,222_C_T) was significantly associated with stomatal conductance.
Conclusions: Our results represent a step forward towards the dissection of genetic basis that modulate the response to water deprivation in grape rootstocks. The knowledge derived from this study may be useful to exploit genotypic and phenotypic diversity in practical applications and to assist further investigations.
Keywords: Grapevine, Rootstocks, Drought stress, Genome-wide association study, Candidate gene
© The Author(s). 2021 Open Access This article is licensed under a Creative Commons Attribution 4.0 International License, which permits use, sharing, adaptation, distribution and reproduction in any medium or format, as long as you give appropriate credit to the original author(s) and the source, provide a link to the Creative Commons licence, and indicate if changes were made. The images or other third party material in this article are included in the article's Creative Commons licence, unless indicated otherwise in a credit line to the material. If material is not included in the article's Creative Commons licence and your intended use is not permitted by statutory regulation or exceeds the permitted use, you will need to obtain permission directly from the copyright holder. To view a copy of this licence, visithttp://creativecommons.org/licenses/by/4.0/. The Creative Commons Public Domain Dedication waiver (http://creativecommons.org/publicdomain/zero/1.0/) applies to the data made available in this article, unless otherwise stated in a credit line to the data.
* Correspondence:[email protected]; [email protected];[email protected]
1Research and Innovation Centre, Fondazione Edmund Mach, via E. Mach 1,
38010 San Michele all’Adige, Italy
Background
Climate change is strongly influencing human life and natural systems [1, 2], having a drastic impact on agri-culture worldwide, and so vitiagri-culture must also face these new environmental conditions. Drought is the fac-tor, among abiotic stressors, which mostly affects plant physiology [3]. Therefore, understanding the complexity of the plant’s response to water deficit poses a major challenge for researchers.
Grapevine is considered to be a relatively drought tol-erant plant, thus the impact of climate change on viticul-ture sustainability is subject of lively debate [4–7]. Nevertheless, strategies to reduce water consumption and to improve water-use efficiency (WUE) in vines are funda-mental for the future [8]. Water deficit strongly affects fruit quality and causes significant losses in crop yield. In particular, prolonged droughts could have consequences for the upcoming growing seasons [9] and may enhance susceptibility to biotic pests or pathogens [10].
Drought-stress response is the result of complex and dynamic physiological, biochemical and molecular pro-cesses at cellular and systemic levels. Water deficit leads to vegetative development [11], stomatal conductance [12,13] and xylem hydraulic conductivity [14] reduction. Likewise, drought induces mechanisms to counteract the deleterious effects of ROS [15–17], to adjust cellular homeostasis [18] and to improve the water uptake [19–
21]. The adjustment of plant water balance is also
strongly influenced by phylloxera-resistant rootstocks [22], which exhibit a large variability in drought toler-ance [23] and have a prominent role in regulation of sto-matal conductance [24–26]. However, the genetic basis of drought response in rootstocks are generally poorly understood and only few works are available regarding whether rootstocks alter the gene expression of scions [27,28] or whether there is an exchange of genetic ma-terial between them [29,30].
Previous studies aimed to identify the genetic basis of drought response in grapevine [24, 31] and were con-ducted on biparental populations. Few Genome-wide as-sociation studies (GWAS) have been reported in grapevine yet, and interesting associations were found for fruit quality traits [32], leaf morphology [33] and domestication-related traits [34]. However, there are no reports to date of GWAS conducted to reveal the gen-etic control of drought response in grapevine. Further-more, correct and accurate phenotyping plays a pivotal role in the dissection of genomic regions involved in drought tolerance [35]. In this regard, the application of chlorophyll fluorescence, near infrared (NIR) and hyper-spectral imaging to assess grapevine phenotypes has be-come more common in recent years [36–39]. In the present study the application of infrared thermography allowed to evaluate rootstocks response to water deficit
in an ‘ad hoc’ core-collection of grapes, reducing the time for phenotypic data collection, and thus allowing the screening of numerous genotypes. A GWAS ap-proach was adopted to dissect the genomic basis of transpiration-related traits aiming to identify genetic re-gions involved in drought resilience potentially relevant for crop genetic improvement.
Results
A genetic core collection of grape rootstocks
The study was conducted on a genetic core collection constituted by 100 Vitis spp. accessions, listed in Table S1. A two-steps procedure was applied in order to define this restricted set of genetically highly diverse grapevine accessions as an‘ad hoc’ association panel. Firstly, a core collection was created from non-vinifera Vitis species and interspecific hybrids used for fruit production, main-tained at the grapevine germplasm collection of Fonda-zione Edmund Mach [40], to increase the allelic diversity among wild grapevines, rootstocks and hybrids acces-sions based on a set of 21 microsatellites. Thus, accord-ing to the M-method, 98 accessions were enough to capture the total allelic diversity (412 alleles) existing in the 231 samples analyzed. Afterwards, 41 rootstock ac-cessions, deriving from Milano University’s breeding program, and another six additional commercial root-stocks (Paulsen 1103, Kober 5BB, Selection Oppenheim 4, Millardet et de Grasset 41B, Millardet et de Grasset 101.14 and 140 Ruggeri) were included obtaining a panel of 145 individuals. In order to have an association panel easy to manage, which adequately captures as much gen-etic diversity as possible with a minimum of repetitive-ness, it was further reduced to 100 samples based again on the M-method. At this step the six commercial root-stocks and four out of the 41 rootroot-stocks derived from the breeding program (M1, M2, M3, M4) were arbitrary forced to be included. The number of different alleles retained by the SSRs in the final association panel was 425.
Genetic diversity of the core collection
The genetic diversity within the core collection was in-vestigated by both SSR (n = 21) and SNP (GrapeReseq 20 K SNPs array) markers (Table 1). Regarding SNPs, after removing low quality loci, the filtered data set was made up of 16,562 SNPs. Moreover, as a consequence of the identification of missing genotypes, SNPs with a minor allele frequency (MAF) lower than 0.1 were add-itionally removed, remaining a final number of 7133 fil-tered SNPs. The average number of effective alleles was 1.51. Concerning SSR markers, 425 different alleles (A) were obtained, averaging 20.24 per locus, and allele fre-quencies ranged from 2.66 to 17.42, with an average of 10.07. The values of observed (HO= 0.77) and expected
(HE= 0.87) heterozygosity were almost three times
higher than those estimated for SNP markers (0.26 and 0.32, respectively). Lastly, the value of F index (inbreed-ing coefficient) was higher for SNPs (0.19) than for SSR markers (0.12).
The diversity parameters changed if Hybrids, Root-stocks/Wild and Rootstocks Breeding groups were con-sidered separately. The number of alleles at the SSR loci varied from 195 in Rootstocks Breeding to 341 in Root-stocks/Wild, while for SNP markers it ranged from 13, 467 in Rootstocks Breeding to 14,197 in Rootstocks/ Wild. The average effective number of alleles observed among SSR loci ranged from 5.47 in Rootstocks Breed-ing to 8.40 in Rootstocks/Wild, whereas for SNP ones it varied from 1.32 in Rootstocks Breeding to 1.71 in Hy-brids. The expected heterozygosity level estimates within groups varied from 0.78 (Rootstocks Breeding) to 0.84 (Rootstocks/Wild) for the SSRs and from 0.20 (Root-stocks Breeding) to 0.40 (Hybrids) for the SNPs. On the contrary, the subset of Rootstocks/Wild revealed the lowest values of observed heterozygosity both for SSR (0.74) and for SNP markers (0.19). Finally, the highest values of F index were detected in Rootstocks/Wild group both for the SSRs and SNPs (0.12 and 0.17, re-spectively) whereas the lowest values were observed in the Hybrids subset (− 0.01 at SSR loci and − 0.03 at SNP loci).
Population structure of the core collection
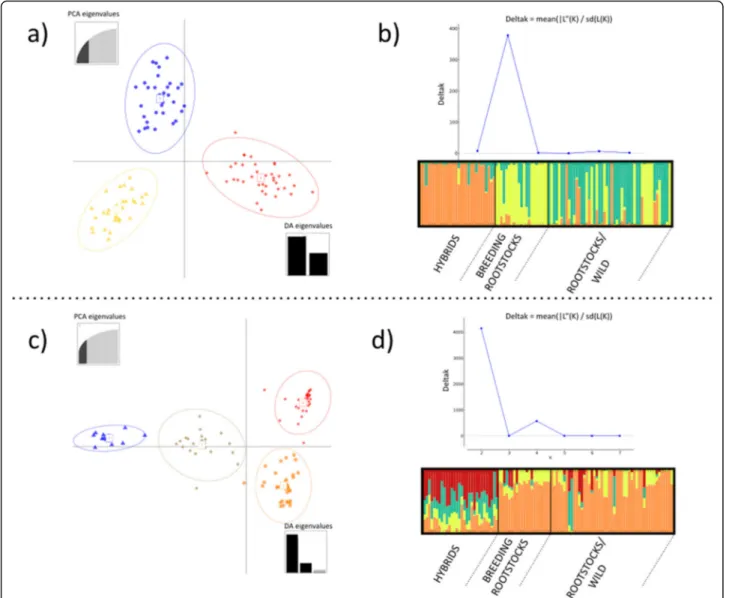
The genetic structure of the analyzed population was in-vestigated using DAPC and STRUCTURE. The DAPC analysis identified three clusters based on SSR markers (Fig.1a). Cluster 1 included mainly rootstocks and other
Vitis species (59%) whereas Cluster 2 and Cluster 3
comprised most of the Breeding Rootstocks (81%) and Hybrids (100%), respectively. The model-based Bayesian clustering method in STRUCTURE software with SSR dataset (Fig.1b) gave similar results in terms of different
possible numbers of subpopulations. The ΔK method
[41] assigned the highest value at K = 3, resulting in the
separation of Rootstocks/Wild, Hybrids and Breeding Rootstocks in three quite distinguished groups. On the other hand, regarding the SNP dataset the same analysis showed the highest ΔK value at K = 2, dividing Hybrids from other Vitis species, although a minor signal of population stratification was also found at K = 4 (Fig.1d) and, in this case, hybrids showed a high level of genetic admixture. DAPC analysis based on SNP markers also identified four clusters (Fig.1c): Cluster 1 and Cluster 2 mainly comprised Hybrids (40 and 60% respectively), Cluster 3 included mostly Breeding Rootstocks (95%) and Cluster 4 contained a large part of Rootstocks/Wild (55%).
Phenotypic characterization of the association panel under drought stress
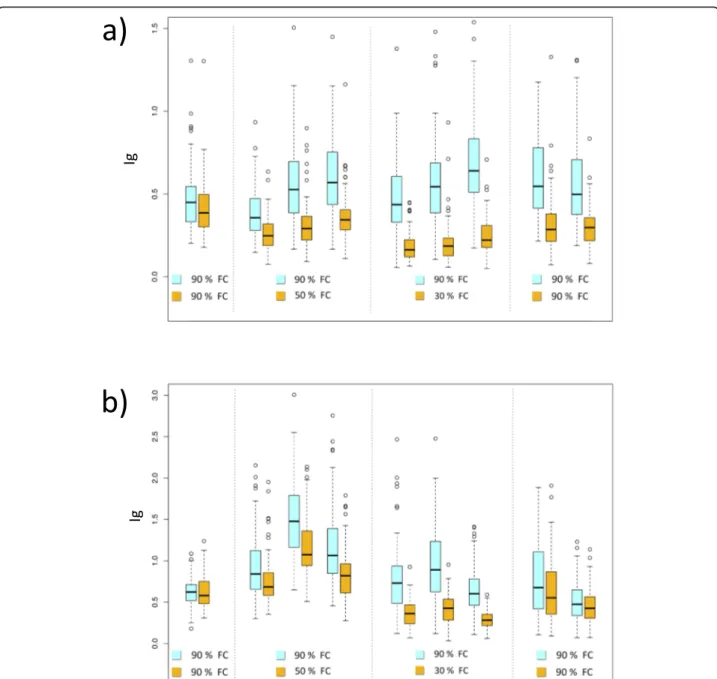
The evaluation of the transpiration rate under drought stress in the association population was repeatedly per-formed in two years, in which vines of the 100 acces-sions were subjected to deficit irrigation (T2-T7) or were maintained in well-watered conditions for 30 days. Water stressed vines were monitored for a week at well-watered conditions before the imposition of water deficit (T1). Drought stress treatment resulted in a significant decrease of stomatal conductance (Ig), but only in the
second year experiment water-stressed plants reached transpiration values comparable with control plants after the recovery period (T8-T9) (Fig.2). Statistically
signifi-cant differences of Ig and Crop Water Stress Index
(CWSI) were observed between control (WW) and water stressed (WS) plants in both years (Table2).
Genome-wide association analysis
The GWAS was conducted for the transpiration traits related to stomatal conductance using both GLM and MLM methods. The GLM + Q was chosen as the best model based on Quantile-Quantile plots comparisons for associations found for most of the traits under inves-tigation. The MLM + K model was instead preferred at T4 and T9 in the first year experiment. Table3 reports
Table 1 Summary of genetic diversity parameters within the core collection and its three subpopulations
Sample N A Amean AE HE HO uHE F SSR Hybrids 30 246 11.714 5.810 0.810 0.817 0.825 −0.009 Breeding Rootstocks 21 195 9.286 5.465 0.781 0.759 0.801 0.033 Roostocks/Wild 49 341 16.238 8.399 0.839 0.742 0.849 0.124 Total 100 425 20.238 10.065 0.868 0.768 0.873 0.116 SNP Hybrids 30 14,167 1.986 1.710 0.396 0.412 0.403 −0.031 Breeding Rootstocks 21 13,467 1.888 1.323 0.201 0.211 0.208 −0.011 Roostocks/Wild 49 14,197 1.990 1.337 0.219 0.189 0.222 0.167 Total 100 14,266 2.000 1.511 0.322 0.262 0.324 0.186
N sample size, A number of different alleles, Ameanmean number of alleles per locus, AEeffective number of alleles, HEexpected heterozygosity, HOobserved
twenty-four SNPs that showed significant p-values after multiple testing corrections. Marker-trait significant asso-ciations were identified for stomatal conductance (Ig) values at time points T3, T4, T5 and T9 in water stressed plants in the first year experiment (Figure S1). Five markers out of these 24 SNPs, identified in the first year experiment, were also significant after Bonferroni correc-tion. The SNP chr17_10,497,222_C_T showed a signifi-cant association during severe water stress (T5), two SNPs
(chr13_11,950,617_C_T, chr18_13,519,938_C_T) were
statistically significant under moderate water stress (T4) and two SNPs (chr3_7,009,222_A_G and chr16_21,122, 534_A_G) were significantly associated with transpiration after the recovery period (T9). Nineteen SNPs out of 24
were found significantly associated only after False Discov-ery Rate correction (FDR) and are, thus, identified here as suggestive associations; thirteen were detected in the first year experiment during moderate stress (T3, T4) and re-covery (T9), whereas six could be found in the second year experiment at T1 and T9, that is to say, before and after (recovery) water stress, respectively. GWAS with pheno-typic data collected during the second year experiment
did not identify any significant association after
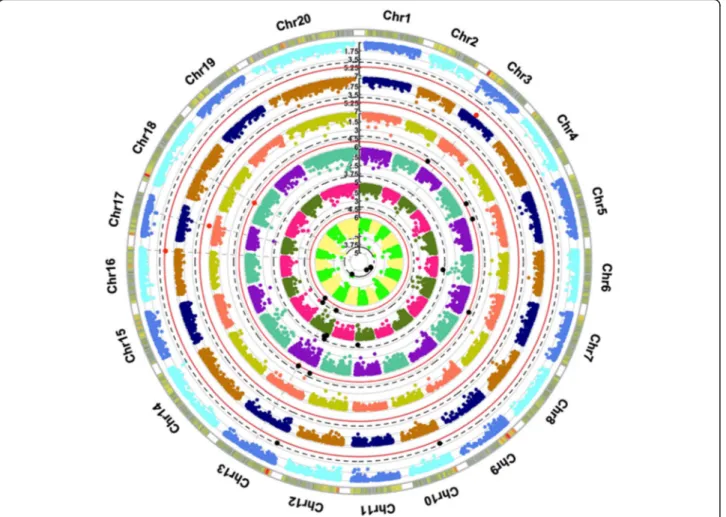
Bonferroni correction (Figure S2). A circular Manhattan plot (Fig.3) summarizes all the association results of both experiments.
The associated SNPs were examined to identify po-tential candidate genes. Firstly, it was considered Fig. 1 Genetic structure of the core collection. Two-dimension DAPC (Discriminant Analysis of Principal Component) scatter plot based on 21 SSRs (a) and on 7132 SNPs (c). Scatterplots represent the distribution of individuals along the first two linear discriminants. Population structure of the collection using the program STRUCTURE based on 21 SSRs (b) and on 7132 SNPs (d). Plots of mean probability ofΔK as calculated by Evanno et al. [41] to detect greatest likelihood of K. Barplots represent the average estimated membership probability of an individual to belong to a specific cluster (indicated by specific color) generated with the DISTRUCT software based on the Q-matrix consensus using the
whether polymorphisms would be localized in genic regions. Out of the 24 significant SNPs (Table 3) 15 were located within genes, while the remaining SNPs were in intergenic regions. For those markers located outside gene regions or in genes functionally non-annotated, the 20 kilobases surrounding them were scanned, since Linkage Disequilibrium (LD) is re-ported to decay rapidly in grapevine [34, 42–44]. Thirteen candidate genes, selected according to their biological functions related to water stress response or for their position, are listed in Table 4.
Validation of GWAS results
To validate the marker-trait association found for SNPs within genes VIT_17s0000g08960, VIT_16s0098g00780,
VIT_13s0106g00790 and VIT_13s0019g03040, 16
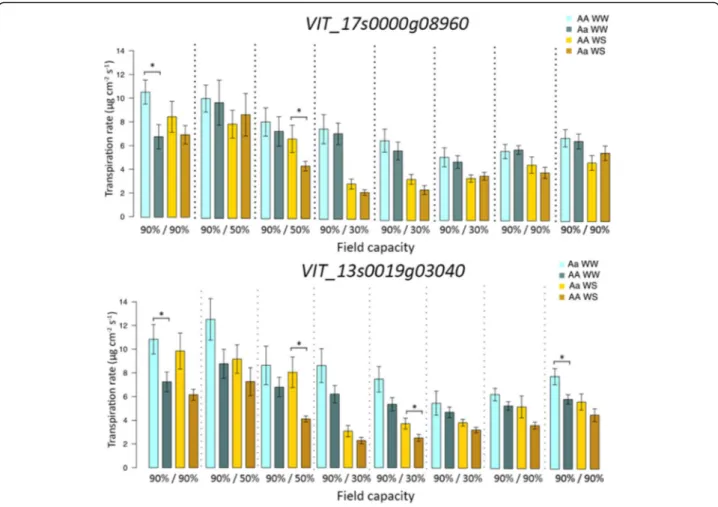
root-stock varieties were selected for a further water stress study. Transpiration rates of WW and WS plants were measured throughout the experiment with a steady state porometer. Significant differences were detected between heterozygous and homozygous plants for SNPs in the
coding regions of VIT_17s0000g08960 and VIT_
13s0019g03040(Fig.4), whereas no difference was found Fig. 2 Comparison of stomatal conductance indices deduced from thermal images between well-watered (WW) (in blue) and water stressed plants (WS) (in yellow) during the water stress experiments in the first year (a) and in the second year (b)
in stomatal conductance for plants carrying different genetic variants in genes VIT_16s0098g00780 and VIT_
13s0106g00790 (data not shown). As far as VIT_
17s0000g08960 is concerned, rootstocks heterozygous
for this SNP exhibited a significant reduced transpiration rate compared with other varieties at the beginning of stress (T1) in WW plants and at moderate water stress (T3) in WS plants (Table S2, Fig. 4) although stomatal conductance values were lower also during severe stress (T4, T5). Regarding the mutation of VIT_13s0019g03040, significant differences between homozygous and heterozy-gous groups were found at moderate (T3) and at severe stress (T5) in water-stressed plants and at the beginning and end of the experiment (T1, T8) in control plants (Fig. 4, Table S2).
Gene expression analysis of candidate genes under drought stress
The expression of candidate genes VIT_17s0000g08960,
VIT_18s0001g15390, VIT_16s0098g00780, VIT_
13s0106g00790 and VIT_13s0019g03040 under water
stress was further investigated. Four rootstock genotypes (Richter 110, Riparia Gloire de Montpellier, 101.14 Mill-ardet et de Grasset and SO4 Selection Oppenheim) were subjected to stress by water deprivation for 14 days. These genotypes were selected both to represent puta-tively different classes of response to water stress and based on the SNP chr17_10,497,222_C_T at the candi-date gene VIT_17s0000g08960 (Table5).
Volumetric soil water content and stomatal conduct-ance were determined throughout the experiment to monitor the stress evolution (Fig. 5). WS plants (water stress) showed a continuous decrease in soil water con-tent with a substantial decline at four days from the be-ginning of the experiment. Interestingly, starting from 8 days after stopping irrigation, water content was signifi-cantly higher in SO4 compared to other genotypes. On the other hand, soil moisture in the WW control plants was maintained around 30% during the entire experi-mental period. Stomatal conductance, which is consid-ered a reference parameter of plant status in response to drought, was significantly reduced by water deficit in all the rootstocks from the fourth day. Plants exhibited dif-ferent degrees of tolerance after water deprivation for two weeks. Leaves of SO4 remained almost green and turgid, whereas 110R and 101.14 showed some signs of plant stress and RGM vines were considerably damaged (Figure S3).
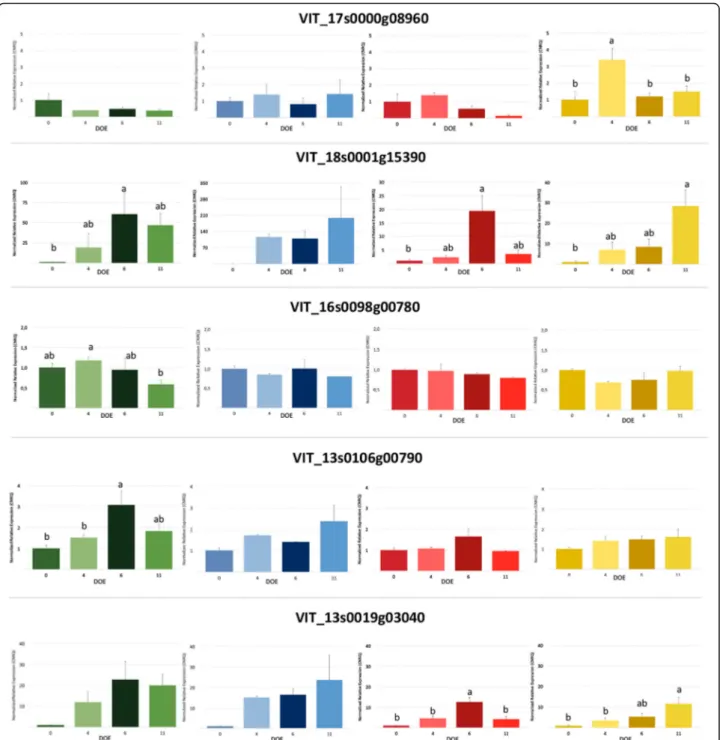
The expression of candidate genes during progressive drought stress was investigated in the leaf tissues of the
four genotypes (Fig. 6). The mRNA level of VIT_
17s0000g08960in SO4 was significantly higher after 4 days of water deprivation when plants showed first signs of stress and a notable reduction of transpiration (Fig. 5),
Table 2 Descriptive statistics of the phenotypic data from control (WW) and water stressed plants (WS) in each year of phenotyping Year Time points Treatment FC (%) Ig CWSI Mean SD Mean SD 1° T1 WW 90 0.487 0.236 0.710 0.080 WS 90 0.418 0.169 0.733 0.070 T2 WW 90 0.379 0.140 0.747 0.066 WS 50 0.264 *** 0.104 0.807 *** 0.059 T3 WW 90 0.576 0.284 0.681 0.089 WS 50 0.318 *** 0.153 0.785 *** 0.074 T4 WW 90 0.623 0.295 0.655 0.088 WS 50 0.365 *** 0.146 0.755 *** 0.067 T5 WW 90 0.513 0.307 0.705 0.095 WS 30 0.184 *** 0.088 0.859 *** 0.054 T6 WW 90 0.615 0.357 0.667 0.117 WS 30 0.205 *** 0.132 0.850 *** 0.066 T7 WW 90 0.765 0.467 0.614 0.111 WS 30 0.247 *** 0.117 0.821 *** 0.066 T8 WW 90 0.625 0.317 0.660 0.103 WS 90 0.352 *** 0.345 0.779 *** 0.097 T9 WW 90 0.571 0.282 0.675 0.093 WS 90 0.325 *** 0.222 0.776 *** 0.093 2° T1 WW 90 0.627 0.183 0.639 0.068 WS 90 0.623 0.191 0.639 0.067 T2 WW 90 0.926 0.384 0.566 0.090 WS 50 0.763 ** 0.300 0.612 *** 0.074 T3 WW 90 1.540 0.510 0.443 0.075 WS 50 1.172 *** 0.343 0.503 *** 0.069 T4 WW 90 1.220 0.623 0.518 0.089 WS 50 0.847 *** 0.309 0.589 *** 0.079 T5 WW 90 0.798 0.442 0.615 0.110 WS 30 0.372 *** 0.174 0.759 *** 0.079 T6 WW 90 0.947 0.466 0.570 0.123 WS 30 0.410 *** 0.185 0.738 *** 0.094 T7 WW 90 0.651 0.281 0.649 0.094 WS 30 0.289 *** 0.108 0.795 *** 0.062 T8 WW 90 0.782 0.438 0.621 0.125 WS 90 0.659 0.393 0.653 0.130 T9 WW 90 0.513 0.242 0.699 0.092 WS 90 0.458 0.201 0.715 0.083
Asterisks denote significant differences according to Mann-Whitney U test between water-stressed (WS) and well-watered (WW) plants at the same time point. **, and *** indicate significantly different values at p < 0.01, and p < 0.001. T1: starting point where both WW and WS plants were maintained under well-watered conditions; T2-T4: WS plants were maintained at 50% of FC (moderate deficit); T5-T7: WS plants were maintained at 30% of FC (severe deficit); T8-T9: recovery period, WS plants were rehydrated at 90% of FC
whereas its expression decreased in the later stages of the experiment. On the other hand, the relative expression of VIT_17s0000g08960did not vary in response to drought in RGM, 110R and 101.14. Regarding VIT_18s0001g15390 its transcript level was increased by water deficit, even if the peak of expression was after 6 days in RGM and 101.14 and after 11 days in 110R and SO4. A comparable time-course profile was observed for the VIT_13s0019g03040 mRNA that was significantly modulated in the four genotypes. VIT_13s0106g00790was up-regulated only in RGM plants, with higher level of expression at 6 days. Finally, the relative expression of VIT_16s0098g00780 remained basically un-changed during the experiment.
Resequencing of candidate gene VIT_17s0000g08960 in the association population
In order to detect a potential causative variant, the cod-ing region of VIT_17s0000g08960 was sequenced in 85 individuals of the core collection (Table S1). A summary of the key genetic diversity parameters observed through
analysis of 2343 bp of the coding sequence is shown in Table6.
VIT_17s0000g08960 contains 4 exons as reported in
the gene annotation deposited on Grape Genome Data-base v2.1. Resequencing allowed identification of 134 SNPs, revealing a frequency of polymorphic sites equal to one SNP every 17 bp. Only one INDEL was found in exonic regions. The nucleotide diversity (π = 0,007) and the number of segregating sites (θ = 0,011) provided an estimate of the genetic variation at the nucleotide level. Synonymous sites, on the other hand, showed a nucleo-tide diversity value (0.015) much higher than non-synonymous sites (0.005). In addition, genetic variation level estimated by dividing Vitis accessions into two sub-sets (Rootstocks and Hybrids) is reported in Table S3. The Rootstocks subset exhibited greater rate of polymor-phisms (one SNP every 21 bp) and lower nucleotide di-versity (π = 0,006, θ = 0,011) than the Hybrids subgroup (one every 33 bp, π = 0,007, θ = 0,007). Neutrality tests were estimated using two values, Tajima’s D value and Fu and Li’s F value. Both tests indicated that the
Table 3 SNPs significantly associated to stomatal conductance (Ig) values
Trait Year SNP Chr Pos P value QTL effect R2 Multiple testing corrections
IgT4 1 chr13_11,950,617_C_T 13 11,950,617 7.80E-06 A/D 0.39 BC/FDR
IgT4 1 chr18_13,519,938_C_T 18 13,519,938 8.30E-06 D 0.38 BC/FDR
IgT5 1 chr17_10,497,222_C_T 17 10,497,222 6.07E-07 D 0.25 BC/FDR
IgT9 1 chr3_7,009,222_A_G 3 7,009,222 2.34E-07 A/D 0.50 BC/FDR
IgT9 1 chr16_21,122,534_A_G 16 21,122,534 5.24E-06 A 0.56 BC/FDR IgT3 1 chr6_13,441,720_C_T 6 13,441,720 4.82E-05 A 0.22 FDR IgT3 1 chr11_18,012,075_T_C 11 18,012,075 3.28E-05 A 0.22 FDR IgT3 1 chr13_10,652,062_A_G 13 10,652,062 3.64E-04 D 0.17 FDR IgT3 1 chr13_4,177,522_C_T 13 4,177,522 2.29E-05 A 0.24 FDR IgT3 1 chr13_1,833,944_A_G 13 1,833,944 1.27E-05 A 0.18 FDR
IgT4 1 chr7_17,388,970_A_G 7 17,388,970 9.99E-06 A/D 0.40 FDR
IgT4 1 chr13_11,952,742_G_T 13 11,952,742 1.01E-05 A/D 0.40 FDR IgT4 1 chr5_2,431,422_C_T 5 2,431,422 1.24E-05 A/D 0.41 FDR IgT4 1 chr4_18,754,964_C_T 4 18,754,964 1.60E-05 A/D 0.37 FDR IgT4 1 chr3_235,211_C_T 3 235,211 1.60E-05 A/D 0.36 FDR IgT4 1 chr13_2,031,649_T_C 13 2,031,649 1.73E-05 A/D 0.36 FDR IgT9 1 chr10_1,989,600_G_T 10 1,989,600 4.71E-05 A/D 0.42 FDR
IgT9 1 chr13_2,751,641_A_C 13 2,751,641 5.51E-05 A/D 0.40 FDR
IgT1 2 chr14_3,096,968_G_T 14 3,096,968 9.96E-06 A 0.25 FDR
IgT1 2 chr13_4,177,522_C_T 13 4,177,522 4.98E-05 A 0.22 FDR
IgT9 2 chr7_17,388,970_A_G 7 17,388,970 3.78E-05 A/D 0.23 FDR
IgT9 2 chr7_20,777,757_C_T 7 20,777,757 4.36E-05 D 0.27 FDR
IgT9 2 chr9_553,031_C_T 9 553,031 2.04E-05 A/D 0.27 FDR
IgT9 2 chr13_11,950,617_C_T 13 11,950,617 6.57E-05 A/D 0.23 FDR
SNPs significantly associated according to the Bonferroni Correction (BC) and False Discovery Rate (FDR). R2
: the proportion of phenotypic variance explained by the marker. Positions are referred to V1 annotation of the Vitis vinifera genome (http://www.genoscope.cns.fr)
Fig. 3 Circular Manhattan plot of association analysis between stomatal conductance (Ig) values and all SNP sites at time points T3 (aquamarin, violet), T4 (dark yellow, salmon), T5 (blue, orange), and T9 (azure, light blue) of first year experiment and time points T1 (dark green, pink) and T9 (green, yellow) of second year experiment. The red and black dots indicate respectively significant values according to the Bonferroni-corrected p-value and False Discovery Rate (FDR)
Table 4 List of candidate genes functionally annotated
Trait Year Candidate gene Description Chr Start Stop
IgT4 1 VIT_18s0001g15390 Peroxidase 18 13,521,135 13,522,636
IgT5 1 VIT_17s0000g08960 Raffinose synthase 17 10,494,444 10,498,141
IgT9 1 VIT_03s0091g00570 Transcription factor 3 6,998,808 6,999,512
IgT9 1 VIT_16s0098g00780 Iaa-amino acid hydrolase 16 21,120,452 21,126,524
IgT9 1 VIT_16s0098g00760 Transcription factor 16 21,111,871 21,115,426
IgT3 1 VIT_06s0009g01570 Serrate rna effector molecule 6 13,438,002 13,465,222
IgT3 1 VIT_11s0052g00570 Auxin-induced protein 5NG4-like 11 18,007,469 18,008,509
IgT3 1 VIT_13s0106g00790 Mevalonate diphosphate decarboxylase 13 10,642,954 10,652,636
IgT3 1 VIT_13s0019g03040 Glycosyltransferase 13 4,177,111 4,179,273
IgT4 1 VIT_05s0020g00540 β-xylosidase/α -arabinofuranosidase 5 2,435,691 2,438,632
IgT9 1 VIT_10s0003g00760 Glutamate receptor protein 10 1,992,263 1,998,191
IgT1 2 VIT_14s0128g00480 Eukaryotic translation initiation factor 3 subunit J 14 3,092,047 3,097,166
IgT9 2 VIT_09s0002g00810 Peroxisomal (S)-2-hydroxy-acid oxidase GLO4 9 547,420 552,404
polymorphisms did not show any significant deviation from neutrality neither in the whole dataset nor in the subsets of Rootstocks and Hybrids. The impact of non-synonymous substitutions on the biological function of the protein was predicted for all 69 mutations detected.
Seventeen showed a PROVEAN score below− 2.5, which
indicates a probable structural alteration of protein (Table S4). Additionally, some of these deleterious muta-tions occur in a significant proportion of the rootstock population.
Discussion
The genetic core collection of grape rootstocks
The existing grape germplasms are valuable genetic re-sources that could be examined for seeking phenotypic variations in drought tolerance mechanisms. Construct-ing a genetic core collection has proved to be an ad-equate strategy to obtain an optimal number of rootstock genotypes which captures all the most fre-quent alleles of a large germplasm, which is in agree-ment with previous studies [40, 42, 45]. Moreover, the Fig. 4 Comparison of transpiration rate between well-watered (WW) (in blue) and water stressed plants (WS) (in yellow) during the water stress experiment in the third year. Plants were divided for SNPs in the coding regions of VIT_17s0000g08960 and VIT_13s0019g03040. Asterisks denote significant differences according to Mann-Whitney U test between plants on the same time point and under the same treatment at p < 0.05
Table 5 Rootstocks classification based on response to drought
Genotype WS response class [22] SNP chr17_10,497,222_C_T
(CT overdominance effect)
SO4 (V. riparia x V. berlandieri) sensitive (1) / resistant (2) CT
101.14 (V. riparia x V. rupestris) sensitive (1,2) TT
110R (V. rupestris x V. berlandieri) highly resistant (1,2) TT
Riparia Glorie de Montpellier (V. riparia) very sensitive (1,2) CC
use of a genetic core collection for marker-trait asso-ciation studies was applied in several plant species with excellent results [42, 46–48]. Our results showed that a relatively few accessions were required to rep-resent the whole genetic diversity with the minimum redundancy, probably due to the high heterozygosity of Vitis species [49]. Similar outcomes have been re-ported in Malus [50], which exhibits high levels of heterozygosity as well, whereas more individuals were needed in M. truncatula [51] that is characterized by lower allelic heterozygosity.
A considerable level of genetic diversity within the core collection has been confirmed by the analysis with microsatellites and SNP markers and both proved to be highly informative. Conversely, the level of heterozygos-ity estimated by SNPs was substantially lower compared to that obtained with SSRs, as expected, since markers of bi-allelic nature have a lower discrimination power and detect a smaller proportion of rare alleles in a popu-lation [52,53]. The slight reduction of Ho in comparison with HE may be the result of inbreeding events on the
population under investigation, as noted in previous studies [40,54,55], and the low F values are also attrib-utable to the high heterozygosity of grapevine. Further-more, an overall reduction of genetic diversity has been observed within the Breeding Rootstocks pool compared to the Rootstocks/Wild and Hybrids panels, because they were obtained through a breeding selection based on few progenitors.
Regarding the genetic structure of the core collection, Hybrids were grouped clearly in a distinct cluster sepa-rated from Breeding Rootstocks and Rootstocks/Wild. This outcome was predictable because hybrids were ob-tained by crossing American Vitis species with cultivated grapevines carrying both phylloxera resistance and a sig-nificant percentage of V. vinifera in their pedigree [56].
Phenotyping of drought stress response
Grapevine WUE under droughts is strongly influenced by plant transpiration rate, which can be, therefore, con-sidered a potential target for its improvement [57]. Ther-mal infrared imaging was confirmed as a very suitable tool for the estimation of stomatal conductance and to study the genotypic variability related to transpiration.
During the three experimental years, rootstocks
exhibited significantly higher canopy temperatures in comparison with their controls when subjected to water stress, reflecting their water status. Moreover, it was demonstrated that Ig and CWSI parameters, deduced from thermal images, were significantly correlated with water stress indicators, such as leaf water potential (ΨL), non-photochemical quenching (NPQ) or efficiency of light use by the photosystem II (PSII) [58]. The timing of measurements is critical to ensure satisfying pheno-typing results and this approach allowed a fast assess-ment of the transpiration rate in the whole rootstock population (600 vines) in the same day and during a spe-cific time window to limit environmental influence, which would have been impossible with a porometer. In fact, since the initial development of the thermography method by Blum et al. [59], water status of different kind of crops has been widely studied with excellent results in diverse research works, including grapevine [38,39,60– 62]. This experiment demonstrated the effectiveness of thermal imaging in detecting genome wide-associations overall. Moreover, the analysis of drought response on a subset of the population using direct stomatal conduct-ance measurements proved the consistency of these out-comes. Nevertheless, it is essential to investigate other morphological characteristics, such as vegetative devel-opment or root architecture, and evaluate physiological aspects of rootstock-scion interaction in both pot and field experiments, in order to acquire a full knowledge of the plant physiological response.
Genome-wide association analysis
GWAS studies are currently a valuable approach to understand the genetic basis of complex traits [63], par-ticularly for those with polygenic inheritance, such as drought tolerance, although these analyses are not widely carried out in grapevine [32–34, 64–66]. Accord-ing to Nicolas et al. [43] the ideal association panel for GWAS in grapevine should combine limited relatedness with minimal structure. The panel designed for this study was composed by hybrids, wild non-vinifera acces-sions and rootstock varieties (Table S1) that included in their pedigree the main American Vitis species, such as V. riparia, V. berlandieri and V. rupestris. Therefore, it ensures a large genetic variability and, additionally, ex-hibits unexplored variations for biotic and abiotic (See figure on previous page.)
Fig. 5 Physiological conditions of rootstocks during water stress experiment. Volumetric soil water content evaluated throughout the progression of the drought stress experiment of water stress group (a) and of control group (b). Values represent average measurements ± SE of twelve replicates (WS) and six replicates (WW). Data were analysed using one-way ANOVA with LSD post-hoc test, and letters indicate significant differences between genotypes on the same day at p < 0.05. Stomatal conductance of water stressed (WS) and well watered (WW) 101.14Mgt (c), 110R (d), RGM (e) and SO4 (f) throughout the experiment. Values represent average measurements ± SE, n = 12 (WW) and n = 24 (WS). Significant differences between treatments on the same day were tested with Mann-Whitney U test, and asterisks indicate significantly different values at p≤ 0.05 (*), p ≤ 0.01 (**), and p ≤ 0.001 (***). DOE, days of experiment
stresses resilience [67, 68]. However, GWAS analysis identified only five SNPs which passed the Bonferroni significance threshold associated with the studied pheno-typic traits. On the other hand, nineteen marker-trait as-sociations were detected using FDR’s less conservative approach. The decrease of statistical power could be caused by the rapid decay of LD in grape [43, 66, 69]
that might require a large number of SNPs to evenly cover the genomic region. The GrapeReseq 20 K SNPs array proved to be an adequate tool to detect significant genotype-phenotype associations in this study. This chip includes probes targeting variations discovered within 47 wild and cultivated genotypes of V. vinifera, but also 4978 SNPs identified in 18 accessions of other six Vitis Fig. 6 Relative expression of the 5 candidate genes assayed by quantitative real-time RT-PCR analyses in the leaves of 101.14Mgt (red), 110R (blue), RGM (green) and SO4 (yellow) sampled throughout the drought stress experiment. The y-axis indicates the folds of gene expression relative to the first day (day 0). Data are presented as means ± standard errors of three biological and two technical replicates. Data were analysed using one-way ANOVA with LSD post-hoc test, and letters indicate significant differences between days of experiment at p < 0.05. DOE, days of experiment
species. Therefore, it was appropriate for genotyping the core collection, which contains several different Vitis ge-notypes. Moreover, the SNP markers on array were se-lected based on their level of heterozygosity and evenly distributed along chromosomes. This array, in fact, has allowed detection of QTLs for vegetative and reproduct-ive traits [Houel et al. 2015] and a great estimation of genetic diversity in grapevine germplasms [33, 53, 64]. On the other hand, a greater number of SNP markers could have been obtained through either the Restriction-site associated DNA sequencing (RADSeq) or the Geno-typing by Sequencing (GBS) approach. Maximizing the number of SNPs may indeed increase the likelihood of finding significant associations with the phenotype. However, this strategy requires a more accurate filtering of the SNPs discovered and needs to be previously opti-mized for the different genotypes under investigation. In the present study the plants under investigation are ei-ther hybrids or accessions from different Vitis species and it is possible that they may differ in terms of the presence of restriction enzymes sites in highly repetitive DNA regions. Furthermore, drought tolerance is a trait with a complex polygenic determinism and with a strong environmental interaction and, hence, a marker-trait as-sociation analysis will probably require highly precise phenotypic data, and an experimental panel including more individuals and replicates, in order to detect minor effect QTLs.
The prominent role of rootstocks in regulating scion stomatal conductance under water deficit has been dem-onstrated in different studies [25, 26, 70, 71], although the genetic determinism involved in the stomatal regula-tion has been scarcely investigated. Marguerit et al. [24] identified, through a QTL analysis, genetic regions in rootstocks linked to the transpiration control of scions by evaluating drought response of a single scion geno-type grafted on 138 individuals from a V. vinifera cv.
Cabernet Sauvignon × V. riparia cv. Gloire cross. Later, Coupel-Ledru et al. [31] dissected the genetic basis of stomatal sensitivity between iso- and aniso-hydric grape-vines in a progeny (Vitis vinifera L. cvs. Grenache × Syrah) again with a QTL approach. So far, these remain the only studies focused on identifying the genetic re-gions responsible for stomatal control under water stress.
The association mapping approach adopted in this study detected significant genotype- phenotype associa-tions during the various stages of drought stress of the experiment. GWAS results of the second year, however, were not consistent with those obtained during the first year. This fact highlights the need to cope with chal-lenges of plant phenotyping for drought tolerance, which may be influenced by multiple abiotic stress conditions, such as excessive heat [35, 72]. Indeed, despite the periments were conducted in a tunnel- greenhouse, ex-ternal conditions were slightly different likely having an impact on inside temperature. Differences were also no-ticed regarding the transpiration response. Environmen-tal conditions reduced the stomaEnvironmen-tal conductance of control plants in the first year and water-stressed plants exhibited a transpiration rate close to zero at 30% of FC, showing only a partial recovering after rehydration. Nevertheless, phenotypic data collected in a third year on a subset of the population with a porometer, which measures more accurately the stomatal conductance, confirmed some of the associations.
Previous genetic studies of the grapevine transpiration
under drought [24, 31] reported a comprehensive
characterization of the population over the course of the water treatment, even though the low density of markers limited the resolution of QTL confidence intervals, which included large chromosomic regions. However, the large amount of significantly associated SNPs identi-fied in this study co-localized in those QTL regions,
Table 6 Summary statistics of VIT_17s0000g08960 protein coding region sequencing in the grape rootstocks population
Parameters N Synonymous changes Non-synonymous changes
Vitis accessions 85
Full-ORF cDNA 2343 bp
Predicted protein 780 aa
Exons 4
Introns 3
Number of polymorphic sites 135
SNPs 134 65 69
INDELS 1
Nucleotide diversity (π) 0,007 0,015 0,005
even indicating more restricted positions. Therefore, the application of an integrated strategy combining QTL mapping and GWAS analysis seems a valid approach to dissect complex traits, such as drought stress response.
Potential candidate genes for drought tolerance
The significantly associated SNP chr17_10,497,222_C_T (p < 0.0001) was identified under severe water deficit conditions in the first year experiment. Moreover, other association signals for the same marker, which did not exhibit significant p-values after multiple testing correc-tions, were found in the first year (at 50% of FC) and in the second year (at recovery stage). Additionally, the as-sociation of the SNP with a different rate of transpir-ation under drought was validated in a small group of rootstock varieties in a third year experiment. Indeed, genotypes with heterozygous SNP (CT) exhibited a sig-nificant reduction of stomatal conductance compared with genotypes carrying homozygous SNP (CC or TT) at 50% of FC. The SNP chr17_10,497,222_C_T is located in the coding region of VIT_17s0000g08960, which codes for a raffinose synthase. The raffinose family of oligosac-charides (RFOs) has a fundamental role in protecting plants against abiotic stresses [73]. These proteins confer tolerance against drought stress acting as signaling com-pounds through the phloem, and as storage of additional energy resources. In addition, they have a ROS scaven-ging function and stabilize cellular membranes and photosynthetic apparatus. The accumulation of these carbohydrates also improved the water stress tolerance in several plants, such as Arabidopsis thaliana [74–76], Medicago sativa [77], Xerophyta viscosa [78], Zea mays [79], Coffea [80] and Malus domestica [81]. Grapevines subjected to drought generally show an overall reduction of sugars [82], probably due to a decreased carbon fix-ation, except for galactinol and raffinose, which accumu-late upon water deficit conditions [17], suggesting, therefore, that their biosynthesis is strictly related to stress. Furthermore, the concentration of osmolytes like raffinose in guard cells has a role in the regulation of stomata aperture [83, 84]. The involvement of VIT_ 17s0000g08960in drought response mechanisms, includ-ing ABA-mediated signallinclud-ing, is confirmed by
transcrip-tomic studies in grapevine. It was differentially
modulated in leaves of isohydric and anisohydric var-ieties under water deficit conditions [85] and it was up regulated in Merlot grapevine leaves subjected to drought [17], in transgenic grape cells overexpressing VvABF2 [86] and in berries after ABA treatment [87]. Phylogenetic analysis of the protein codified by VIT_ 17s0000g08960 has also demonstrated that it is closely related to stress-inducible protein raffinose synthase 5 (RS5) of Arabidopsis, that has proved to be the solely re-sponsible for raffinose accumulation in leaves under
water stress [88]. The role of VIT_17s0000g08960 in drought stress response was also supported by the in silico analysis of its promoter, which exhibited a consist-ent enrichmconsist-ent for major ABA-responsive elemconsist-ents (ABRE) and dehydration-responsive element binding (DREB) motifs (ACGTG, RYACGTGGYR, YACGTGGC,
ACGTGKC, ACCGAC) [89–93]. Accordingly, the VIT_
17s0000g08960 coding region has been sequenced in 85 rootstock genotypes in order to detect a potential causa-tive variant. Its nucleotide diversity (π = 0,007) is higher than the average values observed in grapevine gene re-gions reported in literature (π = 0,0040-0,0051) [42, 94– 96], which is consistent to the complex nature of the highly diverse association panel that includes different Vitis species and hybrids and thereby presenting a large genetic variability. Interspecific hybrids, which all in-clude V. vinifera in their pedigrees, showed a lower fre-quency of polymorphic sites compared with other rootstock genotypes. On the other hand, if mutations in the non-coding portions of the genome are considered, the genetic diversity in grapevine is substantially higher both in wild and cultivated varieties ranging fromπ = 0, 015 and π = 0,014, respectively [97]. Despite a recently published whole-genome resequencing of 472 Vitis ac-cessions revised downwards these estimates, nucleotide diversity values ofπ = 0,0035 for wild and π = 0,0055 for domesticated cultivars were reported [49]. Unfortu-nately, none of the non-synonymous changes of VIT_
17s0000g08960 coding region proved to be in LD with
the associated variant identified in GWAS. Thus, the pu-tative causative mutation in LD with the significant syn-onymous SNP could be located in genomic regions that have not been sequenced; cis-regulatory sequences can be localized in intragenic (introns) or intergenic (pro-moter and enhancer) regions closely surrounding the gene and need to be further investigated.
In the GWAS experiment SNP chr17_10,497,222_C_T was significantly associated with stomatal closure in drought stress conditions with an overdominance effect, heterozygous (CT) genotypes showed lower stomatal conductance in comparison with homozygous genotypes (CC or TT). In this respect, commercial rootstocks (rep-resentative of the three genotypic classes) were deeply characterized under drought in a pot stress experiment. Interestingly, as soil water content decreased SO4 vines proved to be the more able to preserve soil moisture. In accordance with our results, Tramontini et al. [25] re-ported that different grapevine genotypes grafted on SO4, grown under water-limiting conditions in small pots, preserved the soil water in a more efficient way compared with the same varieties grafted on high toler-ant rootstock, 140 Ruggeri. The analysis of the VIT_ 17s0000g08960 transcripts during water deficit revealed that this gene was modulated only in SO4 vines. A
significantly higher expression was detected after four days, when plants start to perceive the symptoms of stress, indicating that it might be implicated in early re-sponse to drought stress. Therefore, the potential causa-tive mutation could have a role in the transcriptional regulation.
Among the other significantly associated markers, SNP chr18_13,519,938_C_T is positioned within the pro-moter region of another drought responsive gene, VIT_ 18s0001g15390, which encodes a peroxidase protein. Peroxidases are antioxidant enzymes that prevent exces-sive damages caused by ROS accumulation and their concentrations are highly modulated under abiotic stresses [98, 99]. Moreover, its expression profile during drought was characterized by a progressive increase of transcripts throughout the experiment in all the four rootstocks genotypes, which supports a prominent role in the stress response. The other three statistically sig-nificant polymorphisms after Bonferroni adjustment,
chr3_7,009,222_A_G, chr16_21,122,534_A_G and
chr13_11,950,617_C_T, map near a TF involved in tran-scription initiation, in the intronic region of an iaa-amino acid hydrolase and in a non-annotated gene pre-diction, respectively. Since these genes could not be con-sidered directly related to water stress response, surrounding genomic regions were scanned without finding credible candidate genes. However, these regions would deserve much more in-depth analysis because candidate gene approach could be limiting and may ex-clude non-coding regions actually associated with the phenotype (promoters, enhancers, silencers, etc.) [100]. The Bonferroni correction test is the most applied for assessing the threshold value of associations. Nonethe-less, it is often too conservative and some signals may not pass its stringent criteria. Thus, SNPs suggested based on FDR were also considered to detect other marker-trait association. All the identified markers were found only during one stage of stress, except chr13_4, 177,522_C_T. This SNP, located in the coding region of a glucosyltransferase protein (VIT_13s0019g03040), was found significant under both moderate water deficit and well-watered condition. Several recent studies in model plant species also suggest the involvement of glycosyl-transferases in abiotic stress adaptation [101–103].
Fur-thermore, we observed that VIT_13s0019g03040
expression increases along drought experiment in the studied rootstock varieties, so it might play a key role in drought response mechanisms. Lastly, marker chr13_10, 652,062_A_G was found associated in plants under moderate drought stress and it is positioned in the cod-ing region of mevalonate diphosphate decarboxylase (MVD) (VIT_13s0106g00790). This is a limiting enzyme of mevalonate isoprenoid pathway [104] responsible for the formation of sterols, which play an essential role in
maintaining membranes structure and in preventing oxi-dative stress damages [105].
Conclusions
Understanding the genetic basis of grapevine drought stress response is crucial in the management of vine-yards and in the breeding of new varieties in a changing climate. In the present research, some genetic regions related to the control of transpiration potentially in-volved in drought resilience and relevant for crop im-provement were detected with a GWAS approach. The application of infrared thermography allowed evaluating the grapevine rootstocks response to water deficit redu-cing the time for collecting phenotypic data, and, thus, allowing the screening of numerous genotypes. Signifi-cant marker-trait associations were detected, despite the complexity of the trait under investigation and its poly-genic inheritance. Additional studies on commercial rootstocks enabled us to point out several candidate genes (VIT_13s0019g03040, VIT_17s0000g08960, VIT_ 18s0001g15390) presumably implicated in response to water deficit, providing valuable information on import-ant tolerance traits. These results highlighted a relevimport-ant role of a raffinose synthase, belonging to a family of oli-gosaccharides well known for protecting plants against abiotic stresses.
Methods
Plant material and construction of genetic core collection
The association population consisted of one hundred non-vinifera genotypes (Vitis spp.) representing the gen-etic diversity of two more extensive germplasm
collec-tions maintained by Fondazione Edmund Mach
(ITA362) [40] and University of Milan (ITA427). The material consisted of interspecific hybrids used for fruit production (Hybrids), rootstock varieties including wild non-vinifera Vitis species (Rootstocks/Wild) and root-stocks selected in a breeding program (Rootroot-stocks Breeding). The MSTRAT software, which implements The Maximization (M) method [106, 107], was applied to construct this core collection, by performing 200 iter-ations per MSTRAT run and 100 repetitions for core sampling. Putative core collections with equal allelic richness were ordered according to Nei’s diversity index [108]. The final core collection included the accessions that were more frequent in the 100 replicates.
SNP genotyping, genetic diversity and genetic structure of the population
DNA was isolated from leaves of rootstock genotypes with the DNeasy® Plant Mini Kit (QIAGEN, Hilden, Germany). DNA quality was assessed using both agarose
spectrophotometer (NanoDrop Technologies, Wilming-ton, DE, USA).
The commercial GrapeReseq 20 K SNPs array was used to genotype the core collection with the Infinium technology following the manufacturer’s instructions (Illumina, Inc., San Diego, CA, USA). The raw SNP data generated were scored and filtered according to Marrano et al. [34].
Genetic variability within and among groups was mea-sured both for SSR and SNP loci. The mean number of alleles per locus (A), the number of effective alleles (AE,
[109]), levels of observed (HO) and expected (HE)
het-erozygosity [110] and the fixation index (F, inbreeding coefficient [111]) were calculated using GenAlex 6.502 [112].
The genetic structure of the association population was analyzed with STRUCTURE software v2.3.2 [113], which uses a variational Bayesian framework for ap-proximate inference of subpopulations [114]. Ten inde-pendent runs for K values ranging from 1 to 7 were performed with the following parameters set (burn-in length/iterations) 500,000/750,000 and 10,000/100,000 for SSR and SNP data, respectively. The admixture model was applied with no prior population information. Estimation of the most probable K value was obtained running the algorithm for multiple choices of K and visualizing the marginal likelihood and ΔK [41] of the data over ten runs using STRUCTURE HARVESTER [115]. The optimal alignment of runs was analyzed with CLUMPP v1.1.2 [116]. Final results were visualized with the software DISTRUCT v1.1 [117].
A Discriminant Analysis of Principal Components (DAPC) [118] was performed to identify genetic clusters using the package adegenet of R software. The number of axes considered in the Principal Component Analysis (PCA) was determined with cross-validation (CV) func-tion implemented in poppr package of R software [119].
Water stress experiment conditions
Six replicates of each grape genotype included in the as-sociation mapping panel were grown in a 5-L pot filled with a substrate composed of sandy loam soil and peat (4:1 in volume) under partially controlled climate condi-tions. Soil water content (SWC) was determined by the gravimetric method, from the difference in weight be-tween the wet and the dry soil [120]. Two irrigation treatments were established. Three replicates were irri-gated maintaining the 90% of SWC (well-watered plants, WW) and 3 replicates (water stressed plants, WS) were subjected to a gradual drought stress: a moderate stable water deficit (5o% of SWC for 7 days), followed by a se-vere stable water deficit (30% of SWC for 7 days) and a recovery period (90% for 5 days). This experiment was
repeated for three years: 2012 (1° year), 2013 (2° year) and for a subset population in 2014 (3° year).
One-year-old potted (9 L) rooted cuttings of three se-lected rootstock varieties (101.14, SO4, RGM) were fur-ther grown and evaluated in a tunnel- greenhouse. Twelve replicates of each rootstock genotype were sub-jected to water stress by completely suspending
irriga-tion for 15 days (WS), while 6 replicates were
maintained at about 90% of maximum water availability (WW). The growing medium was composed of a sand-peat mixture (1:1 in volume) with a field capacity of 35% [(vol water/vol soil) × 100]. The volumetric soil moisture content per pot was monitored with a ML3 ThetaProbe Soil Moisture Sensor (Delta-T Devices, London, UK). The pot surface was covered with a plastic film to avoid soil water evaporation. The experimental plan was com-pletely randomized.
Thermal indices and stomatal conductance estimation
The physiological response to drought was evaluated over 30 days. To evaluate the effect of water stress ther-mal images of the grape leaf canopies were elaborated using the software InfReC Analyzer (NS9500LT) (Nip-pon Avionics Co., Yokohama, Japan). Stomatal conduct-ance was estimated from two different thermal indices: crop water stress index (CSWI) (Eq. 1) [121] and ther-mal index (Ig) (Eq.2) [122].
CWSI¼Tcanopy− Twet
Tdry− Twet ð1Þ
IG¼Tdry− Tcanopy
Tcanopy− Twet ð2Þ
where Tcanopy (°C) was the temperature deduced from
the thermal images of six sun-exposed mature leaves per vine, Tdry (°C) and Twet (°C) were the temperatures
de-tected on the cardboard “reference surfaces”. Stomatal conductance (gs) and transpiration were measured with
a steady state porometer (Licor Li-1600) in the third ex-perimental year.
GWAS analysis
Genotype-phenotype associations were tested consider-ing the average value of each trait for each year separ-ately. When phenotype scores were not normally distributed they were transformed using the logarithm function. Three different models were tested using TASSEL v.5.2 [123]. The first model applied was the General Linear Model (GLM), which considers the population structure calculated with principal compo-nent analysis (PCA) as a cofactor. The following matrix notation describes the GLM model:
where yi is the phenotypic value of ithsample, μ is the
model intercept,β is a vector of SNP effects, ν is a vector of population effect and ε is a vector of residual effects, Q is the matrix from STRUCTURE that considers the individual probabilities to be associated to a subpopula-tion. The second model employed was the Mixed Linear model (MLM), which extends eq. (3) taking also into ac-count a kinship matrix (K) to estimate the degree of gen-etic covariance between pairs of individuals [124]. The method of Endelman and Jannink [125] was applied to determine a centered identical-by-state K. The third model (Q + K model) including both a fixed effect as the population structure matrix (Q) and a random effect as the kinship matrix (K). The marker trait association was evaluated by plotting quantile-quantile (Q-Q) plot. P-values adjustment for multiple testing was adopted: in addition to the Bonferroni-corrected critical p-values, q-values were also calculated based on their corresponding p-values to identify significant associations between a trait and the SNPs. The q-value is a measure of signifi-cance in terms of False Discovery Rate (FDR) [126] that limits the false positive results while offering a more lib-eral criterion than Bonferroni correction factor. A q value of 0.1 was used as significant association threshold
[127]. GWAS results were visualized with Manhattan
plots that were yielded from the qqman and CMplot packages of R software [128]. Genomic regions closest to the markers significantly associated with phenotypes were explored to identify candidate genes. Taking into account the extent of Linkage Disequilibrium (LD), a win-dow of 10 kb upstream and win-downstream from associated loci was considered on the grape genome assembly v.2.1, hosted onhttp://genomes.cribi.unipd.it/grape[129].
VIT_17s0000g08960 gene resequencing and genetic variation analysis
Gene-specific primers were designed using Primer 3 software [130] based on the genomic sequence of V. vi-nifera gene annotation v2.1. An assembled contiguous sequence of 3678 bp of the VIT_17s0000g08960 locus was resequenced with primers listed in Table S5 accord-ing to methods previously described [131].
The estimation and frequency of polymorphisms were defined using the DnaSP software [132], based on the SNPs and INDELs detected in VIT_17s0000g08960
cod-ing region. Nucleotide diversity was estimated as π
[133]. The neutral mutation parameterθ [134] was esti-mated from the total amount of mutations. The hypoth-esis of neutral polymorphisms was tested using Tajima’s D [135] and Fu and Li’s D [136] tests. Prediction of tol-erability of amino acid substitution at all positions was calculated with the software tool PROVEAN (Protein Variation Effect Analyzer) [137].
Real-time qPCR
Total RNA was isolated from grape leaves using the Spectrum™ Plant Total RNA Kit (Sigma Aldrich, St. Louis, MO, USA). DNase treatment was performed using the Dnase I (Qiagen, Valencia, CA, USA) during the RNA ex-traction. RNA samples were quantified with the spectropho-tometer NanoDrop ND-8000 (NanoDrop Technologies, Wilmington, DE, USA) and their integrity was checked by agarose gel electrophoresis. cDNA was synthesized with the SuperScript® III Reverse Transcriptase (Invitrogen, Carlsbad, CA, USA). Analysis of candidate genes expression was carried out using LightCycler® instrument and the re-lated LightCycler® software (Roche Diagnostics, Basel, Switzerland). All Real-Time PCR reactions were per-formed using LightCycler® 480 SYBR Green I Master Mix (Roche Diagnostics, Basel, Switzerland) in 20μl reactions according to to manufacturer’s instructions by using primers listed in Table S6. Three independ-ent biological replicates for each time point were ana-lyzed. Gene expression levels were assessed with qbasePLUS software (Biogazelle, Zwijnaarde, Belgium [138]) and normalized by the reference genes Actin and Glyceraldehyde-3-phosphate dehydrogenase.
Statistical analyses
Statistical analyses were performed using R packages ‘stats’, ‘agricolae’ and ‘companion’ v3.5.1 (R Core Team, 2013). Different tests were applied for mean compari-sons. Parametric Student’s t-test or one-way ANOVA were used to compare normally distributed data with equal variances. Non-parametric Mann-Whitney U test and one-way Kruskal–Wallis test were applied when the assumptions of normality or homogeneity of variances were violated.
Supplementary Information
The online version contains supplementary material available athttps://doi. org/10.1186/s12870-020-02739-z. Additional file 1. Additional file 2. Additional file 3. Additional file 4. Additional file 5. Additional file 6. Additional file 7. Additional file 8. Additional file 9. Abbreviations
GWAS:Genome-wide association study; WUE: Water-use efficiency; NIR: Near infrared; MAF: Minor allele frequency; SSR: Simple sequence repeat; SNP: Single-nucleotide polymorphism; CSWI: Crop water stress index; WS: Water stress; FDR: False discovery rate; LD: Linkage disequilibrium; 110R: 110 Richter; SO4: Selection Oppenheim 4; RGM: Riparia Gloire de Montpellier; 101.14: 101.14 Millardet et de Grasset; WW: Well-watered;
NPQ: Non-photochemical quenching; QTL: Quantitative trait locus; FC: Field capacity; RFO: Raffinose family of oligosaccharides; ABA: Abscisic acid; ABRE: ABA-responsive elements; DREB: Dehydration-responsive element binding; MVD: Mevalonate diphosphate decarboxylase; DAPC: Discriminant analysis of principal components; SWC: Soil water content; GLM: General linear model; MLM: Mixed linear model
Acknowledgements
The authors thank Prof. Giovanni Battista Tornielli and Prof. Anita Zamboni (University of Verona) for their helpful discussions and suggestions, Dr. Paula Moreno-Sanz for her critically reading of the manuscript and the language revision, and Prof. Attilio Scienza (University of Milano) for his support. F.E. and MT wish to acknowledge the support of grants from AGER SERRES (Project N. 2010–2105) and WINEGRAFT.
Authors’ contributions
FE and MSG conceived and designed the research work; MSG acquired the financial support and supervised the research activity; MT, FE, SL, PLB, DG and OF took part in the experimental work; MT and FE performed the statistical analyses and were involved in data interpretation; MT wrote the manuscript. All the authors reviewed, edited and approved the final version of the manuscript.
Funding
This work was jointly funded by CAVIT s.c. (Trento) and Fondazione Edmund Mach (San Michele all’Adige, Trento). The funding body had no role in the design of the study and collection, analysis, and interpretation of data and in writing the manuscript.
Availability of data and materials
All data generated during this study are included within the article and in its supplementary information files or are available from the corresponding author on reasonable request. Nucleotide sequences of VIT_17s0000g08960 can be found in the GenBank data libraries under the accession numbers: MW066760, MW066761, MW066762, MW066763, MW066764, MW066765, MW066766, MW066767, MW066768, MW066769, MW066770, MW066771, MW066772, MW066773, MW066774, MW066775, MW066776, MW066777, MW066778, MW066779, MW066780, MW066781, MW066782, MW066783, MW066784, MW066785, MW066786, MW066787, MW066788, MW066789, MW066790, MW066791, MW066792, MW066793, MW066794, MW066795, MW066796, MW066797, MW066798, MW066799, MW066800, MW066801, MW066802, MW066803, MW066804, MW066805, MW066806, MW066807, MW066808, MW066809, MW066810, MW066811, MW066812, MW066813, MW066814, MW066815, MW066816, MW066817, MW066818, MW066819, MW066820, MW066821, MW066822, MW066823, MW066824, MW066825, MW066826, MW066827, MW066828, MW066829, MW066830, MW066831, MW066832, MW066833, MW066834, MW066835, MW066836, MW066837, MW066838, MW066839, MW066840, MW066841, MW066842, MW066843, MW066844.
Ethics approval and consent to participate Not applicable.
Consent for publication Not applicable.
Competing interests
The authors declare that they have no competing interests. Author details
1Research and Innovation Centre, Fondazione Edmund Mach, via E. Mach 1,
38010 San Michele all’Adige, Italy.2Technology Transfer Centre, Fondazione
Edmund Mach, via E. Mach 1, 38010 San Michele all’Adige, Italy.3Department of Agricultural and Environmental Sciences, University of Milano, via Celoria 2, 20133 Milan, Italy.4Center Agriculture Food Environment (C3A), University
of Trento, via E. Mach 1, 38010 San Michele all’Adige, Italy.
Received: 1 April 2020 Accepted: 16 November 2020
References
1. IPCC (2018). Global warming of 1.5°C, an IPCC special report on the impacts of global warming of 1.5°C above pre-industrial levels and related global greenhouse gas emission pathways, in the context of strengthening the global response to the threat of climate change, sustainable development, and efforts to eradicate poverty. Summary for policy makers, available online at:http://report.ipcc.ch/sr15/pdf/sr15_spm_final.pdf. Accessed 17 Oct 2019.
2. Tollefson J. Clock ticking on climate action. Nature. 2018;562:172–3. 3. Boyer JS, Byrne P, Cassman KG, Cooper M, Delmer D, Greene T, Gruis F,
Habben J, Hausmann N, Kenny N, Lafitte R, Paszkiewicz S, Porter D, Schlegel A, Schussler J, Setter T, Shanahan J, Sharp RE, Vyn TJ, Warner D, Gaffney J. The U.S. drought of 2012 in perspective: a call to action. Glob Food Secur. 2013;2:139–43.
4. Hannah L, Roehrdanz PR, Ikegami M, Shepard AV, Shaw MR, Tabor G, Zhi L, Marquet PA, Hijmans RJ. Climate change, wine, and conservation. Proc Natl Acad Sci U S A. 2013;110:6907–12.
5. Van Leeuwen C, Schultz HR, Garcia de Cortazar-Atauri I, Duchene E, Ollat N, Pieri P, Bois B, Goutouly JP, Quenol H, Touzard JM, Malheiro A, Bavarescok L, Delrot S. Why climate change will not dramatically decrease viticultural suitability in main wine-producing areas by. Proc Natl Acad Sci U S A. 2013; 110:3051–2.
6. Mosedale JR, Wilson RJ, Maclean IMD. Climate change and crop exposure to adverse weather: changes to frost risk and grapevine flowering conditions. PLoS One. 2015;10:e0141218.
7. Charrier G, Delzon S, Domec JC, Zhang L, Delmas CEL, Merlin I, Corso D, King A, Ojeda H, Ollat N, Prieto JA, Scholach H, Skinner P, van Leeuwen C, Gambetta GA. Drought will not leave your glass empty: Low risk of hydraulic failure revealed by long-term drought observations in world’s top wine regions. Sci Adv. 2018;4:eaao6969.
8. Dos Santos TP, Lopes CM, Rodrigues ML, de Souza CR, Maroco JP, Pereira JS, Silva JR, Chaves MM. Partial rootzone drying: effects on growth and fruit quality of field grown grapevines. Funct Plant Biol. 2003;30:663–71. 9. Savoi S, Wong DCJ, Arapitsas P, Miculan M, Bucchetti B, Peterlunger E, Fait
A, Mattivi F, Castellarin SD. Transcriptome and metabolite profiling reveals that prolonged drought modulates the phenylpropanoid and terpenoid pathway in white grapes (Vitis vinifera L.). BMC Plant Biol. 2016;16:67. 10. Kissoudis C, van de Wiel C, Visser RGF, Van Der Linden G. Enhancing crop
resilience to combined abiotic and biotic stress through the dissection of physiological and molecular crosstalk. Front Plant Sci. 2014;5:207. 11. Simonneau T, Lebon E, Coupel-Ledru A, Marguerit E, Rossdeutsch L, Ollat N.
Adapting plant material to face water stress in vineyards: which physiological targets for an optimal control of plant water status ? OENO One. 2017;51:2.
12. Chaves MM, Oliveira MM. Mechanisms underlying plant resilience to water deficits: prospects for water-saving agriculture. J Exp Bot. 2004;55:2365–84. 13. Hochberg U, Windt CW, Ponomarenko A, Zhang Y-J, Gersony J, Rockwell FE,
Holbrook NM. Stomatal closure, basal leaf embolism, and shedding protect the hydraulic integrity of grape stems. Plant Physiol. 2017;174:764–75. 14. Lovisolo C, Hartung W, Schubert A. Whole-plant hydraulic conductance and
root-to-shoot flow of abscisic acid are independently affected by water stress in grapevines. Funct Plant Biol. 2002;29:1349–56.
15. Pillet J, Egert A, Pieri P, Lecourieux F, Kappel C, Charon J, Gomès E, Keller F, Delrot S, Lecourieux D. VvGOLS1 and VvHsfA2 are involved in the heat stress responses in grapevine berries. Plant Cell Physiol. 2012;53:1776–92. 16. Carvalho LC, Vidigal P, Amâncio S. Oxidative stress homeostasis in grapevine
(Vitis vinifera L.). front. Environ Sci. 2015;3:20.
17. Degu A, Hochberg U, Wong DCJ, Alberti G, Lazarovitch N, Peterlunger E, Castellarin SD, Herrera JC, Fait A. Swift metabolite changes and leaf shedding are milestones in the acclimation process of grapevine under prolonged water stress. BMC Plant Biol. 2019;19:69.
18. Conde A, Regalado A, Rodrigues D, Costa JM, Blumwald E, Chaves MM, Gerós H. Polyols in grape berry: transport and metabolic adjustments as a physiological strategy for water-deficit stress tolerance in grapevine. J Exp Bot. 2015;66:889–906.
19. Vandeleur RK, Mayo G, Shelden MC, Gilliham M, Kaiser BN, Tyerman SD. The role of plasma membrane intrinsic protein aquaporins in water transport through roots: diurnal and drought stress responses reveal different