Characterisation of authentic Italian extra-virgin olive oils by stable isotope ratios of C, O and H and mineral composition
Federica Camin*, Roberto Larcher, Matteo Perini, Luana Bontempo, Daniela Bertoldi, Giacomo Gagliano†, Giorgio Nicolini, Giuseppe Versini
IASMA Research Centre, Agrifood Quality Department, Via E. Mach, 1 – 38010 San Michele all’Adige (TN) – Italy
†
Ministero delle Politiche Agricole, Alimentari e Forestali – Ispettorato Centrale per il Controllo della Qualità dei prodotto agro-alimentari (ICQ), Direzione generale tecnica – Ufficio IV/T, Via del Fornetto, 85 – 00149 Roma – Italy
*[email protected] , fax: 0039 0461 615288
Keywords: olive oil; glycerol; IRMS; ICP-MS; PDO. Abstract
The paper shows the isotopic ratios (13C/12C, D/H, 18O/16O) in oil and extracted glycerol and the mineral composition of authentic PDO and PGI Italian extra-virgin olive oils, officially collected from 2000 to 2005 (N = 539) to establish a national databank. 13C/12C and 18O/16O increased from Trentino to Sicily, each year distinguishing Northern Italy from Sicily and Calabria. Significant differences were found among the years and in some cases also between PDOs from the same region. 13C/12C and 18O/16O in bulk oil were significantly correlated with those in glycerol. D/H, measured in 2005 for the first time in oil, showed promising geographical discrimination capability. The content of 26 elements - Li, Rb, Cs, La, Ce and Yb rarely reported in the literature -was measured in well settled 2005 oils after ultrasound acid extraction.
1. Introduction
1 2
Olive oil is one of the most important commodities produced in Italy, which is the second 3
largest producer in the world (630,000 tons in 2006-2007) and the largest consumer (International 4
Olive Oil Council, http://www.internationaloliveoil.org). European law (EEC Reg. No. 2568/91) 5
provides producers with the opportunity of indicating the geographical origin of extra-virgin olive 6
oil using the Protected Denomination of Origin (PDO) or the Protected Geographic Indication 7
(PGI), but it does not indicate specific analytical methods to check the authenticity of these 8
indications. 9
In the last few years attention has been focused on authentication of the geographical origin 10
of olive oil using in particular the profiles of volatile compounds (Vichi, Pizzale, Conte, Buxaderas 11
& Lopez-Tamames, 2007), sterols (Alves, Cunha, Amaral, Pereira & Oliveira, 2005) or free fatty 12
acids (D’Imperio, Dugo, Alfa, Mannina & Segre, 2007), Nuclear Magnetic Resonance 13
fingerprinting (Rezzi, Axelson, Heberger, Reniero, Mariani & Guillou, 2005) and also stable 14
isotope ratios and mineral content. Moreover, because of its financial importance and role in the 15
Mediterranean diet, olive oil has been investigated for other purposes, such as the identification of 16
defects (e.g. rancid taste, presence of vegetable water or muddy sediment), pollutants (e.g. 17
pesticides or metals) or fraud (e.g. mixing with hazelnut oil) using various analytical approaches, 18
e.g. several chromatographic techniques (Aparicio & Aparicio-Ruiz, 2000), headspace Gas 19
Chromatography -mass spectrometry (Lopez-Feria, Cardenas, Garcia-Mesa, Fernandez-Hernandez 20
& Valcarcel, 2007), Fourier transform infrared spectroscopy (Tay, Sing, Krishnan & Gore, 2002), 21
X-ray scattering (Bortoleto, Pataca & Bueno, 2005), potentiometric stripping analysis (Lo Coco, 22
Ceccon, Ciraolo & Novelli, 2003) or inductively coupled plasma optical emission spectrometry 23
(ICP-OES) (De Souza, Mathias, Da Silveira & Aucelio, 2005). 24
With regard to stable isotope ratio analysis, the 13C/12C measured using Elemental Analyser 25
– Isotopic Ratio Mass Spectrometry (EA-IRMS) or Gas Chromatography/Combustion/Isotopic 26
Ratio Mass Spectrometry (GC/C/IRMS) in bulk olive oil or in some sub-components (individual 27
fatty acids or aliphatic alcohol and sterols) has been shown to be useful for detecting the 28
adulteration of olive oil with cheaper pomace olive oil or with other vegetable oils (Angerosa, 1
Camera, Cumitini, Gleixner & Reniero, 1997; Spangenberg, Macko & Hunziker, 1998). Moreover 2
13
C/12C, especially in combination with the 18O/16O of bulk oil, proved to be a good tool for 3
characterising geographical origin. Royer and co-workers (Royer, Gerard, Naulet, Lees & Martin, 4
1999) studied the 13C/12C of the palmitic, oleic and linoleic fatty acids of olive oils, observing 5
differences between French and Italian olive oils as compared to Greek ones and achieved regional 6
classification of the Greek olive oils. Some authors (Bréas, Guillou, Reniero, Sada & Angerosa, 7
1998; Angerosa, Bréas, Contento, Guillou, Reniero & Sada, 1999) found that both the 13C/12C and 8
18
O/16O of olive oils from Italy, Greece, Spain, Tunisia, Morocco and Turkey change according to 9
the latitude, suggesting as co-factors of variability the distance from the sea and environmental 10
conditions during the growing of plants (water stress, atmospheric moisture and temperature). 11
Finally, Aramendia et al. (2007) observed that the 18O/16O values of bulk olive oils were influenced 12
by the variety of the olives and by their geographical origin, but not by the altitude, ripening degree 13
and harvesting date of olives. To our knowledge, no papers are available in the literature regarding 14
the isotopic ratio of deuterium/hydrogen (D/H) in olive oil. 15
With regard to the mineral content of olive oil, interest initially focused on the presence of 16
toxic lead or cadmium elements and of copper and nickel as catalysts for oxidative reactions 17
affecting the flavour and stability of oils (de Souza et al., 2005). In the last few years, studies have 18
also been carried out to verify whether the mineral profile could be a useful marker of geographical 19
origin, cultivar, harvesting period and adulteration with cheaper vegetable oils (Dugo, La Pera, 20
Giuffrida, Salvo & Lo Turco, 2004; Benincasa, Lewis, Perri, Sindona & Tagarelli, 2007; Cindric, 21
Zeiner & Steffan, 2007). The high organic load and viscosity and very small mineral content of 22
olive oils were a handicap to the development of a simple and effective preparation method and 23
subsequent analysis. Several approaches were used, such as emulsion in water with the aid of some 24
surfactant or solvent (Anthemidis, Arvanitidis & Stratis, 2005; de Souza et al., 2005; Jimenez, 25
Velarte & Castillo, 2003; Castillo, Jimenez & Ebdon, 1999), liquid-liquid extraction (Dugo et al., 26
2004), wet ashing (Lo Coco et al., 2003) and total microwave digestion (Zeiner, Steffan & Cindric, 27
2005, Benincasa et al., 2007; Cindric et al., 2007). Of the analytical techniques, the following were 28
more frequently applied: electrothermal and graphite furnace atomic absorption spectrophotometry 29
(Dugo et al., 2004; Cindric et al., 2007), derivative potentiometric stripping (Dugo et al., 2004; Lo 30
Coco et al., 2003) and, increasingly in the last few years, inductively coupled plasma–optical 31
emission spectrometry (Anthemidis et al., 2005; Zeiner et al., 2005; Cindric et al., 2007) and –mass 32
spectrometry (ICP-MS) (Castillo et al., 1999; Jimenez et al., 2003; Benincasa et al., 2007). 33
34
The present work focuses on the 13C/12C in bulk oil and extracted glycerol and 18O/16O in 35
glycerol of 539 authentic PDO and PGI extra-virgin olive oils produced from 2000 to 2005 36
throughout Italy, sampled by the Ministry of Agricultural, Food and Forestry Policy and analysed to 37
establish an yearly databank of isotopic reference values. This was done to evaluate the geographic 38
authenticity of commercial samples, as has been done since 1987 for wine (EEC Reg. No. 39
2676/2000). Moreover, the mineral composition, the 18O/16O and, for the first time, the D/H in bulk 40
oil of around one hundred 2005 extra-virgin olive oils are shown and discussed for their variability. 41
42
2. Materials and methods
43 44
2.1. Sampling
45 46
Authentic and well settled extra-virgin olive oils (N = 539) were officially collected by the Ministry 47
of Agricultural, Food and Forestry Policy from 2000 to 2005 in the production regions of the only 48
one PGI and the 34 out of 37 PDOs recognised at the present in Italy, according to the EC Reg. No. 49
510/2006. Traditionally, each PDO defines multi-varietal oils (e.g. PDO Chianti can include up to 50
76 varieties). The sampling tried to cover all the harvest time, the variability of the multi-varietal 51
blends and the production area. 13C/12C in bulk olive oil and the extracted glycerol, as well as 1
18
O/16O in the glycerol, were measured in 2000 (N = 82), 2001 (102), 2002 (66), 2003 (95), 2004 2
(58) and 2005 (136) samples. In 2005, measurement of the 18O/16O and D/H of bulk olive oil also 3
took place. Finally, the mineral content of a selection of 99 samples of 2005 was measured. 4 5 2.2. Chemicals 6 Isotopes 7
All the solutions were prepared with Milli-Q water (18 MΩcm resistivity; Millipore, Bedford, MA). 8
Sodium hydroxide 2N (RP grade; Carlo Erba Reagents, Milan, Italy), hydrochloric acid at 37% 9
(RP; Carlo Erba Reagents), diethyl ether (Normapur; VWR International, Leuven, Belgium), 10
ethanol at 96% (Sigma Aldrich GmbH, Steinheim, Germany), tin and silver capsules (Säntis 11
analytical AG, Teufen, Switzerland), P2O5 at 97% (Sigma Aldrich GmbH) and nitrogen gas at
12
99.999 % (Linde Gas, Milan, Italy) were used. 13
The isotopic values (expressed in δ‰, as described below) were calculated against working in- 14
house standards (commercial olive oil and glycerol), calibrated against international reference 15
materials: fuel oil NBS-22 (IAEA-International Atomic Energy Agency, Vienna, Austria) and sugar 16
IAEA-CH-6 (IAEA) for 13C/12C measurement; IAEA-CH-6 (IAEA) for 18O/16O and NBS-22 for 17
D/H. Whereas in the past the data regarding 18O/16O in glycerol were usually calibrated against 18
glycerol used in the European project SMT4-CT98-2236 (Camin, Wietzerbin, Cortes, Haberhauer, 19
Lees & Versini, 2004), in this work they were calibrated against the IAEA-CH6 value (δ18
O = 20
+36.4‰ vs V-SMOW) assigned since 2005 (Boschetti & Iacumin, 2005) and accepted in the 21
European TRACE project (proposal contract N°FP6-2003-FOOD-2-A 006942). 22
The isotopic values of the aforementioned international reference materials and therefore also of the 23
samples were expressed in δ‰, versus V-PDB (Vienna - Pee Dee Belemnitella) for δ13C and V-24
SMOW (Vienna – Standard Mean Ocean Water) for δ18O and δD, according to the following 25
formula: [(Rs-Rstd)/Rstd] x 1000, where Rs is the isotope ratio measured for the sample and Rstd is 26
the isotope ratio of the international standard. 27
28
Elements
29
Nitric acid at 69.5% (Superpure; Merck, Darmastadt, Germany), hydrochloric acid at 37% (ACS; 30
Riedel-deHaën, Seelze, Germany), ICP Multielement Standard Solution VI (Merck), Multielement 31
Calibration Standard 1 (Agilent Technologies, Santa Clara, CA, USA), and Cesium 1000ug/ml 32
(Ultra Scientific, Bologna, Italy) were used. Standard solutions were diluted and stabilized with the 33
addition of a 1% HNO3 and 0.2% HCl solution. SRM 2387 ‘Peanut butter’ (National Institute of
34
Standard and Technologies, Gaithersburg, MD, USA) was used as standard reference material to 35
check the accuracy of the method. An on-line solution of Sc 3 mg/L, Rh 3 mg/L and Tb 3 mg/L was 36
used as the internal standard. All the glassware was rinsed with nitric acid (5% v/v) and twice with 37
milli-Q water before use. 38 39 2.3. Apparatus 40 Isotopes 41
The analysis was performed using an Isotopic Ratio Mass Spectrometer (IRMS) (Finnigan DELTA 42
XP, Thermo Scientific, Bremen, Germany) coupled with an Elemental Analyser (Flash EATM1112, 43
Thermo Scientific,) for 13C/12C measurement and with a Pyrolyser (FinniganTM TC/EA, High 44
Temperature Conversion Elemental Analyzer, Thermo Scientific,) for D/H and 18O/16O 45
measurement. To separate the gases, the Elemental Analyser was supplied with a Porapack QS (3 46
m; 6 x 4mm, OD/ID) GC column and the Pyrolyser with a Molecular Sieve 5A (0.6 m) GC 47
column. The devices were equipped with an autosampler (Finnigan AS 200, Thermo Scientific) and 48
interfaced with the IRMS through a dilutor (Conflo III, Thermo Scientific ) dosing the sample and 49
reference gases. 50
1
Elements
2
The analysis was performed using an Agilent 7500ce ICP-MS (Agilent Technologies, Tokyo, 3
Japan) equipped with an autosampler ASX-520 (Cetac Technologies Inc., Omaha, NE, USA). After 4
extraction, the samples were introduced into a Scott spray chamber using a MicroMist nebulizer and 5
then into a Fassel type torch. An Octopole Reaction System (ORS) using He and H2 as collision and
6
reaction gases respectively, was used to remove polyatomic interferences. 7
8
2.4. Sample preparation and analysis
9 10
Isotopes
11
Glycerol was obtained through hydrolysis of 20 ml of oil in NaOH, acidification of the solution, 12
extraction of fatty acids and purification by under vacuum distillation, according to the method 13
described for fat from cheese in Camin et al., 2004. 14
Aliquots of 0.3 mg of sample were weighed in tin capsules for determination of 13C/12C and silver 15
capsules for quantification of 18O/16O and 2H/1H. 16
For 13C/12C, the precision of measurement, expressed as standard deviation when measuring the 17
same sample 10 times, was 0.1‰. 18
For 18O/16O and D/H analysis, the samples were stored in a desiccator above P2O5 for at least 24
19
hours, then weighed into silver capsules and put into the auto-sampler equipped with a suitable 20
cover. During measurement, dryness was guaranteed by flushing nitrogen continuously over the 21
samples. The pyrolyser temperature was 1450°C. The D/H and 18O/16O ratios of bulk olive oils 22
were measured simultaneously in one run. The IRMS measured first D/H and then, following the 23
magnet jump, 18O/16O, taking about 10 minutes for each sample. Before measuring D/H, the H3 24
factor, which allows correction of the contribution of [H3]+ to the m/z 3 signal (Sessions, Burgoyne 25
& Hayes, 2001), was shown to be lower than 9. The precision of measurement, expressed as 26
standard deviation when measuring the same sample 10 times, was 0.3‰ for 18O/16O and 2‰ for 27 D/H. 28 29 Elements 30
15g of sample were weighed into a 50 ml conical vial of polypropylene (PP) and 15 mL of 1% 31
HNO3/0.2% HCl water solution was added. The mixture was thoroughly shaken for 30 s using a
32
vortex mixer and immediately placed in an ultrasonic bath (170 W x 5 min) to extract the trace 33
elements from the oil to the acid solution. The mixture was centrifuged (4000 rpm x 5 min) to 34
separate the two phases. The upper oil phase was accurately removed by aspiration and the lower 35
aqueous phase transferred into a clean PP vial and subjected to ICP-MS analysis of Li, B, Na, Mg, 36
K, Ca, Mn, Co, Cu, Ga, Se, Rb, Sr, Mo, Cd, Cs, Ba, La, Ce, Nd, Sm, Eu, Yb, Tl, Pb, and U. 37
Isotopes and ORS gases are shown in Table 1. Extraction and analysis was carried out in duplicate. 38
The accuracy of the extraction method was evaluated in a natural oil sample spiked with a defined 39
aliquot of the reference material (0.6 g of ‘semi-solid’ peanut butter mixed into 15 g of oil until 40
thoroughly combined). The oil and fortified mixture were both extracted and analysed ten times. 41
Recoveries were calculated on the difference of the mean content of the spiked and the un-spiked 42
samples. The detection limit (DL) of each element was calculated as 3 times the standard deviation 43
of the signal of the blank sample, extracted and analysed ten times, whereas the blank sample was 44
prepared using Milli-Q water to substitute the oil sample in the extraction step. Precision (RSD%) 45
was evaluated by preparing and analyzing an oil sample ten times. DL and RSD% are shown in 46 Table 1. 47 48 2.5 Statistical analysis 49
The data were statistically evaluated according to the procedures of the software Statistica 7.1 50
(StatSoft Italia srl, Padua, Italy). Non parametric tests (Kruskall-Wallis and multiple bilateral 51
comparison) were applied because of the low and unequal numbers of samples per group and the 1
not always normal distribution (Soliani, 2003). 2
3
3. Results and discussion
4 5
Stable isotope ratios
6
In Table 2 the median, minimum and maximum values of bulk and glycerol δ13
C and of glycerol 7
δ18
O were summarised for 2000-2004 production and the different Italian regions listed according 8
to the latitude. δ18
O was measured in the glycerol instead of in the bulk oil because the former was 9
assumed to be more closely related to the isotopic characteristics of ground water (Schmidt, Werner 10
& Rossmann, 2001). 11
The δ13C values measured in glycerol were always lower than in bulk olive oil, with a mean 12
difference ± std. dev. of 1.87 ± 0.67, confirming previous results (Zhang, Buddrus, Trierweiler & 13
Martin, 1998). Moreover, δ13Cglycerol and δ13Cbulk of the 403 samples were significantly correlated
14 (δ13
Cglycerol = 1.1114 x δ13Cbulk +1.4057; p<0.001). If we consider 2000, 2001, 2002 and 2004
15
individually, the intercepts ranged from -0.3075 to +6.3585 and the slopes from 1.0435 to 1.2841. 16
The correlation for 2003, also significant, showed particular and extreme values, both as regards 17
intercept (-7.0134) and slope (0.8162). 18
Significant differences (p<0.001) were found among the years of harvest (Table 2). In particular 19
2003, well-known as one of the hottest years in the last few decades in Italy, was consistently 20
different (p<0.001) as compared to at least one isotopic parameter from all the other years, showing 21
enrichment in the heavier isotopomeres. 22
All the isotopic parameters showed a trend for the values to increase from Trentino to Sicily in 23
all years (Table 2), with this being less evident in 2003. This trend, already observed in wine 24
(Rossmann, Schmidt, Reniero, Versini, Moussa & Merle, 1996; Rossmann, Reniero, Moussa, 25
Schmidt, Versini & Merle, 1999), is probably positively related to vicinity to the sea and dryness of 26
the climate and negatively to latitude, as suggested by some authors (Bréas, Guillou, Reniero, Sada 27
& Angerosa, 1998; Angerosa, Bréas, Contento, Guillou, Reniero & Sada, 1999). Indeed, the δ13C 28
values of plant compounds are influenced by the availability of water, relative humidity and 29
temperature, which control stomatal aperture and the internal CO2 concentration in the leaf
30
(O’Leary, 1995). The δ18O of carbohydrates and their immediate descendants, such as glycerol, is 31
correlated to the δ18
O of leaf water (Schmidt et al., 2001), which reflects the isotopic composition 32
of groundwater and average precipitation in the region - mainly related to latitude, distance from the 33
sea and altitude (Clark & Fritz, 1997) - and the extent of evapotranspiration, mainly influenced by 34
humidity and temperature (Rossmann et al., 1999). 35
For statistical evaluation, we grouped the regions into four clusters on the basis of their latitude 36
and the similarity of their isotopic ratios: North (Trentino, Veneto, Lombardia, Emilia Romagna), 37
Centre (Liguria, Tuscany, Umbria, Abruzzo, Lazio), South-1 (Campania, Apulia) and South-2 38
(Calabria, Sicily). Applying the non parametric test of Kruskall-Wallis (Figure 1), olive oil from 39
Northern Italy showed isotopic values for at least one parameter significantly lower (p<0.01) than 40
for the South-2, Centre and South-1 in five, three and two years respectively, out of the five years. 41
Central Italy was never separated from South-1, whereas it was different from South-2 in two out of 42
five years. The two southern macro areas could be distinguished from one another in three out of 43
five years. 44
Comparing the few PDOs with at least 5 samples within each region and each year, we observed 45
some significant differences (p<0.01). In Lazio, the two ‘Canino’ and ‘Sabina’ PDOs were 46
significantly different in 2000, 2002 and 2003 for δ13C and in 2001 for δ18
O. This could be ascribed 47
to the inland location of the production area of ‘Sabina’, nearer Rieti than the ‘Canino’ area, closer 48
to the sea near Tuscany, as well as to the possible effect of the prevailing olive cultivar (Aramendia 49
et al., 2007). In Abruzzo and Apulia the comparison was only possible for one year (2000 and 2001, 50
respectively). Significant differences in the δ13C values were observed between ‘Aprutino 51
Pescarese’ and ‘Colline Teatine’ in Abruzzo and between ‘Dauno’ and ‘Collina di Brindisi’ in 1
Apulia. 2
For the 2005 samples, along with the aforementioned parameters, the δ18O and δD in bulk oil were
3
also measured (Table 3). δD was investigated as a possible additional parameter for the 4
characterisation of geographical origin, being influenced in plant products by the isotopic 5
composition of the primary hydrogen source (source water through the leaf water) and by the 6
geographical and climatic factors mentioned above for δ18O, together with their biosynthetic 7
pathways (Schmidt, Werner & Eisenreich, 2003). 8
As compared to previous years (Figure 1), the median values of the isotopic parameters were lower, 9
as a consequence of the rainy and cold climate characterising 2005. 10
The δ18O values measured in bulk were significantly correlated with those in glycerol 11
(p<0.001): δ18
Obulk = 0.837*δ18Oglycerol - 3.2213 (R2 = 0.8772), the first always being lower, with a
12
mean difference of ± std. dev. of 8.15‰ ± 0.66. 13
The δ18O and δD values in bulk olive oil were also correlated (p<0,001), as happens in water (Clark 14
et al., 1997); the correlation equation is δ2Hbulk = -208,1 + 2,5091 * δ18Obulk, but the R2 value
15
(0.4582)is low. 16
The δ18O values of bulk olive oil showed the same capability as the δ18O of glycerol in terms of 17
distinguishing the four regional groups. The δD values showed similar capability to that of δ13C and 18
δ18
O to differentiate the four groups, 19
20
Mineral composition
21 22
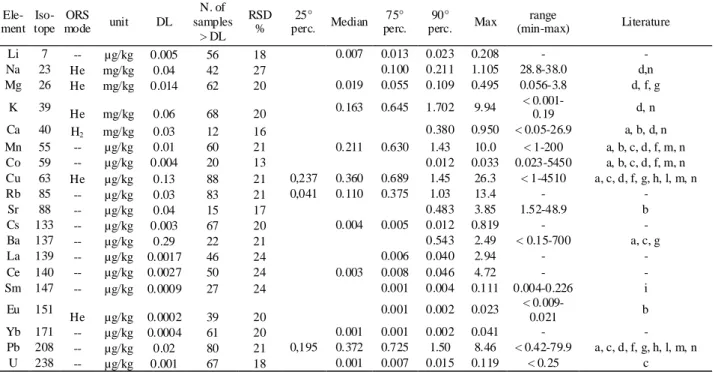
The recoveries of the extraction method evaluated with the NIST sample were generally satisfactory 23
for all the certified elements, being 82 % for Zn, 84% for Mn, 90% for Ca, 92% for Mg, 95% for K, 24
and 101 for Na. The precision of the analytical method ranged from 13 to 27% for the different 25
elements (Table 1). Such values can be deemed satisfactory, considering the very low content of 26
elements in olive oil. 27
Tables 1 and 4 show the concentration of the elements quantifiable over the DL in at least 10 28
samples. The content of Mo, Cd and Tl were below the respective DLs (0.18, 0.02 and 0.005 µg/kg 29
respectively) in all the samples. Ga was found in quantifiable amounts (DL = 0.004 µg/kg) only in 30
one Terra di Bari PDO oil (0.023 µg/kg). B was found in measurable amounts (DL = 1 µg/kg) only 31
in 5 samples, with a maximum of 12.2 µg/kg for a Monte Etna PDO oil, in agreement with the 32
results shown by Eschnauer for wines from grapes grown in volcanic areas (Eschnauer, 1982). Se 33
was only detectable (DL= 0.014 µg/kg) in 7 samples, with a maximum of 0.021 µg/kg, far below 34
the content reported by Dugo et al., 2004, for 50 Sicilian oils analysed using cathodic stripping 35
potentiometry and by Benincasa et al., (2007) for 36 oils from 4 Central-Southern Italian regions 36
digested by microwave and analysed using ICP-MS. Nd was only quantifiable (DL= 0.023 µg/kg) 37
in 9 samples, with a maximum value of 0.932 µg/kg in a Terra di Bari PDO oil. 38
Tables 1 and 4 show the distribution of the mineral element content in the total sampling and for 39
each PDO. As regards the content of Li, Rb, Cs, La, Ce and Yb shown in Table 1, we could not find 40
other data for extra-virgin olive oils in the literature, while Mg, Ca, Mn, Sr, Sm, Eu and U were 41
found in the concentration ranges reported in the literature. Na and K were measured in notably 42
lower and higher amounts respectively, as compared to olive oils from Croatia analysed by Zeiner 43
et al., 2005, and Cindric et al., 2007. The Co and Cu content were also in the ranges reported in 44
literature, with the exclusion of the maximum values found for some of the aforementioned 45
Croatian oils. The Ba content agreed with that found by Jimenez et al., 2003, and Anthemidis et al., 46
2005, but was far below the maximum content (700 µg/kg) measured by Castillo et al., 1999, using 47
a semi-quantitative ICP-MS approach with direct emulsion nebulisation of the oil sample. The Pb 48
content was low and always below the legal limits (0.1 mg/kg, EEC Reg. No. 466/2001), probably 49
as a consequence of the increasingly widespread use of adequate equipment throughout the olive oil 50
processing chain. 51
Comparison between the mineral content of the individual PDOs was not an aim of this first work 1
carried out on Italian extra-virgin olive oils in agreement with the Italian Ministry of Agricultural, 2
Food and Forestry Policy. At all events - taking into account only the 3 PDOs with at least 10 3
samples each, namely Garda, Umbria and Terra di Bari - a trend toward higher Mg, Ca, Mn and Sr 4
content would seem to characterise the Garda oils, especially if compared to the Umbrian oils, 5
possibly related to the soil of the region, mainly originating from dolomitic limestone rock. 6
7
Conclusions
8
This paper shows the results of the largest investigation ever carried out on multi-element stable 9
isotope ratio and mineral composition using IRMS and ICP-MS in authentic PDO and PGI Italian 10
extra-virgin olive oils. The study was done in collaboration with the Ministry of Agricultural, Food 11
and Forestry Policy to establish a national databank for olive oils. 12
The stable isotope ratios of carbon, oxygen and hydrogen in olive oil were shown to increase from 13
Trentino to Sicily, making it possible to distinguish Northern Italy from Sicily and Calabria each 14
year and confirming the trend observed for other commodities such as wine. Significant differences 15
were found among the years of harvest and in some cases also between PDOs from the same region. 16
The δ13C and δ18O values in bulk oil were significantly correlated with those in glycerol. The δ18
O 17
in glycerol showed the same capability to differentiate the geographic origin as δ18O in bulk, 18
whereas in some years the δ13
C of glycerol showed a better capability to discriminate as compared 19
to bulk. Because the discriminating capability achievable using δ13
C in glycerol is the same as that 20
of δ18O in bulk, it would seem preferable to directly measure the isotopic ratios in bulk, making 21
savings in terms of time and costs. The δD values, measured in 2005 for the first time in oil, showed 22
promising geographical discrimination capability. 23
The content of each mineral element in well settled olive oil, measured after ultrasound acid 24
extraction, was basically low and similar to that seen in the literature. The capability to discriminate 25
on the basis of minerals in PDOs could only be checked for few oils produced in specific areas with 26
different geology and requires further research in order to be confirmed. 27
28
References
29 30
Alves, R.M., Cunha, S.C., Amaral, J.S., Pereira, J.A., & Oliveira, M.B. (2005). Classification of 31
PDO olive oils on the basis of their sterol composition by multivariate analysis. Analytica 32
Chimica Acta, 549, 166-178. DOI: 10.1016/j.aca.2005.06.033.
33
Angerosa, F., Camera, L., Cumitini, S., Gleixner, G., & Reniero, F. (1997). Carbon stable isotopes 34
and olive oil adulteration with pomace oil. Journal of Agriculture and Food Chemistry, 45, 35
3044-3048. 36
Angerosa, F., Bréas, O., Contento, S., Guillou, C., Reniero, F., & Sada, E. (1999). Application of 37
stable isotope ratio analysis to the charachterization of the geographical origin f olive oils. 38
Journal of Agriculture and Food Chemistry, 47, 1013-1017. DOI: 10.1021/jf9809129.
39
Anthemidis, A.N., Arvanitidis, V., & Stratis, J.A. (2005). On-line emulsion formation and multi-40
element analysis of edible oils by inductively coupled plasma atomic emission spectrometry. 41
Analytica Chimica Acta, 537, 271-278. DOI: 10.1016/j.aca.2005.01.035.
42
Aparicio, R., & Aparicio-Ruiz, R. (2000). Authentication of vegetable oils by chromatographic 43
techniques. Journal of Chromatography A, 881, 93-104. 44
Aramendia, M.A., Marinas, A., Marinas, J.M., Moreno, J.M., Moalem, M., Rallo, L., & Urbano, 45
F.J. (2007). Oxygen-18 measurement of Andalusian olive oils by continuous flow 46
pyrolysis/isotope ratio mass spectrometry. Rapid Communications in Mass Spectrometry, 47
21, 487-496. 48
Benincasa, C., Lewis, J., Perri, E., Sindona, G., & Tagarelli, A., (2007). Determination of trace 49
elements in Italian virgin olive oils and their characterization according to geographical 50
origin by statistical analysis. Analytica Chimica Acta, 585, 366-370. DOI: 1
10.1016/j.aca.2006.12.040. 2
Bortoleto, G.G., Pataca, L.C.M., & Bueno, M.I.M.S. (2005). A new application of X-ray scattering 3
using principal component analysis – classification of vegetable oils. Analytica Chimica 4
Acta, 539, 283-287. DOI: 10.1016/j.aca.2005.03.025.
5
Boschetti, T., Iacumin, P. (2005) Continous flow δ18O measurements: new approach to 6
standardisation, high-temperature thermodynamic and sulphate analysis. Rapid
7
Communications in Mass Spectrometry, 19, 1-8.
8
Bréas, O., Guillou, C., Reniero, F., Sada, E., & Angerosa, F. (1998). Oxygen-18 measurement by 9
continuous flow pyrolysis/isotope ratio mass spectrometry of vegetable oils. Rapid 10
Communications in Mass Spectrometry, 12(4), 188-192.
11
Camin, F., Wietzerbin, K., Cortes, A.B., Haberhauer, G., Lees, M., & Versini, G. (2004). 12
Application of multielement stable isotope ratio analysis to the characterization of French, 13
Italian, and Spanish cheeses. Journal of Agriculture and Food Chemistry, 52, 6592-6601. 14
Castillo, J., Jimenez, M.S., & Ebdon, L. (1999). Semiquantitative simultaneous determination of 15
metals in olive oil using direct emulsion nebulization. Journal of Analytical Atomic 16
Spectrometry, 14, 1515-1518.
17
Cindric, I.J., Zeiner, M., & Steffan, I. (2007). Trace elemental characterization of edible oils by 18
ICP-AES and GFAAS. Microchemical Journal, 85, 136-139. DOI: 19
10.1016/j.microc.2006.04.011. 20
Clark, I., & Fritz, P. (1997). Environmental Isotopes in Hydrogeology. Lewis Publishers, New 21
York, pp. 35-78. 22
Eschnauer, H. (1982). Trace elements in must and wine: primary and secondary contents. American 23
Journal of Enology and Viticulture, 33 (4), 226-230.
24
De Souza, R.M., Mathias, B.M., Da Silveira, C.L.P., & Aucelio, R.Q. (2005). Inductively coupled 25
plasma optical emission spectrometry for trace multi-element determination in vegetable 26
oils, margarine and butter after stabilization with propan-1-ol and water. Spectrochimica 27
Acta Part B, 60, 711-715. DOI: 10.1016/j.sab.2005.02.025.
28
D’Imperio, M., Dugo, G., Alfa, M., Mannina, L., & Segre, A.L. (2007). Statistical analysis on 29
Sicilian olive oils. Food Chemistry, 102, 956-965. DOI: 10.1016/j.foodchem.2006.03.003. 30
Dugo, G., La Pera, L., Giuffrida, D., Salvo, F., & Lo Turco, V. (2004). Influence of the olive 31
variety and the zone of provenience on selenium content determined by cathodic stripping 32
potentiometry (CSP) in virgin olive oils. Food Chemistry, 88, 135-140. DOI: 33
10.1016/j.foodchem.2003.12.036. 34
Jimenez, M.S., Velarte, R., & Castillo, J.R. (2003). On-line emulsiono f olive oil samples and ICP-35
MS multi-elemental determination. Journal of Analytical Atomic Spectrometry, 18, 1154-36
1162. DOI: 10.1039/b303131d. 37
Lo Coco, F., Ceccon, L., Circolo, L., & Novelli, V. (2003). Determination of cadmium (II) and zinc 38
(II) in olive oils by derivative potentiometric stripping analysis. Food Control, 14, 55-59. 39
Lopez-Feria, S., Cardenas, S., Garcia-Mesa, J.A., Fernandez-Hernandez, A., & Valcarcel, M. 40
(2007). Quantification of the intensity of virgin olive oil sensory attributes by direct 41
coupling headspace-mass spectrometry and multivariate calibration techniques. Journal of 42
Chromatography A, 1147, 144-152. DOI: 10.1016/j.chroma.2007.02.107.
43
O’Leary, M.H. (1995). Environmental Effects on Carbon Isotope Fractionation in Terrestrial 44
Plants, in Stable Isotope in the Biosphere. Kyoto Univeristy Press, Japan, Wada E,
45
Yoneyama T, Mingawa M, Ando T., pp. 78-91. 46
Rezzi, S., Axelson, D.E., Heberger, K., Reniero, F., Mariani, C., & Guillou, C. (2005). 47
Classification of olive oils using high throughput flow 1H-NMR fingerprinting with 48
principal component analysis, linear discriminant analysis and probabilistic neural networks. 49
Analytica Chimica Acta, 552, 13-24. DOI: 10.1016/j.aca.2005.07.057.
Rossmann, A., Schmidt, H.L., Reniero, F., Versini, G., Moussa, I., Merle, M.H. (1996) Stable 1
carbon isotope content in ethanol of EC databank wines from Italy, France and Germany. 2
Zeitschrift fuer Lebensmittel-Untersuchung und -Forschung, 203, 293-301.
3
Rossmann, A., Reniero, F., Moussa, I., Schmidt, H.L., Versini, G., Merle M.H. (1999) Stable 4
oxygen isotope content of water of EU databank wines from Italy, France and Germany. 5
Zeitschrift fuer Lebensmittel-Untersuchung und -Forschung, 208, 400-407.
6
Royer, A., Gerard, C., Naulet, N., Lees, M., & Martin, G.J. (1999). Stable isotope charachterization 7
of olive oils. I-Compositional and carbon-13 profiles of fatty acids. Journal of the American 8
oil chemist society, 76(3), 357-363.
9
Schmidt, H.-L., Werner, R.A., & Rossmann, A. (2001). 18O pattern and biosynthesis of natural 10
plant products. Phytochemistry, 58, 9-32. 11
Schmidt, H.-L., Werner, R.A., & Eisenreich, W. (2003). Systematics of 2H patterns in natural 12
compounds and ist importance fort he elucidation of biosynthetic pathways. Phytochemistry 13
Reviews, 2, 61-85.
14
Sessions, A.L., Burgoyne, T.W., & Hayes, J.M. (2001). Analytical Chemistry; 73: 200. DOI: 15
10.1021/ac000488m. 16
Soliani, L. (2003). Statistica applicata alla ricerca biologica e ambientale. Parma: UNINOVA eds. 17
Spangenberg, J.E., Macko, S.A., & Hunziker, J. (1998). Characterization of olive oil by carbon 18
isotope analysis of individual fatty acids: implications for authentication. Journal of 19
Agriculture and Food Chemistry, 46, 4179-4184. DOI: 10.1021/jf980183x.
20
Tay, A., Singh, R.K., Krishnan, S.S., & Gore, J.P. (2002). Authentication of olive oil adulterated 21
with vegetables oils using fourier transform infrared spectroscopy. LWT- Food Science and 22
Technology, 35, 99-103. DOI: 10.1006/fstl.2001.0864.
23
Vichi, S., Pizzale, L., Conte, L.S., Buxaderas, S., & Lopez-Tamames, E. (2007). The occurrence of 24
volatile and semi-volatile aromatic hydrocarbons in virgine olive oils from north-eastern 25
Italy. Food Control, 18, 1204-1210. DOI: 10.1016/j.foodcont.2006.07.015. 26
Zeiner, M., Steffan, I., & Cindric, I.J. (2005). Determination of trace elements in olive oil by ICP-27
AES and ETA-AAS: a pilot study on the geographical characterization (2005). 28
Microchemical Journal, 81, 171-176. DOI: 10.1016/j.microc.2004.12.002.
29
Zhang, B.-L., Buddrus, S., Trierweiler, M., & Martin, G.J. (1998), Characterization of glycerol 30
from different origins by 2H- and 13C NMR studies of site-specific natural isotope 31
fractionation. Journal of Agriculture and Food Chemistry, 46, 1374-1380. 32
Table 1: Instrumental conditions and mineral content distribution of well settled extra-virgin Italian
olive oils (ORS: collision cell Octopole Reaction System)
Ele- ment Iso-tope ORS mode unit DL N. of samples > DL RSD % 25° perc. Median 75° perc. 90° perc. Max range (min-max) Literature Li 7 -- µg/kg 0.005 56 18 0.007 0.013 0.023 0.208 - - Na 23 He mg/kg 0.04 42 27 0.100 0.211 1.105 28.8-38.0 d,n Mg 26 He mg/kg 0.014 62 20 0.019 0.055 0.109 0.495 0.056-3.8 d, f, g K 39 He mg/kg 0.06 68 20 0.163 0.645 1.702 9.94 < 0.001-0.19 d, n Ca 40 H2 mg/kg 0.03 12 16 0.380 0.950 < 0.05-26.9 a, b, d, n Mn 55 -- µg/kg 0.01 60 21 0.211 0.630 1.43 10.0 < 1-200 a, b, c, d, f, m, n Co 59 -- µg/kg 0.004 20 13 0.012 0.033 0.023-5450 a, b, c, d, f, m, n Cu 63 He µg/kg 0.13 88 21 0,237 0.360 0.689 1.45 26.3 < 1-4510 a, c, d, f, g, h, l, m, n Rb 85 -- µg/kg 0.03 83 21 0,041 0.110 0.375 1.03 13.4 - - Sr 88 -- µg/kg 0.04 15 17 0.483 3.85 1.52-48.9 b Cs 133 -- µg/kg 0.003 67 20 0.004 0.005 0.012 0.819 - - Ba 137 -- µg/kg 0.29 22 21 0.543 2.49 < 0.15-700 a, c, g La 139 -- µg/kg 0.0017 46 24 0.006 0.040 2.94 - - Ce 140 -- µg/kg 0.0027 50 24 0.003 0.008 0.046 4.72 - - Sm 147 -- µg/kg 0.0009 27 24 0.001 0.004 0.111 0.004-0.226 i Eu 151 He µg/kg 0.0002 39 20 0.001 0.002 0.023 < 0.009-0.021 b Yb 171 -- µg/kg 0.0004 61 20 0.001 0.001 0.002 0.041 - - Pb 208 -- µg/kg 0.02 80 21 0,195 0.372 0.725 1.50 8.46 < 0.42-79.9 a, c, d, f, g, h, l, m, n U 238 -- µg/kg 0.001 67 18 0.001 0.007 0.015 0.119 < 0.25 c
a: Anthemidis et al., 2005; b: Benincasa et al., 2007; c: Castillo et al., 1999; d: Cindric et al., 2007; e: Dugo et al., 2004; f: Jimenez et al., 2003; g: La Pera et al., 2002; h: Lo Coco et al., 2000; i: Lo Coco et al., 2003; l: Martin-Polvillo et al., 1994; m: Solinas et al., 1987; n: Zeiner et al., 2005.
1
Table 2: Median, minimum and maximum values of δ13C (bulk olive oil and glycerol) and of δ18O values of glycerol (‰, vs V-PDB and V-SMOW, respectively) in the Italian olive oil databank (2000-2004) and results of the non-parametric statistical test (Kruskall-Wallis’ test) among crops; different letters correspond to significantly different median values (p<0.001). N = number of samples
Region N tot Parameter 2000 2001 2002 2003 2004
N Median Min Max N Median Min Max N Median Min Max N Median Min Max N Median Min Max
Trentino 37 δ13C bulk 5 -30.7 -31.8 -29.7 23 -30.7 -32.4 -30.1 3 -29.7 -30.4 -29.7 3 -29.5 -29.5 -29.4 3 -30.7 -30.8 -30.4 δ13C glycerol -33.6 -34.7 -32.7 -33.5 -34.6 -32.7 -32.8 -33.3 -31.8 -32.2 -32.4 -31.9 -33.4 -33.5 -33.2 δ18O glycerol 29.2 27.8 29.2 29.1 28.0 30.5 29.3 28.5 30.2 30.9 30.8 32.4 29.3 29.2 29.3 Veneto 20 δ13C bulk 3 -30.3 -30.9 -30.3 3 -30.3 -30.7 -30.3 3 -31.1 -31.2 -30.7 5 -28.8 -29.0 -27.5 6 -30.1 -31.4 -29.0 δ13C glycerol -32.4 -33.9 -32.3 -32.5 -32.6 -32.1 -32.6 -33.3 -32.0 -31.5 -31.8 -29.2 -32.0 -33.5 -31.0 δ18O glycerol 31.3 29.1 31.7 29.8 29.5 30.8 28.9 28.0 30.3 32.7 30.2 33.1 30.6 29.7 33.1 Lombardia 16 δ13C bulk 4 -30.3 -30.6 -29.9 3 -30.4 -30.6 -30.3 - - - - 5 -29.1 -29.3 -28.6 4 -31.0 -31.4 -29.4 δ13C glycerol -32.5 -33.6 -32.1 -32.2 -32.3 -31.9 - - - -30.7 -31.3 -29.8 -32.8 -33.1 -31.7 δ18O glycerol 30.2 28.1 31.3 29.8 29.7 30.1 - - - 31.5 31.3 32.1 30.3 29.6 33.2 Emilia- 13 δ13C bulk 2 -29.2 - - 3 -29.6 -29.8 -29.4 2 -30.0 - - 6 -29.1 -29.3 -28.7 - - - - Romagna δ13C glycerol -31.6 - - -31.6 -31.6 -31.3 -32.3 - - -31.2 -31.7 -30.7 - - - δ18O glycerol 29.7 - - 29.8 29.1 30.1 29.7 - - 31.1 30.9 32.4 - - - Liguria 18 δ13C bulk 3 -30.3 -30.6 -30.1 3 -29.7 -30.0 -29.1 3 -30.3 -30.5 -29.6 6 -28.8 -29.1 -28.2 3 -30.0 -30.2 -29.6 δ13C glycerol -33.3 -33.4 -33.1 -32.2 -32.7 -31.7 -32.7 -33.3 -32.6 -31.1 -31.7 -30.9 -33.1 -33.1 -32.6 δ18O glycerol 31.3 31.1 31.3 31.8 31.6 33.2 29.8 29.5 29.9 32.3 31.5 32.6 31.4 30.4 32.0 Tuscany 23 δ13C bulk 5 -29.3 -30.0 -28.3 6 -29.3 -30.3 -29.0 9 -30.4 -30.8 -29.9 3 -28.7 -29.5 -27.9 - - - - δ13C glycerol -31.0 -32.3 -30.2 -31.3 -32.1 -30.9 -32.5 -33.3 -31.4 -31.4 -31.7 -30.5 - - - δ18O glycerol 32.9 30.9 34.2 31.0 30.2 31.8 31.2 28.4 33.1 31.9 31.6 32.8 - - - Umbria 30 δ13C bulk 4 -29.3 -29.5 -29.2 15 -29.4 -30.0 -28.1 - - - - 11 -28.9 -29.5 -28.3 - - - - δ13C glycerol -30.1 -31.4 -29.7 -30.9 -32.0 -29.6 - - - -30.6 -31.7 -29.8 - - - δ18O glycerol 31.8 30.5 33.7 32.1 30.0 33.4 - - - 32.6 31.4 33.4 - - - Abruzzo 30 δ13C bulk 10 -28.7 -29.7 -28.1 - - - - 6 -29.4 -30.1 -29.0 8 -28.3 -28.5 -28.1 6 -29.1 -30.0 -28.4 δ13C glycerol -30.4 -31.3 -28.8 - - - -30.8 -31.5 -29.9 -29.8 -30.1 -29.7 -31.0 -31.8 -30.3 δ18O glycerol 32.9 31.1 34.1 - - - 31.6 30.6 32.2 33.4 33.2 33.5 32.6 31.2 33.3 Lazio 50 δ13C bulk 10 -29.2 -30.3 -28.1 12 -28.8 -29.5 -28.0 12 -30.1 -31.1 -29.6 12 -28.6 -29.3 -27.8 4 -29.3 -29.9 -28.9 δ13C glycerol -30.7 -32.1 -28.5 -30.3 -31.2 -28.9 -31.1 -32.8 -29.6 -29.8 -31.3 -28.4 -31.0 -31.7 -30.3 δ18O glycerol 33.3 31.8 33.5 32.8 30.6 33.5 31.6 29.9 33.3 33.0 32.4 33.4 32.5 32.2 32.9 Campania 35 δ13C bulk 9 -29.4 -29.7 -27.5 9 -28.2 -29.3 -27.4 9 -30.0 -30.8 -28.9 6 -28.5 -29.5 -27.9 2 -28.8 -29.0 -28.6 δ13C glycerol -31.5 -32.5 -30.0 -30.4 -31.1 -29.8 -31.7 -33.5 -29.7 -30.5 -31.5 -29.7 -30.8 -31.1 -30.5 δ18O glycerol 33.3 31.9 34.4 33.0 31.2 34.3 31.2 27.6 31.9 33.1 31.2 33.9 32.0 31.7 32.3 Apulia 55 δ13C bulk 18 -29.2 -30.4 -28.2 22 -28.9 -30.0 -26.6 5 -30.6 -30.8 -30.0 - - - - 10 -29.6 -30.6 -28.5 δ13C glycerol -31.4 -32.3 -29.9 -30.8 -31.8 -29.3 -32.1 -34.4 -32.0 - - - -31.8 -33.0 -30.7 δ18O glycerol 31.7 30.3 35.7 31.9 31.1 34.2 31.0 29.8 31.7 - - - 31.9 30.5 32.6 Calabria 24 δ13C bulk - - - - - - - - 8 -29.8 -31.3 -28.3 9 -29.4 -30.1 -28.8 7 -29.2 -30.2 -29.0 δ13C glycerol - - - - - - -31.0 -32.0 -29.9 -30.5 -31.1 -30.2 -31.0 -31.3 -30.4 δ18O glycerol - - - - - - 32.9 30.7 34.1 33.5 31.3 34.8 34.8 32.5 35.6 Sicily 52 δ13C bulk 9 -28.4 -28.7 -28.0 3 -28.3 -28.5 -27.0 6 -28.5 -29.4 -27.7 21 -28.8 -30.0 -27.7 13 -29.1 -29.8 -28.0 δ13C glycerol -30.4 -31.4 -29.3 -29.3 -29.4 -28.4 -29.5 -31.8 -28.8 -30.2 -31.5 -29.0 -30.6 -31.8 -29.1 δ18O glycerol 35.5 32.5 36.2 33.9 33.4 35.1 33.7 33.1 34.8 33.0 30.6 35.0 34.2 32.4 34.6 Total 403 δ13C bulk 82 -29.3ab -31.8 -27.5 102 -29.2ab -32.4 -26.6 66 -30.0c -31.3 -27.7 95 -28.9a -30.1 -27.5 58 -29.4bc -31.4 -28.0 δ13C glycerol -31.2b -34.7 -28.5 -31.2b -34.6 -28.4 -31.7b -34.4 -28.8 -30.6a -32.4 -28.4 -31.3b -33.5 -29.1 δ18O glycerol 30.0ab 25.2 33.6 29.0b 25.4 32.5 28.7b 25.0 32.2 30.1a 27.6 32.4 29.7ab 26.7 33.1 1 2 3 4
Table 3: Median values of δ13C (bulk olive oil and glycerol), δ18O (bulk and glycerol) and δD (bulk oil) for North, Centre, South-1 and South-2
Italian olive oils produced in 2005 and results of the non-parametric statistical test (Kruskall-Wallis’ test); different letters correspond to significantly different median values (p<0.01).
δ13 C bulk (‰ vs V-PDB) δ 13 C glycerol (‰ vs V-PDB) δ 18 O glycerol (‰ vs V-SMOW) δ 18 O bulk (‰ vs V-SMOW) δ 2 H bulk (‰ vs V-SMOW) N
Median Min Max Median Min Max Median Min Max Median Min Max Median Min Max
North 45 -30.9a -31.9 -29.8 -33.9a -35.0 -32.0 28.0a 26.9 31.0 20.2a 19.1 22.4 -159a -165 -145 Centre 45 -30.1b -30.9 -29.0 -32.3b -33.5 -30.6 30.5b 28.9 32.3 22.3b 20.3 23.7 -153b -162 -142 South1 19 -29.6bc -30.9 -29.2 -32.0b -33.3 -31.0 30.1b 29.6 31.6 22.2b 21.8 23.1 -149bc -156 -140 South2 27 -29.2c -30.9 -27.9 -31.0c -32.5 -28.9 32.8c 30.6 35.7 24.5c 22.8 26.8 -148c -155 -137 5 6
Table 4: Mineral content of well settled 2005 extra-virgin Italian olive oils displayed for Region and for PDO or PGI.
South Italy Centre Italy North Italy
Region Calabria Apulia Sicily Lazio Tuscany Umbria Venet o Trentino -Venet o
PDO/PGI Crot onese Alto Bruzio Lametia di Bari Terra Monte Etna Monti Iblei Demone Val Mazara Val di Valli
del Belice
Vall i
Trapanesi Canino Sabina Lucca Toscano
PGI Umbria Venet o Garda Ele-
ment unit N. Obs. 3 2 3 10 3 3 3 3 3 3 6 6 3 3 12 7 26 median 0.003 0.010 0.007 0.031 0.013 0.011 0.007 0.008 0.004 0.006 0.006 0.016 0.003 Li µg/kg max 0.010 0.006 0.013 0.039 0.208 0.046 0.008 0.013 0.007 0.010 0.018 0.012 0.014 0.007 0.029 0.064 0.091 median 0.049 0.280 0.189 0.065 0.069 0.060 0.154 Na mg/kg max 0.124 0.100 0.170 1.11 0.492 0.161 0.129 0.052 0.326 0.124 0.133 0.340 0.609 0.312 median 0.042 0.082 0.087 0.015 0.047 0.016 0.031 0.034 0.050 0.046 Mg mg/kg max 0.016 0.017 0.225 0.495 0.139 0.017 0.081 0.017 0.016 0.110 0.056 0.047 0.053 0.104 0.264 median 0.038 0.180 0.415 0.726 1.171 0.116 0.418 0.079 0.033 0.292 0.109 0.424 0.516 K mg/kg max 0.32 0.08 0.22 3.79 9.94 1.70 0.17 0.90 0.10 0.12 0.56 1.13 0.12 0.43 0.64 2.06 3.13 median Ca mg/kg max 0.395 0.447 0.603 0.950 median 0.408 0.598 0.491 0.351 0.134 0.312 0.058 0.921 0.392 0.507 Mn µg/kg max 0.566 10.0 3.42 1.21 0.522 3.61 0.655 0.173 1.17 0.623 1.49 2.87 median 0.003 0.006 Co µg/kg max 0.033 0.024 0.030 0.009 0.005 0.014 0.030 0.012 0.031 µg/kg median 0.160 0.334 0.343 0.404 2.107 0.446 0.360 0.434 0.311 0.171 0.251 0.127 0.416 0.324 0.258 0.583 0.493 Cu max 0.237 0.363 0.952 2.37 15.8 1.47 0.689 0.472 0.885 0.430 0.663 0.824 0.778 0.355 0.810 1.72 26.3 µg/kg median 0.040 0.108 0.394 0.199 0.628 0.040 0.178 0.060 0.036 0.237 0.173 0.214 0.058 0.336 0.183 Rb µg/kg max 0.263 0.049 0.175 4.19 13.4 1.59 0.081 0.802 0.066 0.074 2.98 2.69 0.055 0.214 0.584 1.013 1.110 µg/kg median Sr max 1.23 3.85 1.12 1.40 µg/kg median 0.003 0.008 0.004 0.004 0.004 0.012 0.004 0.004 0.005 0.004 0.006 0.004 0.008 0.003 0.004 0.004 Cs µg/kg max 0.005 0.012 0.005 0.012 0.038 0.014 0.004 0.013 0.005 0.005 0.819 0.011 0.012 0.004 0.012 0.007 0.012 µg/kg median Ba max 2.05 2.49 0.550 1.13 0.309 0.435 1.34 0.695 µg/kg median 0.064 0.032 0.002 0.016 0.009 0.001 0.002 La µg/kg max 0.158 2.94 0.008 0.023 0.004 0.225 0.012 0.035 0.040 0.011 0.005 µg/kg median 0.002 0.043 0.058 0.020 0.013 0.004 0.003 Ce max 0.004 0.111 4.72 0.018 0.045 0.008 0.161 0.024 0.056 0.056 0.013 0.009 µg/kg median 0.005 0.003 0.001 0.001 Sm µg/kg max 0.010 0.111 0.002 0.015 0.001 0.004 0.003 0.002 µg/kg median 0.0010 0.0017 0.0021 0.0004 0.0004 Eu max 0.0020 0.0020 0.0017 0.0226 0.0008 0.0004 0.0020 0.0020 0.0021 0.0032 0.0021 0.0028 0.0025 0.0023 0.0006 µg/kg median 0.0012 0.0007 0.0019 0.0022 0.0007 0.0006 0.0011 0.0011 0.0007 0.0012 0.0012 0.0003 0.0007 Yb µg/kg max 0.0017 0.0014 0.0032 0.0412 0.0015 0.0009 0.0017 0.0017 0.0015 0.0032 0.0022 0.0033 0.0030 0.0020 0.0011 µg/kg median 0.180 0.262 0.595 0.380 2.11 0.439 0.815 0.292 0.300 0.329 0.234 0.790 0.345 0.516 0.691 0.260 Pb max 1.47 0.299 1.50 2.69 3.86 0.972 1.24 0.733 0.409 0.468 1.84 0.464 2.60 0.573 2.76 0.904 8.46 µg/kg median 0.0021 0.0021 0.0104 0.0008 0.0009 0.0030 0.0130 0.0050 0.0067 0.0012 0.0014 0.0023 U µg/kg max 0.0014 0.0176 0.0401 0.0802 0.0017 0.0016 0.0145 0.0067 0.1190 0.0939 0.0211 0.0044 0.0131 0.0390 1 2 3