No. 2009–72
CORPORATE TAXATION, FIRM ENTRY RATES, AND
ENTRANTS’ SIZE: EVIDENCE FROM EUROPE
By Marco Da Rin, Marina Di Giacomo,
Alessandro Sembenelli
Corporate Taxation, Firm Entry Rates,
and Entrants’ Size: Evidence from
Europe
Marco Da Rin
∗ Tilburg UniversityMarina Di Giacomo
Università di TorinoAlessandro Sembenelli
Università di Torino and Collegio Carlo Alberto
September 2009
Abstract
Using a novel country-industry level panel database with information on newly incorporated firms in 17 European countries between 1997 and 2004, we study how taxation of corporate income affects entry rates and the size of entrants at the country-industry level. After accounting for the possible endogeneity of taxation. we find that a reduction in the effective corporate income tax rate leads to a signifi-cant increase in entry rates and to a reduction of the scale of entrants. These effects are non-linear and suggest that corporate income tax reductions affect entry rates only below a certain threshold level. JEL CODES: C23, H32, L26, L51, M13.
KEYWORDS: Entrepreneurship. Corporate income taxation. Incorporation.
Firm entry. Firm size. Entry regulation.
∗Acknowledgments: We thank participants to the 2009 Annual Congress of the European Economic Assocation in Barcelona for useful comments and suggestions. Theo Jurrius provided able research assistance. We also thank Patrick Osterling and Bob Vaanhold at Bureau van Dijk and Angela Vuono at Ernst & Young for help with the data. Marco Da Rin is also affiliated with the European Corporate Governance Network (ECGI) and IGIER.
1
Introduction
In virtually all countries, public policy aims at fostering entrepreneurship by encouraging the formation of new companies in order to stimulate in-novation, competition, employment, and eventually economic growth (see Aghion and Howitt (2006)). Studies that evaluate such policies abound. In particular, a recent strand of literature exploits the increasing avail-ability of firm-level data to assess how different labor, credit, and prod-uct market regulations affect entry and the characteristics of entrants and incumbents.1 This literature has paid little attention to corporate tax policy. This omission strikes as important, since flexibility and ease of implementation make tax policy an appealing instrument for encouraging the formation of entrepreneurial companies.2
Building on Da Rin, Di Giacomo and Sembenelli (2009), we analyze how corporate taxation affects entry rates (the “extensive margin") and the initial size of entrants, measured by both capital and labor (the “intensive margin"). Both effects are policy-relevant. The effect on the extensive mar-gin reflects the ability of the economy to create new growth opportunities through the creation of new businesses. The effect on the intensive margin reflects both the quality and the speed of growth (see Kerr and Nanda (2009, 2010)). The extent to which each effect contributes to economic growth is an empirical issue. For instance, in their study of OECD coun-tries in the 1980s, Rajan and Zingales (1998) find that about two thirds of economic growth comes from an increase in size of existing companies, while the remaining third from the creation of new ones. The analysis of these patterns is clearly important for a correct design of economic policies, and we provide a first step in this direction.
The theoretical literature on corporate taxation has identified several possible (countervailing) channels that may link tax policy to the rate and characteristics of entrepreneurial entry (see Section 2). The net sign and size of the tax system’s effects on individuals’ incentives to undertake risky projects are however ambiguous, and the actual impact of taxation on entry and size remains an empirical question.
Our aim is to empirically investigate these links in a panel data setting, that allows to overcome the weaknesses of purely cross-sectional studies. Our data consist of a novel firm-level dataset covering 17 West European
1
See, among others, Ardagna and Lusardi (2009, 2010), Bertrand and Kramarz (2002), Alesina et al. (2005), Klapper, Laeven and Rajan (2006).
2
Djankov et al (2008) and Klapper et al (2006) are the only exceptions we are aware of.
countries between 1997 and 2004. The different evolution of tax policies over time in Europe provides a good source of identification for our em-pirical exercise. Several European countries reduced statutory tax rates during the last decade, while at the same time also changing the effective tax base, thus creating a variety of situations which we exploit economet-rically. Our analysis recognizes that tax policy is likely to react to business conditions, and therefore cannot be treated as an exogenous policy instru-ment. To the best of our knowledge, our study is the first to take into account the endogeneity of tax policy in this context.
We find that the corporate tax rate has different effects on the extensive and on the intensive margins. A lower corporate tax rate enhances entry, while it reduces the size of entrants. These relationships are statistically significant and economically relevant. We also find that they are non-linear, as their magnitude decreases with the tax rate.
A possible interpretation of our results is that the tax system consti-tutes a barrier to entry. As found by Klapper, Laeven and Rajan (2006), high entry costs may make entry attractive only for larger firms. Given the flexibility of taxation as a policy tool, our findings that a reduction in effective corporate income tax rate affects entrepreneurial activity–at both the extensive and the intensive margin–suggest that taxation should be regarded as an effective tool, and its implications for the characteristics of entrants further investigated.
2
Theoretical framework
We base our analysis on the framework built by Cullen and Gordon (2007), which provides a synthesis of previous models capturing several effects of taxation on the decision of entry (by incorporation) and on the scale of the firm. Their model identifies three channels through which corporate income taxation affects the incorporation decision and the optimal choice of scale.
The first channel (“income shifting") consists of the possibility to shift income between the personal and the corporate tax bases to take advan-tage of the difference between personal and corporate tax rates. The sec-ond channel (“risk subsidy") consists of a negative relationship between the corporate tax rate and entrepreneurial risk taking: tax liabilities fall as the individual undertakes riskier project, providing a tax subsidy to risk taking. This channel, that operates also for risk neutral individuals, depends on the riskiness of the project, the progressiveness of personal income tax rates and the structure of corporate tax rates. The third
chan-nel (“risk-sharing") captures the possibility of sharing entrepreneurial risk with the government. As the corporate tax rate increases, the entrepreneur bears less idiosyncratic risk, since she is able to share more of it with the collectivity.
To link these three channels to the extensive margin and the intensive margin effects we aim to identify in our empirical analysis consider the fol-lowing. A higher corporate income tax discourages incorporation through the “income shifting" and the “risk subsidy" channels, but it makes risk-taking more attractive via the “risk-sharing" channel. The consequences of corporate taxation on the extensive margin depend therefore on the relative sizes of these offsetting effects.
As with the intensive margin effect, i.e., on the size of entrants, we need to distinguish between the effect of taxation on capital and on labor. Taxes affect capital investment decisions in the same way as the decision to incorporate: higher corporate tax rates decrease the initial investment via the “income shifting" and the “risk subsidy" channels, while they increase it via the “risk sharing" channel. Labor size, instead, is affected only by the “risk subsidy" and “risk-sharing" channels. The net outcome of changed corporate income taxation is therefore ambiguous also when we consider the intensive margin. Higher tax rates decrease initial capital size and labor size because of the "income shifting" (for capital only) and "risk subsidy" channels, but they increase size through the "risk-sharing" channel.
Two implications are relevant for our analysis. First, the sign and size of the outcome of a change in corporate income taxation on the entry decision is not a priori clear. Second, the effect is unlikely to be constant across different values of the effective tax rate, and one could expect non-linear effects.
3
Data and variables
We take our dependent variables from yearly editions of the Amadeus database, published by Bureau van Dijk Electronic Publishing. We col-lect data on individual companies from 17 European countries (Austria, Belgium, Denmark, Finland, France, Germany, Greece, Ireland, Italy, Lux-embourg, Netherlands, Norway, Portugal, Spain, Sweden, Switzerland and the United Kingdom). We focus on companies that incorporated between 1997 and 2004 and were active in 39 manufacturing and business-related service industries. Da Rin, Di Giacomo, and Sembenelli (2009) describe these data in more detail. We use information from Amadeus to build our
three dependent variables.
The entry rate at the country-industry level (ENTRY-COUNTRY-INDUSTRY) is given by the ratio between the number of new firms that incorporate in a given year, country, and industry and the number of in-cumbents in the same year, country, and industry.
The initial capital size of entrants (CAPITAL-SIZE) is given by the me-dian value, at country-industry level, of entrants’ total assets (transformed in natural logarithm) in the year after incorporation.
Finally, the initial labor size of entrants (LABOR-SIZE) is given by the median number, at country-industry level, of entrants’ employees (trans-formed in natural logarithm) in the year after incorporation.
Table 1 reports some figures about the composition of our sample of entrants. We deal with more than 2.5 million firms. About 2 million of them report information on CAPITAL-SIZE, while data on LABOR-SIZE are available for less than one million companies. Over time, we observe an increasing number of entrants with a decreasing size, especially after 2001. This may be due to more refined data collection practices by the data provider, as a larger number of younger and smaller firms are included over time. However, it may also be due to complex industry and country dynamics, as a larger number of smaller firms incorporate with different intensity across industries, especially after the recession at the turn of the century. Since we are unable to disentangle these effects, relying on panel data is reassuring, since it allows us to control for changes in data collection practises both over time and across countries.
Our explanatory variables are taxation and business policy. For corpo-rate taxation we build the “effective average tax corpo-rate" (TAX-EATR) using the methodology proposed by Devereux and Griffith (1998). The effective average tax rate has the advantage, over other measures sometimes used in empirical work, of being theoretically grounded and relevant for discrete corporate investment choices such as the decision to incorporate. We com-pute TAX-EATR using information from the Worldwide Corporate Tax Guide published by Ernst&Young, a leading multinational tax consulting firm. TAX-EATR is a non-linear function of the statutory tax rate, which varies across countries and time, and of the expected rate of return, that varies across industries and time.3
Our second dependent variable, PRO-BUSINESS-POLICY, is the
In-3
We assume that an industry’s rate of return in any European country can be proxied by the rate of return in the U.S. industry, measured at 2-digit NACE Revision 1 classi-fication code level. We obtain industry-level profitability from OECD STAN database. Using averages across European countries or industries does not affect our results.
dex of Economic Freedom published yearly by the Heritage Foundation and the Wall Street Journal. We use this measure to account for a coun-try’s policy towards new business creation. This variable accounts for the fact that the entry decision and firm scale at entry are influenced not only by taxation but also by other economic policies.
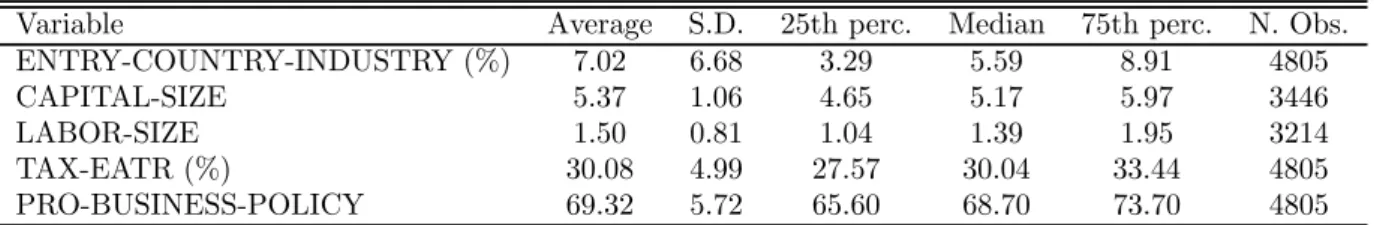
Table 2 presents descriptive statistics for our sample. The average rate of entry is 7%, and the average effective corporate income tax rate is 30%. CAPITAL-SIZE and LABOR-SIZE both point to a very low average (and median) initial size. These aggregate statistics hide a significant between-country variation, that may be due to both differences in industry dynamics across countries and to differences in data collection practices across countries.
4
Empirical analysis
4.1
Econometric strategy
We estimate three different specifications of the following relationship: = + g( −1)0γ+ x
0
−1β+ + (1)
where is one of our three dependent variables:(i)
ENTRY-COUNTRY-INDUSTRY, the entry rate at time in industry and country ; (ii) CAPITAL-SIZE, the (median) capital size reported by entrants at time , in industry and country ; and (iii) LABOR-SIZE, the (median) labor size reported by entrants at the end of year , in industry , country .
Our main explanatory variable is −1, the lagged effective tax rate (TAX-EATR) that varies across time, industries and countries. We allow TAX-EATR to have a non-linear effect. The variable is a time effect that
we model introducing a set of year dummies. The vector x−1 is PRO-BUSINESS-POLICY, that proxies for any time-varying, country-specific policies towards firm creation.
The last two terms in Equation (1) are unobservable error components. The term is a time-invariant, country-industry specific effect that cap-tures any unobserved characteristics that are relevant for the entry and the scale decisions. Since our explanatory variables may be correlated with , we use the standard within-group transformation to remove it. The term is an idiosyncratic error term that varies across the three dimensions
of our panel dataset. We cluster standard errors at country-industry level. To consistently estimate the parameters γ and β, once the model has been transformed in deviations from country-industry specific means, we
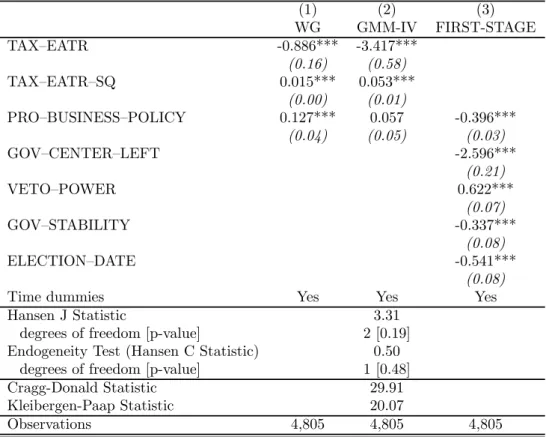
need lack of correlation between the regressors and the idiosyncratic error term at all leads and lags. Since this strong exogeneity assumption is un-likely to hold in our setting, we use a set of instruments to deal with the endogeneity of TAX-EATR (and of PRO-BUSINESS-POLICY). For this, we borrow from the recent political economy literature four measures of the political process: the ideological orientation of the government (GOV-CENTER-LEFT, a dummy for center-left chief executive party, from the World Bank’s Database of Political Institutions); the degree of political veto power (VETO-POWER, a count of the number of political parties in the coalition, from the World Bank’s Database of Political Institutions); the perceived stability of the government (GOV-STABILITY, a survey measure from the International Country Risk Guide); and the date of elec-tion (ELECTION-DATE, a dummy equal to one in elecelec-tion years). This set of instruments has been selected on the basis of appropriate specifica-tion tests for instrument validity (Hansen J and C statistics) and relevancy (Cragg-Donald and Kleibergen-Paap tests).
4.2
Results
We start by looking at the effect of taxation on the extensive margin. Ta-ble 3 reports estimation results where the dependent variaTa-ble is ENTRY-COUNTRY-INDUSTRY. Estimation results from our main specification, GMM-IV, are reported in column (2), with the pseudo-first stage reported in column (3). Both the validity of our set of instruments and the exogene-ity of the PRO-BUSINESS-POLICY variable are not rejected by the data, according to he Hansen J and C statistics. Also the null of weak identifica-tion is rejected according to both the Cragg-Donald and Kleibergen-Paap tests. For comparison, we report in column (1) within-group estimates, that rely on the strong exogeneity assumption.
With either approach, the coefficients on TAX-EATR and its square (TAX-EATR-SQ) are both significant at conventional levels and have op-posite signs. As expected, PRO-BUSINESS-POLICY affects positively the entry rate. The GMM-IV estimates imply that a reduction of cor-porate tax rate from the median (30.04%) to the first quartile (27.57%) leads to a 0.880 percentage point increase in the entry rate. A reduction from the third quartile (33.44%) to the median leads to a 0.270 percentage point increase in the entry rate. This result is consistent with the “income shifting" and “risk subsidy" effects of a reduction of effective corporate taxation being stronger at lower levels of taxation, and the “risk-sharing" effect becoming stronger at higher levels.
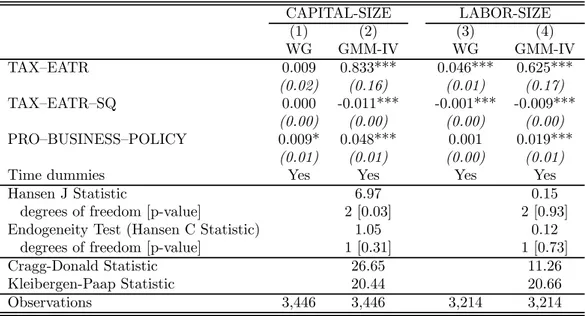
We then turn to the intensive margin. Table 4 reports results from our second specification. Columns (1) and (2) report within-group and GMM-IV estimates when CAPITAL-SIZE is the dependent variable, while in columns (3) and (4) the dependent variable is LABOR-SIZE.4In both cases we find that, unlike the results on entry rates, the relationship between capital size and taxation is positive, significant, and (slowly) decreasing in TAX-EATR. Also PRO-BUSINESS-POLICY affects positively the size of entrants.
Since the dependent variables are expressed in logs, the estimated coef-ficients should be interpreted as semi-elasticities. Computed at the median, a one unit increase in TAX-EATR augments CAPITAL-SIZE by as much as 16.1% under the GMM-IV specifications in column (2).Correspondingly, a unit increase in TAX-EATR, computed at the median, involve a 7.5% increase in LABOR-SIZE. These results, taken together, point to a smaller scale of entrants as the tax burden lowers. This finding is not in line with Cullen and Gordon’s model where the two margins are predicted to move in the same direction. It is however consistent with taxation being an entry cost which raises the minimum efficient entry scale.
4.3
Robustness
We check the robustness of our results against three sets of assumptions. In all cases the effect of taxation on entry rates and size retains its magnitude and remains significant. First, we experimented with alternative measures of CAPITAL-SIZE and LABOR-SIZE. we estimate the main specifications when CAPITAL-SIZE and LABOR-SIZE are computed as the average (in-stead of median) of the (log transformed) total assets, and number of em-ployees, of all firms in the same country-industry-year, respectively. Sec-ond, we examined the assumptions underlying the computation of TAX— EATR. These include alternative composition of the investment in terms of asset type, the way the new company is financed, and a wide range of alternative economic depreciation rates. Finally, we address the exogeneity of PRO—BUSINESS—POLICY. Even if our endogeneity tests do not reject the null of exogeneity for PRO—BUSINESS—POLICY, we run additional GMM-IV estimates, where PRO—BUSINESS—POLICY is treated as en-dogenous and instrumented with the same variables used for TAX—EATR and TAX—EATR—SQ.
4
We do not report the pseudo-first stage results since they are substantially identical to those in Table 3, except for the smaller number of observations.
5
Concluding remarks
In this paper we empirically investigate the relationship between effective corporate income taxation and entry (by incorporation) of new companies and their initial capital and labor size, exploiting a newly constructed panel dataset which allows us to improve significantly on the existing literature. On the whole, there is strong evidence that corporate income taxation affects both on the entry decision and the size of newly incorporated firms. Lower corporate tax rates enhance entrepreneurial entry (the "extensive margin" effect) and reduce the initial size of entrants (the "intensive mar-gin" effect). These effects are non-linear, as their magnitude decreases with the initial tax rate. Following the literature on the role of entry costs and regulation, we interpret the corporate tax burden as an entry cost, whose reduction may increase the number of entrants and reduce their initial capital and labor size.
References
[1] Aghion, Philippe, and Peter Howitt (2006). “Joseph Schumpeter lec-ture: Appropriate growth policy: A unifying framework.” Journal of the European Economic Association, 4(2-3), 269 —314.
[2] Alesina, Alberto, Silvia Ardagna, Giuseppe Nicoletti and Fabio Schi-antarelli (2005). “Regulation and investment.” Journal of the Euro-pean Economic Association, 3(4), 791—825.
[3] Ardagna, Silvia, and Annamaria Lusardi (2009). “Where Does Regu-lation Hurt? Evidence From New Businesses Across Countries.” Har-vard University Working Paper.
[4] Ardagna, Silvia, and Annamaria Lusardi (2010). "The effect of reg-ulation on entrepreneurship: Evidence across countries." Journal of the European Economic Association, forthcoming.
[5] Bertrand, Marianne, and Francis Kramarz (2002). “Does Entry Reg-ulation Hinder Job Creation? Evidence from the French Retail Indus-try.” The Quarterly Journal of Economics, 117(4), 1369—413.
[6] Cullen, Julie, and Roger Gordon (2007). “Taxes and Entrepreneur-ial Activity: Theory and Evidence for the U.S.” Journal of Public Economics, 91(7-8), 1479—1505.
[7] Da Rin, Marco, Marina Di Giacomo, and Alessandro Sembenelli (2009). “Entrepreneurship, Firm Entry, and the Taxation of Corpo-rate Income: Evidence from Europe." CentER Discussion Paper n. 65.
[8] Devereux, Michael, and Rachel Griffith (1998). “The Taxation of Dis-crete Investment Choices.” IFS Working Paper N. 98/16.
[9] Djankov, Simeon, Tim Ganser, Caralee McLiesh, Rita Ramalho, and Andrei Shleifer (2008). “The effect of corporate taxes on investment and entrepreneurship.” NBER Working Paper n. 13756.
[10] Klapper, Leora, Luc Laeven and Raghuram Rajan (2006). “Entry Regulation as a Barrier to Entrepreneurship.” Journal of Financial Economics 82(3), 591—629.
[11] Kerr, William, and Ramana Nanda (2009). “Democratizing Entry: Banking Deregulations, Financing Constraints and Entrepreneur-ship.” Journal of Financial Economics, forthcoming.
[12] Kerr, William, and Ramana Nanda (2010). "Banking Deregulations, Financing Constraints and Firm Entry Size," Journal of the European Economic Association, forthcoming.
[13] Rajan, Raghuram, and Luigi Zingales (1998). “Financial dependence and growth." American Economic Review, 88(3), 559—586.
Table 1. Descriptive statistics (firm-level)
CAPITAL-SIZE LABOR-SIZE
Year Entrants firms
with data Average (Euros) Median (Euros) firms with data Average Median 1997 131,812 96,765 3,970.08 148.50 63,326 52.79 3.00 1998 244,339 197,286 5,369.80 70.91 75,918 32.77 3.00 1999 281,266 228,353 5,261.95 78.49 88,599 32.60 3.00 2000 305,204 243,244 6,300.46 76.03 90,963 35.64 3.00 2001 301,859 245,815 4,925.00 77.57 90,830 25.39 3.00 2002 369,899 315,862 2,391.11 64.12 100,728 19.14 3.00 2003 437,146 378,027 2,223.85 47.96 102,253 16.08 2.00 2004 446,811 363,761 2,585.50 72.00 110,975 17.48 2.00 Total 2,518,336 2,069,113 3,830.03 70.30 723,592 27.34 3.00
Note: Year is year of incorporation. All figures are in numbers, except when noted otherwise. Monetary values are deflated using the HCPI index by Eurostat.
Table 2. Descriptive statistics (industry-country-year level)
Variable Average S.D. 25th perc. Median 75th perc. N. Obs.
ENTRY-COUNTRY-INDUSTRY (%) 7.02 6.68 3.29 5.59 8.91 4805
CAPITAL-SIZE 5.37 1.06 4.65 5.17 5.97 3446
LABOR-SIZE 1.50 0.81 1.04 1.39 1.95 3214
TAX-EATR (%) 30.08 4.99 27.57 30.04 33.44 4805
PRO-BUSINESS-POLICY 69.32 5.72 65.60 68.70 73.70 4805
Table 3. Results for ENTRY—COUNTRY—INDUSTRY (1) (2) (3) WG GMM-IV FIRST-STAGE TAX—EATR -0.886*** -3.417*** (0.16) (0.58) TAX—EATR—SQ 0.015*** 0.053*** (0.00) (0.01) PRO—BUSINESS—POLICY 0.127*** 0.057 -0.396*** (0.04) (0.05) (0.03) GOV—CENTER—LEFT -2.596*** (0.21) VETO—POWER 0.622*** (0.07) GOV—STABILITY -0.337*** (0.08) ELECTION—DATE -0.541*** (0.08)
Time dummies Yes Yes Yes
Hansen J Statistic 3.31
degrees of freedom [p-value] 2 [0.19]
Endogeneity Test (Hansen C Statistic) 0.50
degrees of freedom [p-value] 1 [0.48]
Cragg-Donald Statistic 29.91
Kleibergen-Paap Statistic 20.07
Observations 4,805 4,805 4,805
Note: CAPITAL-SIZE and LABOR-SIZE are logarithmic transformations of the original numbers. Standard errors (in parenthesis) are robust to heteroscedasticity and autocorrelation. * Significant at 10%. ** Significant at 5%. *** Significant at 1%.
Table 4. Results for CAPITAL-SIZE and LABOUR-SIZE CAPITAL-SIZE LABOR-SIZE (1) (2) (3) (4) WG GMM-IV WG GMM-IV TAX—EATR 0.009 0.833*** 0.046*** 0.625*** (0.02) (0.16) (0.01) (0.17) TAX—EATR—SQ 0.000 -0.011*** -0.001*** -0.009*** (0.00) (0.00) (0.00) (0.00) PRO—BUSINESS—POLICY 0.009* 0.048*** 0.001 0.019*** (0.01) (0.01) (0.00) (0.01)
Time dummies Yes Yes Yes Yes
Hansen J Statistic 6.97 0.15
degrees of freedom [p-value] 2 [0.03] 2 [0.93]
Endogeneity Test (Hansen C Statistic) 1.05 0.12
degrees of freedom [p-value] 1 [0.31] 1 [0.73]
Cragg-Donald Statistic 26.65 11.26
Kleibergen-Paap Statistic 20.44 20.66
Observations 3,446 3,446 3,214 3,214
Note: CAPITAL-SIZE and LABOR-SIZE are logarithmic transformations of the original numbers. Standard errors (in parenthesis) are robust to heteroscedasticity and autocorrelation. * Significant at 10%. ** Significant at 5%. *** Significant at 1%.