DOTTORATO DI RICERCA IN
BIOINGEGNERIA
Ciclo XXVI
Settore Concorsuale di afferenza: 09/G2 - Bioingegneria
Settore Scientifico disciplinare: ING-INF/06 - Bioingegneria elettronica e informatica
SYMBOLIC DYNAMICS ANALYSIS: A NEW METHODOLOGY FOR
FOETAL HEART RATE VARIABILITY ANALYSIS
Presentata da: Ing. Giovanni Improta
Coordinatore Dottorato
Relatore
Prof.ssa Elisa Magosso
Prof. Mario Cesarelli
Correlatore
Ing. Maria Romano
Contro-relatore
Prof. Angelo Cappello
I
TABLE OF CONTENTS
ABSTRACT – Italian ... 1
ABSTRACT – English ... 3
INTRODUCTION ... 5
CHAPTER 1 ... 10
Physiology of the cardiovascular system and Heart Rate Variability ... 10
1.1 Anatomy and physiology ... 10
1.1.1 Physiology of the cardiovascular system ... 10
1.1.2 The conduction system ... 13
1.1.3 Cardiovascular control mechanisms ... 14
1.2 Heart Rate Variability ... 16
1.3 Heart Rate diagnostic methods ... 18
1.3.1 The ECG signal ... 18
CHAPTER 2 ... 21
Foetal cardiovascular system and uterine physiology ... 21
2.1 Cardiovascular system ... 21
2.1.1 Physiology of the foetal cardiovascular system ... 21
2.1.2 Conduction system and control mechanisms ... 23
2.2 Uterine physiology ... 24
CHAPTER 3 ... 28
Diagnostic methods... 28
3.1 Foetal Heart Rate diagnostic methods ... 28
3.1.1 Foetal electrocardiography ... 28
3.1.2 Phonocardiography... 29
3.1.3 Magnetocardiography ... 30
3.1.4 Ultrasound techniques ... 31
3.1.5 Cardiotocography ... 32
3.2 FHR parameters and characteristics ... 35
II
CHAPTER 4 ... 44
Heart Rate Variability Analysis ... 44
4.1 Introduction ... 44
4.2 Time Domain Analysis ... 44
4.2.1 Statistical methods ... 45
4.2.2 Geometrical methods ... 47
4.2.3 Summary table of HRV time–domain measures ... 49
4.3 Frequency Domain Analysis ... 51
4.3.1 Spectral components ... 53
4.3.2 The spectrum of FHRV signal ... 55
4.3.3 Short Time Fourier Transform ... 60
4.3.4 Autoregressive Method ... 60
4.3.5 Lomb Method... 62
4.3.6 Frequency analysis of FHRV: Matching Pursuits Method ... 62
4.4 Main nonlinear techniques ... 63
4.4.1 Entropy measures ... 64
4.4.2 Poincarè maps ... 66
4.4.3 Fractal analysis ... 69
4.5 Other nonlinear techniques... 69
4.5.1 Detrended Fluctuation Analysis (DFA) ... 69
4.5.2 Hidden Markov Models ... 70
4.5.3 The Lyapunov Exponent ... 70
4.5.4 Hypothesis tests based on surrogate data ... 71
4.6 Symbolic Dynamic Analysis: theory and literature overview ... 71
4.7 HRV non-linear analysis: a brief literature report ... 80
4.8 FHRV non-linear analysis: a brief literature report ... 82
4.8.1 Symbolic Dynamics Analysis: applications to FHRV ... 85
CHAPTER 5 ... 87
CTG signals ... 87
5.1 Real CTG traces ... 87
5.1.1 Database ... 87
5.1.2 CTG signal pre-processing ... 87
5.1.3 CTG signal processing for classical analysis ... 91
5.2 Simulated CTG traces ... 93
CHAPTER 6 ... 97
Methodologies employed for FHRV analysis ... 97
III
6.2 FHRV definition and estimation ... 97
6.3 Time Domain: STV ... 98
6.4 Frequency Domain ... 100
6.4.1 Literature Overview ... 101
6.4.2 Definition of PSD and bandwidths by means of simulation ... 103
6.4.3 STFT and power computation ... 105
6.5 Nonlinear techniques ... 106
6.5.1 Entropy measurements... 106
6.5.2 Poincarè plots parameters ... 107
6.6 Symbolic Dynamics ... 107
6.6.1 Signal Preprocessing ... 107
6.6.2 The symbolic encoding ... 108
6.6.3 Words of symbols definition (world length) and analysis ... 109
6.6.4 Words classification ... 110 6.6.5 Variability Index ... 111 6.7 Statistical analysis ... 113
CHAPTER 7 ... 115
Results ... 115 7.1 Introduction ... 1157.2 Ranges of values of the chosen parameters ... 116
7.3 Apgar ... 117
7.4 Kind of delivery ... 119
7.5 Week of gestation ... 122
7.5.1 Time domain parameters ... 122
7.5.2 Frequency domain parameters ... 123
7.5.3 Non-linear indexes ... 126
7.6 Foetal status ... 129
7.7 Comparison between Variability Index and frequency parameters ... 132
7.8 Summary table of the statistical results ... 135
CONCLUSIONS ... 136
APPENDIX A ... 140
Non-linear methods for HRV and FHRV analysis: further details ... 140
A.1 Principal Dynamic Models ... 140
A.2 The Lyapunov Exponent ... 142
IV
APPENDIX B ... 144
Non-linear methods for HRV and FHRV analysis: literature details ... 144
B.1 Summary table – HRV analysis: literature review ... 144
B.2 Summary table – FHRV analysis: literature review ... 150
REFERENCES ... 154
Thesis references ... 154
Appendix A references ... 172
V
LIST OF FIGURES
Figure 1.1 - Longitudinal section of heart. Source: Medline Plus. (2013). Heart, section through the middle [Online]. Available: http://www.nlm.nih.gov/ medlineplus/ency/imagepages/18093.htm (last access January 2015) ... 12 Figure 1.2 - Conduction of the action potential in physiological conditions. Source: Mayo Foundation for Medical Education and Research. MayoClinic.com Health Library [Online]. Available: http://www.riversideonline.com/health_reference/disease-conditions/ds00947.cfm (last access January 2015) ... 14 Figure 1.3 - Einthoven Triangle. Source: Biomedical Engineering Lab 355 [Online]. Available:http://noodle.med.yale.edu/staib/bme355/ecg/prep.htm (last access January 2015) ... 19 Figure 1.4 - A normal ECG Waveform. Source: Merck Manuals - Cardiovascular disorders. Standard ECG components [Online]. Available: http://www.merckmanuals.com/ professional/cardiovascular_disorders/cardiovascular_tests_and_procedures/electrocardiograp hy_ecg.html#v931664 (last access January 2015) ... 19 Figure 2.1 - On the right and on the left, different pictures of foetal blood circulation [2] ... 23 Figure 2.2 - Uterus or womb [2] ... 26 Figure 3.1 - Insertion of a catheter through intrauterine applicator. Source: The Brookside Associates
[Online]. Available: http://www.brooksidepress.org/
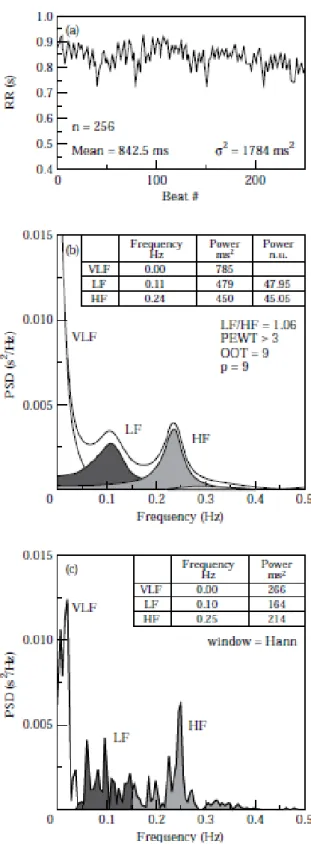
Products/Obstetric_and_Newborn_Care_II/images/MD0922_img_12.jpg (last access January 2015) ... 35 Figure 3.2 - Mean FHR versus week of gestation [2] ... 37 Figure 3.3 - On the top example of late deceleration, on the bottom relative UC [2] ... 39 Figure 3.4 - Types of variability. Source: Medical Quick Review of Basics. Obstetrics [Online]. Available: https://drkamaldeep.files.wordpress.com/2011/01/jpg.png (last access January 2015) ... 41 Figure 4.1 - Relationship between the RMSSD and pNN50 (a), and pNN50 and NN50 (b) measures of HRV assessed from 857 nominal 24-h Holter tapes recorded in survivors of acute myocardial infarction [1] ... 46 Figure 4.2 - To perform geometrical measures on the NN interval histogram, the sample density distribution D is constructed, which assigns the number of equally long NN intervals to each value of their lengths [1] ... 48 Figure 4.3 - Interval tachogram of 256 consecutive RR values in a normal subject at supine rest (a). The HRV spectra are shown, calculated by parametric autoregressive modelling (b) and by a FFT based non-parametric algorithm (c) [1]. ... 52 Figure 4.4 - Spectral analysis (autoregressive model, order 12) of RR interval variability in a healthy subject at rest and during 90° head-up tilt. The normalized representation makes clearer the relative change of the components of interest [1]... 53
VI
Figure 4.5 - Example of an estimate of power spectral density obtained from the entire 24-h interval of a long term Holter recording. Only the LF and HF component correspond to peaks of the spectrum while the VLF and ULF can be approximated by a line in this plot with logarithmic scales on both
axes. The slope of such a line is the a measure of HRV [1] ... 54
Figure 4.6 – Example of HRV spectrum (up) [53] and FHRV spectrum (bottom) [2] ... 55
Figure 4.7 – HRV power spectrum between 10-5 and 10-1 Hz (VLF) [73] ... 56
Figure 4.8 - Analysis of the spectral power density foetal. (a) and (b) refer to a foetus at 26 weeks gestation, (c) and (d) to one of 36 weeks. Furthermore, the higher figures are relative to analyzes carried out during periods of rest of the foetus and lower in the presence of respiratory movements. Under the figures, shows the frequencies investigated, in Hz, and the relative power density, P, in percent [125] ... 57
Figure 4.9 - Lobe abnormalities in low frequency with gestational age and, in the second column, the same age but in periods of activity. VS is the acoustic stimulation which causes the awakening of the foetus [2, 127] ... 59
Figure 4.10 - Poincarè plots: a) healthy subjects; b) subjects with myocardial infarction [63] ... 68
Figure 5.1 - Zero order effect ... 88
Figure 5.2 - Green stars: detected outliers ... 91
Figure 5.3 - Screen shot of an example of analysis results ... 93
Figure 5.4 - Simulated CTG signal with two accelerations, one deceleration and two uterine contractions ... 95
Figure 5.5 - FHR simulated with signal loss (gradual the first, between 250 and 270 s, and abrupt the others, around at 520 and 780 s), arrhythmia (PVC) and isolated outliers. ... 96
Figure 6.1 - In red STV time trend superimposed on FHRV in back (STV is equal to 2.87) ... 100
Figure 6.2 - Mean power spectrum of the FHR signal ... 104
Figure 6.3 - Mean power spectrum of the detrended FHR signal ... 104
Figure 6.4 - Mean power spectrum of the FHRV (floatingline subtraction) ... 104
Figure 6.5 - Mean power spectrum of the floatingline ... 105
Figure 6.6 - CTG # 228 (internal numbering of our database). V.I. = 0.53 ... 112
Figure 6.7 - CTG # 127(internal numbering of our database). V.I. = 0.14, CS ... 112
Figure 6.8 - Histogram of word classes for the CTG # 228 shown in figure 6.6 ... 113
Figure 6.9 - Histogram of word classes relative to the CTG # 127 shown in figure 6.7 ... 113
Figure 7.1 - Distribution of average occurrences of WC computed for CS (on the left) and foe SD (on the right) ... 121
Figure 7.2 - Box-and-whisker plots of V.I. values for spontaneous deliveries (SD) and caesarean sections (CS). ... 122
VII
Figure 7.4 - Regression graph with trend line equation and R2 relating the power mean value in VLF
(0-0.03) Hz to the gestational week ... 124
Figure 7.5 - Regression graph with trend line equation and R2 relating the power mean value in LF and HF to the gestational week... 124
Figure 7.6 - Regression graph with trend line equation and R2 relating the percentage power value in VLF to the gestational week ... 125
Figure 7.7 - Regression graph with trend line equation and R2 relating the percentage power value in LF and HF to the gestational week ... 125
Figure 7.8 - Regression graph with trend line equation and R2 relating the V.I. to the gestational week ... 126
Figure 7.9 - Regression graph with trend line equation and R2 relating the Poincarè SD1 to the gestational week ... 127
Figure 7.10 - Regression graph with trend line equation and R2 relating the Poincarè SD2 to the gestational week ... 127
Figure 7.11 - Regression graph with trend line equation and R2 Sample Entropy to the gestational week ... 128
Figure 7.12 - Example of FHR recorded from a foetus at rest ... 131
Figure 7.13 - Example of FHR recorded from a foetus in an active state ... 131
Figure 7.14 – Variability Index and as a function of LF (left) and HF power (right) ... 133
Figure 7.15 - Variability Index and its relationship with total FHR spectral power ... 133
VIII
LIST OF TABLES
Table 3.1 - Conditions that increase or reduce Variability ... 42 Table 4.1 - Selected time-domain measures of HRV [1] ... 50 Table 4.2 - Main steps of Symbolic Dynamics Analysis ... 79 Table 6.1 - Values reported in literature of bands of FHRV power spectrum (Lower, “l”, and upper, “u”, boundaries) ... 102 Table 6.2 - Values reported in literature of mean and percentage power ... 103 Table 6.3 - Coding 5 symbols ... 109 Table 6.4 - Criterion of dominance for sorting the words generated with floating window of length equal to 7 ... 110 Table 7.1 - Range of variability of the time domain index ... 116 Table 7.2 - Range of variability of different parameters in frequency domain ... 116 Table 7.3 - Value of the mean, standard deviation, maximum and minimum value for non-linear V.I., SampEn and SD1 and SD2 ... 116 Table 7.4 – p values for APG1. The number of CTG traces of both groups of low and normal APG1 is indicated on the first row. Time and Frequency domain parameters as well as non-linear indexes are distinguished ... 117 Table 7.5 - Association between APG and VI (* for p<0.05; ** for p<0.005; ns for not significant) ... 119 Table 7.6 - p values for kind of delivery. The number of CTG traces of both groups of spontaneous deliveries and cesarean sections is indicated on the first row. Time and Frequency domain parameters as well as non-linear indexes are distinguished ... 120 Table 7.7 - Spontaneous and caesarean values for V.I. and p value ... 121 Table 7.8 – Regression coefficients for all the computed parameters ... 129 Table 7.9 - p values for APG1. The number of CTG traces of both groups of low and high APG1 is indicated on the first row. Time and Frequency domain parameters as well as non-linear indexes are distinguished ... 132 Table 7.10 - Statistical test (t-test) for Apgar1 (Low vs Normal), Kind of Delivery (Cesarean vs Spontaneous) and Foetal Status (Rest vs Active) ... 135 Table 7.11 – Objectives of the thesis achieved or not ... 139
1
ABSTRACT – Italian
Introduzione:
La Cardiotocografia (CTG) risulta essere, nella pratica clinica, una tecnica di diagnostica fetale piuttosto diffusa sia per il monitoraggio “ante partum” che “intra partum”. Benché abbia valore legale in Italia ed altri paesi, presenta dei forti limiti nell’interpretazione dei tracciati registrati. In particolare, siccome il tracciato CTG viene sottoposto ad un’ispezione visiva, la sua interpretazione soffre di una forte variabilità intra- e inter- osservatore, rendendo di conseguenza la valutazione dello stato del feto fortemente soggettiva e difficilmente riproducibile. Al fine di superare i vincoli esposti, negli ultimi anni sono stati proposti numerosi metodi di interpretazione dei segnali di frequenza cardiaca fetale (FHR) e, più in generale, dei tracciati CTG. Particolare attenzione è stata rivolta alla stima della variabilità della frequenza cardiaca (FHRV), parametro legato allo stato del Sistema Nervoso Autonomo del feto.
Nel presente lavoro abbiamo suddiviso le tecniche adottate per l’analisi della FHRV in metodiche tradizionali, anche dette – per ragioni storiche – lineari, e metodiche meno convenzionali, altrimenti dette non-lineari. Delle prime fanno parte l’analisi nel dominio del tempo e della frequenza, mentre tra le seconde trovano posto tecniche originariamente utilizzate nell’analisi delle dinamiche dei sistemi non-lineari e caotici e successivamente estese allo studio dei sistemi biologici e della variabilità del ritmo cardiaco, spesso in combinazione con le metodologie classiche. Tutte le metodiche descritte nella presente tesi si sono rivelate particolarmente efficaci in casi specifici. Tuttavia, nessuna si è dimostrata di maggiore utilità o rilievo rispetto alle altre. Pertanto, abbiamo ritenuto necessario effettuare un’indagine dettagliata ed approfondita delle tecniche di analisi della FHRV presenti in letteratura.
In particolare, scopo della tesi è stato approfondire una specifica metodologia non-lineare, la Symbolic Dynamics Analysis (SDA), essendo già stata applicata con promettenti risultati all’analisi della variabilità cardiaca di soggetti adulti e, solo in pochi casi, nell’ambito fetale. Data la notevole semplicità di interpretazione che la caratterizza, questa tecnica potrebbe risultare un potenziale strumento di ausilio all’attività clinica e di efficace supporto al monitoraggio fetale.
Materiali e metodi:
Sono stati esaminati all’incirca 200 riferimenti bibliografici riguardanti l’analisi della variabilità del ritmo cardiaco sia nell’adulto che nel feto; di questi, circa 100 articoli specificamente incentrati sull’utilizzo di tecniche non-lineari.
A seguito dell’accurato esame della letteratura, sono state selezionate, revisionate, aggiornate ed implementate le seguenti metodologie di analisi:
Analisi nel dominio del tempo: calcolo della Short Term Variability (indice della
variabilità battito-battito del ritmo cardiaco);
Analisi nel dominio della frequenza: calcolo delle potenze assolute e percentuali in
ciascuna delle bande dello spettro della FHRV mediante Short Time Fourier Transform;
Analisi non-lineari: calcolo dell’Entropia Campionaria, dei parametri forniti dalle
mappe di Poincarè e dell’indice di variabilità ottenuto con la SDA.
E’ stata quindi condotta un’analisi multiparametrica allo scopo di realizzare un confronto fra le metodologie adottate ed individuarne i reciproci vantaggi e svantaggi nel monitoraggio fetale. Oggetto dello studio sono stati 580 tracciati CTG, registrati in ambiente clinico, di feti sani tra la 24ma e la 42ma settimana di gestazione.
2
Sono stati inoltre aggiornati gli algoritmi di elaborazione dei dati e dei segnali acquisiti e sono stati realizzati due software, uno per l’analisi dei segnali CTG reali ed un altro per la generazione di segnali CTG simulati a supporto dello studio condotto.
Infine, sono stati effettuati test statistici e prodotti grafici di regressione per esaminare le possibili correlazioni tra gli indici calcolati con l’analisi dei segnali ed alcuni parametri di interesse clinico quali il punteggio di Apgar, il tipo di parto (cesareo o spontaneo), le settimane di gestazione e lo stato fetale (attivo o a riposo).
Risultati e conclusioni:
Dai risultati ottenuti si evince che:
Nessuno degli indici calcolati risulta più vantaggioso rispetto agli altri. L’uso combinato di più parametri potrebbe invece essere di maggiore utilità all’analisi e alla valutazione della FHRV.
In accordo con la letteratura, lo stato del feto e le settimane di gestazione sono parametri di riferimento che dovrebbero essere sempre tenuti in considerazione per ogni tipologia di analisi effettuata.
Per quanto concerne la SDA, essa risulta uno strumento utile all’analisi della FHRV, riuscendo a distinguere – meglio o al pari di altre tecniche – lo stato del feto e la settimana di gestazione e, in alcuni casi, il tipo di parto. In aggiunta, essa consente di stimare correttamente e con maggiore semplicità rispetto ad altre tecniche (come l’analisi nel dominio del tempo) la variabilità complessiva di un segnale FHR. D’altra parte, sono necessari ulteriori studi per confermare queste evidenze. In particolare, tali studi dovrebbero includere anche casi di feti patologici al fine di valutare l’affidabilità dei parametri lineari e non nel discriminare feti in stato di buona o cattiva salute.
3
ABSTRACT – English
Introduction:
External Cardiotocography (CTG) is one of the most widespread diagnostic methods in clinical practice for checking foetal conditions both in the ante- and intra-partum period. However, even though it has legal value in Italy and in some other countries, it lacks of objectivity and reproducibility because of its dependence on observer's expertise and training.
In order to overcome these limitations, more objective methods for CTG interpretation have been proposed in recent years. In particular, many developed techniques aim to assess the foetal heart rate variability (FHRV), since its demonstrated relationship with the foetal Autonomous Nervous System functional state. Among them, some methodologies previously developed from nonlinear systems theory have been applied to the study of FHRV, often combined with more traditional analyses in time and frequency domain. All the techniques examined in this thesis have proved their validity and helpfulness in specific cases. Nevertheless, none of them seems to be more suitable or reliable than the others. Therefore, an in-depth study of these methods is necessary.
The aim of the present work is to deepen the FHRV analysis through the Symbolic Dynamics Analysis (SDA), a nonlinear technique - already applied with positive results to the adults and, in some cases, to the foetus - which allows a simple description of a system’s dynamics by means of a limited amount of symbols and proper classification schemes. Thanks to its simplicity of interpretation, it could be a useful tool for clinicians in foetal monitoring.
Materials and methods:
We have performed an accurate literature study involving about 200 references on the heart rate variability analysis both in adults and foetuses; among them, approximately 100 works were focused on the application of non-linear techniques.
Then, we selected, reviewed, updated and implemented the following methods:
Time domain analysis: Short Term Variability (beat to beat heart rate variability index)
computation;
Frequency domain analysis: absolute and percentage power computation for each of the
FHRV spectral bands by means of Short Time Fourier Transform;
Non-linear analyses: Sample Entropy, Poincarè maps and SDA parameters computation.
A multiparametric study has been carried out in order to compare the adopted methodologies and evaluate their strength and weakness points in supporting FHR monitoring. 580 antepartum recordings of healthy foetuses from the 24th to the 42th gestation week were examined. CTG traces were recorded by healthy patients during the clinical practice, using commercially available cardiotocographs.
Moreover, CTG signals were processed and analyzed using a developed and updated software for CTG analysis along with a new developed software for generating simulated CTG traces.
Finally, statistical tests and regression analyses were performed for estimating the relationships among indexes extracted from the adopted methodologies of FHRV analysis and other clinical data, such as Apgar score (low or normal), kind of delivery (cesarean or spontaneous), week of gestation (from the 24th and the 42th) and foetal status (active or at
4 Results and conclusions:
The obtained results confirm that:
None of the chosen indexes and employed techniques is more suitable or reliable than the others. Differently, each one should be used along with the others, complementing them in order to improve the FHRV evaluation.
In agreement with the literature, each implemented analysis should take into account two relevant parameters, i.e. the foetal status (active or at rest) and the week of gestation.
As far as the Symbolic Dynamics is concerned, results confirm its usefulness and promising capabilities in the FHRV analysis. In fact, it allows recognizing foetal status and - in some cases - the kind of delivery and it is strongly correlated with the gestation week and, therefore, with the foetal development. In addition, it allows an accurate estimate of the global variability of foetal heart rate signals, even better than other methods such as the time domain analysis. Nevertheless, further studies are necessary to establish and definitively confirm the reliability of this parameter. In particular, they should involve pathological cases in order to compare the reliability of linear and non-linear parameters in distinguishing healthy from non-healthy foetuses.
5
INTRODUCTION
Background
In adults, experimental evidence for an association between a propensity for lethal arrhythmias and signs of either increased sympathetic or reduced vagal activity has encouraged the development of quantitative markers of autonomic activity. Heart rate variability (HRV) represents one of the most important such markers. However, the significance and meaning of the many different measures of HRV are more complex than generally appreciated and there is a potential for incorrect conclusions and for excessive or unfounded extrapolations [1].
Similarly, a significant relationship between the autonomic nervous system (ANS) and cardiovascular function was also found in foetuses. The analysis of foetal heart rate (FHR) signals represents a non-invasive, fundamental tool for checking foetal conditions in the ante-partum period. Among many techniques to provide information about foetal health, external Cardiotocography (CTG) is the most diffused indirect, diagnostic method in clinical practice, during last pregnancy stage and labour. CTG is based on the simultaneous recording of FHR and UC (Uterine Contractions) [2]. Important conditions such as foetal distress are evaluated from the cardiotocographic tracings, generally by means of clinicians' eye inspection, who evaluate specific clinical signs (FHR mean value, FHR variability, FHR accelerations, FHR decelerations, and foetal movements). Nevertheless, the efficiency of this method depends on observer's expertise and training, but obviously it lacks of objectivity and reproducibility and it is subject to human error [2]. For this reason, many researchers have attempt to make the recognition of some specific parameters more reliable, introducing the computerized analysis. Besides, to improve CTG analysis, more objective methods for CTG interpretation are of crucial importance; therefore, considerable efforts have been spent and several analysis methodologies have been proposed in recent years [90]. It has been demonstrated that also for the foetus, variability of the HR around its mean value, namely FHR variability (FHRV),
6
could be a valid support for a more objective analysis and for a better knowledge of ANS reactions and its functional state [101].
The traditional analysis of FHRV (time and frequency domain analysis) provide significant noninvasive parameters to investigate the cardiac autonomic modulation; however, many studies have shown some limitations in describing the nonlinear structure of the sympatho-vagal interactions. Therefore, in recent years, methods previously developed from nonlinear systems theory have been applied to biological system analysis and, in particular, to the study of heart rate variability.
Nevertheless, to date, no methods neither traditional or nonlinear has yet proved to be superior to the other or completely reliable in foetal health evaluation or in reducing the number of false positive in CTG interpretation.
This thesis focus the attention on the Symbolic Dynamic Analysis (SDA), a nonlinear technique which allows a simple description of a system’s dynamics by means of a limited amount of symbols and appropriate classification schemes, which has already got some success both in HRV and FHRV studies [84, 155].
Research aims
The purpose of this research is to deepen the analysis of the signal FHRV, and, therefore, knowledge of the autonomic nervous system that can result, through a method called "Symbolic Dynamics Analysis" (SDA), already applied with positive results to the analysis of HRV of the adult, and in some cases to the foetus. We also propose to verify the contribution and the advantages that it can offer compared to traditional linear and nonlinear FHRV. All these methodologies aim to expand the range of information available to the physician, therefore improving the specificity of CTG, currently very low, in spite of its legal value.
Thus, this work mainly aims to carry out a multiparametric study by means of traditional (in time and frequency domain) and nonlinear techniques to compare different FHRV analysis methodologies and evaluate their strength and weakness points in supporting the FHR monitoring. A special attention is given to the Symbolic
7
Dynamics Analysis, a non-linear method that has been quite recently employed in literature to analyse foetal heart rate variability.
In carrying out a study so wide, more goals have been also achieved, listed below:
development of a software for the analysis of the CTG traces, in order to reach a better signal pre-processing and processing, improving FHRV analysis performances and enhance data elaboration and visualization of the obtained information;
development of a software for simulating FHR signals, as a useful tool to support the validation of the software for real CTG traces elaboration and the evaluation of the different adopted techniques for FHRV analysis;
study of literature concerning linear and nonlinear methods in order to identify those most used and more effective for FHRV analysis;
comparison of the results obtained by linear and nonlinear analysis, assessing usefulness and reliability of the computed indexes by means of statistical tests and regression graphs;
proposal of a well defined methodology for evaluation of FHRV both in time and frequency domain, not yet available in literature despite to the wide use of this signal.
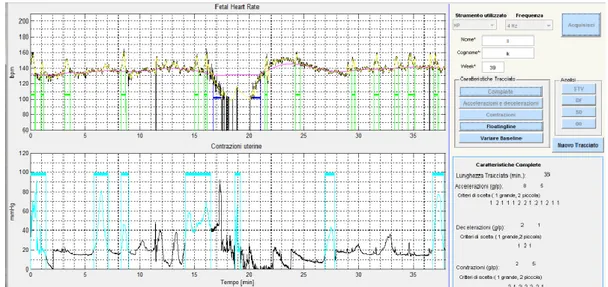
With regards to the developed software for analyze real CTG traces, it includes a simple interface, so it can be used even by non-experts, and provides estimates of:
The series real FHR not evenly sampled;
Percentage of beats lost and interpolated;
The mean value and the oscillation of the baseline of the FHR signal;
The number and kind of accelerations and decelerations;
The presence of uterine contractions;
Indices of short term variability;
Indices from FHR signal spectrum;
The variability indices calculated according to the SDA.
As far as the simulated CTG signals, they were used to test the performance of the above described software. The developed software for CTG simulation will generate
8
artificial signals that simulate the actual CTG recordings. It will facilitate the comparison between different processing methods of the signals to determine their performance and also could be used also as a tool teaching for medical students. Besides, over 100 articles published between 1996 and 2014 were analyzed in order to verify the state of the art about the application of nonlinear methods to the study of the heart rhythm. They cover both the foetus and the adult, from which usually part when studying the heart rhythm. For each technique considered to have been highlighted advantages and disadvantages, also in relation to the experimental results obtained.
It was then made a review of the nonlinear methods and examined their applicability for analysis of foetal heart rate and adult patients. The main advantage of the indexes of HRV is that they can be calculated in real time in a non-invasive way, while all biomarkers currently used in clinical practice involve the taking of blood samples for analysis and in no case could be used for the fetus that is not directly accessible.
The foetal heart rate is a signal not evenly sampled and contains artifacts and noise, the study carried out on nonlinear techniques has shown that nonlinear methods are also useful for the classification of foetal heart segments of short duration and that is promising for further research.
In order to compare the results obtained with the linear and non-linear analysis and hence to individuate the best methodology, were then calculated different indices. Following the bibliographic study, to evaluate the reliability of the different linear and non-linear FHRV indices calculated, were carried out statistical tests and regression analysis to examine FHR signals recorded in a clinical setting in order to classify the foetuses in relation to:
Apgar score;
Kind of delivery (cesarean or spontaneous).
Week of gestation;
9
Thesis structure
The presented thesis is organized in seven chapters as follows:
Chapter 1: description of the physiological and anatomical principles related to the cardiovascular system of adult subjects along with an explanation of the role of ECG diagnostic methods and heart rate variability characteristics;
Chapter 2: description of the foetal cardiovascular system development and principles of uterine physiology;
Chapter 3: presentation of the main foetal heart rate diagnostic techniques, parameters and features;
Chapter 4: overview of the main linear and non-linear methodologies for HRV and FHRV analysis, with an in-depth description dedicated to the Symbolic Dynamics Analysis and a literature report of relevant studies and works on the HRV and FHRV analysis;
Chapter 5: description of the analyzed data (real and simulated CTG traces) along with processing and pre-processing techniques characterization;
Chapter 6: presentations and discussion of the employed analysis methods;
10
CHAPTER 1
Physiology of the cardiovascular system and
Heart Rate Variability
1.1 Anatomy and physiology
1.1.1 Physiology of the cardiovascular system
The cardiovascular system is a closed and continually active system. It can be considered as a machine consisting of defined components with their own functional roles and mechanics. This system ensures the transport and distribution to tissues of essential substances, such as respiratory gases (oxygen, carbon dioxide) and nutrient materials (aminoacids, glucose and fatty acids), and the elimination of metabolic waste products (degradation products of nutrients).
Moreover, the cardiovascular system is involved in the control of metabolic mechanisms, such as body temperature regulation, chemical messages transport for the communication between different points of the organism and oxygen and nutrients inflow regulation under various physiological conditions.
This apparatus consists of a central engine, the heart, a muscular organ that ensures the circulation of the blood (a fluid consisting of a suspension of cells in an aqueous medium that contributes to the oxygen and nutrients transport) through its rhythmic contractile activity, and a closed system of elastic tubes with different structures, which are:
the arteries, which convey the blood from the heart to the periphery;
the capillaries, the lightest and microscopic vessels whose walls are constituted by a single layer of cells exchanging oxygen and nutrients with surrounding tissues and collecting carbon dioxide and metabolic waste;
11
the veins, which convey the blood from the periphery to the heart, thereby closing the circle.
The heart is formed by two pumps in series: the first pushes the blood into the lungs to exchange oxygen and carbon dioxide (pulmonary circulation) while the second pushes the blood into all tissues of the organism (systemic circulation). In order to fulfill its function, the heart is divided from a vertical median septum into a right and a left section and it is composed of four chambers, two atria and two ventricles. Four heart valves allow blood to flow either from one chamber to another or out of the heart in a forward direction by generating adequate intracavitary pressures to overcome resistance and permit blood ejection. The right and the left section of the heart are divided into an upper part, thin-walled chamber called atrium, which acts as a collection chamber, and a lower part, lager and thick-walled chamber called ventricle, which acts as a chamber of expulsion with greater contractile energy than the atrium. The right atrium communicates with the underlying right ventricle through a valve which consists of three flaps and therefore called the tricuspid; the left atrium, similarly, communicates with the left ventricle through a valve consisting of two flaps and called mitral. Under physiological conditions, these two valves allow the blood to flow in one direction only, from the atrium to the ventricle, thereby preventing the backflow from the ventricles to the atria. The two atria are separated by a wall of tissue called interatrial septum while the two ventricles are separated by the interventricular septum. The right atrium receives blood from the superior vena cava, which collects all the blood of the upper half of the body (head, brain, neck and arms), the inferior vena cava, which drains all the blood of the lower half of the body (venous blood, therefore deoxygenated) and the coronary sinus, which conveys the effluent from the heart. Blood flows from the right atrium into the right ventricle through the tricuspid valve and - from here – into the pulmonary artery through the pulmonary valve. Through this artery and its branches, the blood is pumped into the pulmonary circulation and, then, to the pulmonary capillaries that exchange oxygen with the atmospheric air. The oxygenated blood is then collected by the venules and, later, flows from pulmonary veins into the left atrium. Here, the blood flows into the left ventricle through the mitral valve and into the
12
aorta through the aortic valve. Through this artery and its ramifications, the blood is pushed into the systemic circulation up to the capillaries supplying nutrition to the tissues. The blood is then collected in the venous vascular system and - through the superior vena cava and the inferior vena cava - comes back to the right atrium. The role of the pulmonary and aortic semilunar valves is crucial because they prevent the backflow of the blood from the great arteries (pulmonary and aorta) to the ventricles [2].
Figure 1.1 - Longitudinal section of heart. Source: Medline Plus. (2013). Heart, section through the middle [Online]. Available: http://www.nlm.nih.gov/
medlineplus/ency/imagepages/18093.htm (last access January 2015)
The cardiac cycle is divided into a systolic phase, coinciding with the ventricular contraction, and a diastolic phase coinciding with the release ventricular. In particular, whereas the left ventricle when the latter begins to contract the ventricular pressure increases rapidly, as the ventricular volume does not vary since the atrioventricular valve closes to prevent reflux of blood from the ventricle to the atrium while the aortic valve is not yet open. When the ventricular pressure exceeds the aortic one, the valve opens and starts the ejection of blood. At this point, the pressure decreases until the gradient between the ventricle and the aorta is reversed, but the aortic valve is still open closes due to the energy accumulated during the first part of systole. At the closing of the aortic valve, ventricular pressure
13
decays rapidly, but the volume remains constant because the atrioventricular valve is not yet open. The opening of the atrioventricular valve, there is a rapid ventricular filling and, subsequently, when the atrium has emptied the accumulated blood in the ventricle, ventricular filling continues a slower, controlled directly by the venous return. This phase ends with the atrial systole which, however, is only partially effective, given the lack of valves from the venous side [2].
1.1.2 The conduction system
The electrical activity of the heart is the basis of the functioning of the cardiovascular system, for this is very often subjected to diagnostic and therapeutic monitoring. The cardiac electrical activity originates in the sinoatrial node, located in the upper zone of the right atrium, which acts as a pacemaker, and then propagates through a preferential way, indicated by the term “beam Bachmann” to the lobby spooky. Through further preferential ways the pulse is also conducted to the atrioventricular node located between the atria and ventricles at the lower front part of the atrial septum. Here, the signal is subject to a specific delay, such as to allow the filling of the ventricles with blood during the contraction of the atria. From here, the electric pulse propagates through a specific conduction beam called “bundle of His” and which is divided successively into two branches, the right and the left one, until then Purkinje fibers that form a real network of fibers in close contact with the muscle tissue of the ventricles. This procedure run is illustrated in the following figure [2].
14
Figure 1.2 - Conduction of the action potential in physiological conditions. Source: Mayo Foundation for Medical Education and Research. MayoClinic.com Health Library [Online].
Available: http://www.riversideonline.com/health_reference/disease-conditions/ds00947.cfm (last access January 2015)
1.1.3 Cardiovascular control mechanisms
There is a difference in the rate of reaction to stimuli produced by the two branches of the vagus and sympathetic system. The physiological mechanisms of feedback control regulate the magnitudes considering loops with different propagation delays of the useful signal that travels along them, generating fluctuations in the rhythm at different frequencies and contributing to the spectrum of HRV in a manner significantly different depending on the specific range of frequencies associated with them.
In adults, the three main loops which are based on physiological processes homeostatic regulation and involved in the definition of the total variability of HR are:
Loop of breathing: breathing movements are triggered by pulses sent by the centers in the brain respiration. With the inspiration there is an increase in intrathoracic pressure, a decrease in the pulsatory volume, then a decrease in cardiac output, and a decrease in blood pressure. This reduction in pressure is detected by baroreceptors that send the corresponding information relating to the brain centers, which generate a signal of inhibition of vagal tone, signal which of course has the
15
effect of unbalancing the sympatho-vagal balance more on the side of the sympathetic causing an increase in heart rate, then the range and therefore of the pressure. The reverse mechanism occurs during the exhalation phase. In this way there is an oscillatory component of the HRV signal, defined by the name of respiratory sinus arrhythmia, synchronous with the respiratory rate, which corresponds to a spectral lobe in the range 0.15 to 0.40 Hz, centered around 0.3 Hz, which goes under the name component of HF (High Frequency) signal HRV. This component reflects vagal activity, as is confirmed by the significant reduction of the relative power following the administration of drugs blocking the vagus (such as atropine) [1, 2].
Loop of baroreceptor reflexes: baroreceptors detect pressure changes and send the corresponding information to the afferent brain centers from which impulses start and this situation causes an increase in heart rate, to compensate a decreasing in blood pressure, or a reduction of the same otherwise. There is the creation of a rhythmic component of HRV signal, called "Rhythm of 10 s", synchronous with fluctuations of blood pressure, known as "waves Mayer", which corresponds to a lobe in the spectral range 0.04 to 0.15 Hz, centered around 0.12 Hz, which goes under the name of component LF (Low Frequency) signal HRV. The frequency of fluctuations is determined by the time of delay of the system and increases with the increase in sympathetic tone. The LF component of HRV signal is mainly linked to the activity of the sympathetic nerve [1, 2].
Loop thermoregulatory and slow control mechanisms: the thermodynamic phenomena are characterized by very long transient. Consequently, the loop of thermoregulation, which reduces or increases thermogenesis irradiation in case of temperature above the threshold of wellbeing, and vice versa if the temperature drops below the setting threshold, is responsible for fluctuations in heart rate that develop in long periods and, therefore, the so-called component VLF (Very Low Frequency) signal HRV, ranging from DC to approximately 0.04 Hz. The phenomenon is linked, as a result of temperature changes, to changes in peripheral vascular resistance and blood pressure, which, by means of baroreceptor reflexes, results in slow fluctuations HR. The VLF component, such as LF, is mediated by both
16
the sympathetic and the vagal nerve, but noted a prevalence of incidence of the first [145].
It should be noted that other factors are also responsible of changes in sympatho-vagal balance and heart rate variability. These include the circadian rhythm, posture, the behavioral state and age. For example, the HR variability increases in the last months of gestation of the foetus and in the early months of the infant's life (which corresponds to the completion of the maturation of the nervous system and, therefore, the differentiation of its two sections of the vagus and sympathetic) while, in adults, decreases with age (and this reduction in non-pathological conditions, is likely to be of interest in the same way all the spectral bands, while leaving unchanged the sympatho-vagal balance) [132].
1.2 Heart Rate Variability
Although cardiac automaticity is intrinsic to various pacemaker tissues, heart rate and rhythm are largely under the control of the autonomic nervous system. There is a two-way communication system between the heart and the brain that regulates heart rate and blood pressure and it is the interaction of signals flowing between the two that causes the heart rate to vary with each beat. The sympathetic branch increases heart rate and the secretion of adrenal hormones, etc., whereas the parasympathetic slows heart rate and has a relaxing, protective role. Proper function and balance between the two branches of the ANS is important for good health. The parasympathetic influence on heart rate is mediated via release of acetylcholine by the vagus nerve. The sympathetic influence on heart rate is mediated by release of epinephrine and norepinephrine. Under resting conditions, vagal tone prevails and variations in heart period are largely dependent on vagal modulation. The vagal and sympathetic activity constantly interact. The RR interval variations present during resting conditions represent a fine tuning of the beat-to-beat control mechanisms. Vagal afferent stimulation leads to reflex excitation of vagal efferent activity and inhibition of sympathetic efferent activity. The opposite reflex effects are mediated by the stimulation of sympathetic afferent activity.
17
Efferent vagal activity also appears to be under ‘tonic’ restraint by cardiac afferent sympathetic activity. Efferent sympathetic and vagal activities directed to the sinus node are characterized by discharge largely synchronous with each cardiac cycle which can be modulated by central (e.g. vasomotor and respiratory centres) and peripheral (e.g. oscillation in arterial pressure and respiratory movements) oscillators. These oscillators generate rhythmic fluctuation in efferent neural discharge which manifest as short and long-term oscillation in the heart period. Analysis of these rhythms may permit inferences on the state and function of the central oscillators; the sympathetic and vagal efferent activity; humoral factors and the sinus node [2].
An understanding of the modulator effects of neural mechanisms on the sinus node has been enhanced by spectral analysis of HRV. The efferent vagal activity is a major contributor to the HF component. More controversial is the interpretation of the LF component which is considered by some as a marker of sympathetic modulation (especially when expressing it in normalized units) and by others as a parameter that includes both sympathetic and vagal influences. Spectral analysis of 24-h recordings shows that in normal subjects LF and HF expressed in normalized units exhibit a circadian pattern and reciprocal fluctuations, with higher values of LF in the daytime and of HF at night. These patterns become undetectable when a single spectrum of the entire 24-h period is used or when spectra of subsequent shorter segments are averaged. In long-term recordings, the HF and LF components account for approximately 5% of total power. Although the ULF and VLF components account for the remaining 95% of total power, their physiological correlates are still unknown. LF and HF can increase under different conditions. In studies researching HRV, the duration of recording is dictated by the nature of each investigation. Standardization is needed, particularly in studies investigating the physiological and clinical potential of HRV. Recording of approximately 1 min is needed to assess the HF components of HRV while approximately 2 min are needed to address the LF component. In order to standardize different studies investigating short-term HRV, 5 min recordings of a stationary system are preferred unless the nature of the study dictates another design. Averaging of spectral components obtained from sequential
18
periods of time is able to minimize the error imposed by the analysis of very short segments. Nevertheless, if the nature and degree of physiological heart period modulations changes from one short segment of the recording to another, the physiological interpretation of such averaged spectral components suffers from the same intrinsic problems as that of the spectral analysis of long-term recordings and warrants further elucidation.
Although the time–domain methods, especially the SDNN and RMSSD methods, can be used to investigate recordings of short durations, the frequency methods are usually able to provide more easily interpretable results in terms of physiological regulations. In general, the time–domain methods are ideal for the analysis of long-term recordings (the lower stability of heart rate modulations during long-long-term recordings makes the results of frequency methods less easily interpretable). The experience shows that a substantial part of the long-term HRV value is contributed by the day–night differences. Thus the long-term recording analysed by the time domain methods should contain at least 18 h of analysable ECG data that includes the whole night [1].
1.3 Heart Rate diagnostic methods
1.3.1 The ECG signalThe term ECG indicates the diagnostic technique that allows to explain the electrical activity of the heart via a recording of the time series of potential differences detected in one or more pairs of electrodes whose locations are called “lead”. The 12-lead electrocardiography traditional plans. The first three, called 'standard', are those obtained by projecting the electric dipole on the sides of an equilateral triangle called Einthoven triangle. In fact we apply the cardiac vector in the center of this triangle whose vertices are the pads connected to the right arm, left arm and left leg (for convenience usually the electrodes are allocated to the wrists and ankles) and the center is the heart [70].
19
Figure 1.3 - Einthoven Triangle. Source: Biomedical Engineering Lab 355 [Online]. Available:http://noodle.med.yale.edu/staib/bme355/ecg/prep.htm (last access January
2015)
In this configuration, we have that the potential difference between any pair of electrodes (or vertices) of the triangle is proportional to the projection of the electric dipole on the section joining the two vertices of interest. From the need to identify local values of potential and no differences occurred the idea to refer to a point in which the electrical activity was the average of points very distant from the source rate. Therefore the other nine leads, in particular the six precordial leads and the three increased, devolve the Wilson central terminal defined as the common electrical point or node of three equal resistors connected to the electrodes of the three limbs [70].
Figure 1.4 - A normal ECG Waveform. Source: Merck Manuals - Cardiovascular disorders. Standard ECG components [Online]. Available: http://www.merckmanuals.com/ professional/cardiovascular_disorders/cardiovascular_tests_and_procedures/electrocardiog
20
The following is a summary of the ECG wave morphologies and parameters that users can use as a guide to understand more about their ECG recordings.
P wave: The P wave results from atria contraction. P wave is generally about 1 box wide or 1 box tall. P wave that exceeds these might indicate atria hypertrophy, i.e., enlargement.
PR Interval: The PR interval is measured from the start of the P wave to the start of Q wave. It represents the duration of atria depolarization. Regular duration is from 0.12 to 0.20 seconds, about 3 to 5 box wide. If the PR interval is greater than 0.20 seconds, then an AV block might be present.
QRS Complex: The QRS complex is measured from the start of Q wave to the end of S wave. It represents the duration of ventricle depolarization. Regular duration is from 0.08 – 0.12 seconds, about 2 to 3 box wide. If duration is longer, it might indicate presence of bundle branch blocks.
QT/QTc: The Q T/QTc is measured from the start of the Q wave to the end of T wave. QT interval represents the duration of activation and recovery of the ventricular muscle. This duration varies inversely with the heart rate. The regular QTc is approximately 0.41 seconds or an accurate measurement, it is corrected with the heart rate with the following formula to get QTc:
QTc = QT + 1.75 (HR – 60)
ST Segment: The ST segment is measured from end of S wave, J point, to the start of T wave. This segment is important in identifying pathology such as myocardial infarctions (elevations) and ischemia (depressions).
21
CHAPTER 2
Foetal cardiovascular system and uterine
physiology
2.1 Cardiovascular system
2.1.1 Physiology of the foetal cardiovascular system
The foetal circulation is one of the first systems to need to be able to function properly in order to sustain the foetus. Before a circulatory system has developed, nutrients and oxygen diffuse through the extraembryonic coelom and yolk sac from the placenta. As the embryo increases in size, its nutrient needs increase and the amount of tissue easily reached by diffusion decreases. Hence the circulation must develop quickly and accurately.
However, throughout the foetal stage of development, the maternal blood supplies the foetus with O2 and nutrients and carries away its wastes. These substances
diffuse between the maternal and foetal blood through the placental membrane. In the foetal circulatory system, the umbilical vein transports blood rich in O2 and nutrients from the placenta to the foetal body. The umbilical vein enters the body through the umbilical ring and travels along the anterior abdominal wall to the liver. About 1/2 of the blood passes into the liver. The other 1/2 of the blood enters a vessel called the ductus venosus of Aranzio which bypasses the liver. The ductus venosus travels a short distance and joins the inferior vena cava. There, the oxygenated blood from the placenta is mixed with the deoxygenated blood from the lower parts of the body. This mixture continues through the vena cava to the right atrium. In the adult heart, blood flows from the right atrium to the right ventricle then through the pulmonary arteries to the lungs. In the foetus the lungs are
non-22
functional and the blood largely bypasses them. As the blood from the inferior vena cava enters the right atrium, a large proportion of it is shunted directly into the left atrium through an opening called the foramen ovale. A small valve, septum primum is located on the left side of the atrial septum overlies the foramen ovale and helps prevent blood from moving in the reverse direction. The rest of the foetal blood entering the right atrium, including a large proportion of the deoxygenated blood entering from the superior vena cava, passes into the right ventricle and out through the pulmonary trunk. Only a small volume of blood enters the pulmonary circuit, because the lungs are collapsed, and their blood vessels have a high resistance to flow. Enough blood reaches the lung tissue to sustain them. Most of the blood in the pulmonary trunk bypasses the lungs by entering a foetal vessel called the ductus arteriosus of Botallo which connects the pulmonary trunk to the descending portion of the aortic arch. The more highly oxygenated blood that enters the left atrium through the foramen ovale is mixed with a small amount of deoxygenated blood returning from the pulmonary veins. This mixture moves into the left ventricle and is pumped into the aorta. Some of it reaches the myocardium through the coronary arteries and some reaches the brain through the carotid arteries. The blood carried by the descending aorta is partially oxygenated and partially deoxygenated. Some of it is carries into the branches of the aorta that lead to various parts of the lower regions of the body. The rest passes into the umbilical arteries, which branch from the internal iliac arteries and lead to the placenta. There the blood is reoxygenated. Both ductus venosus of Aranzio and ductus arteriosus of Botallo are completely closed after birth.
It is worth mentioning that the concentration of haemoglobin in foetal blood is about 50 % greater than in maternal blood. Foetal haemoglobin is slightly different chemically and has a greater affinity for O2 than maternal haemoglobin. This is a sort
of safety mechanism; in fact because of this characteristic, foetus can overcome relatively short lacks of oxygen.
23
Figure 2.1 - On the right and on the left, different pictures of foetal blood circulation [2]
2.1.2 Conduction system and control mechanisms
Throughout the heart are clumps of specialized cardiac muscle tissue whose fibres contain only a few myofibrils. Electrical impulse originates in the Sinoatrial (S-A) Node (in the foetus, it is completely developed at 6th week of gestation), which consists of a small elongated mass of specialized muscle tissue just beneath the epicardium. Fibres are continuous with those of the atrial muscle fibres. Membranes of the nodal cells are in contact with each other and have the ability to excite themselves. Without being stimulated by nerve fibres or any other outside agents, the nodal cells initiate impulses that spread into the surrounding myocardium and stimulate the cardiac muscle fibres to contract; this activity is rhythmic.
The cardiac cycle refers to the repetitive pumping process that begins with the onset of cardiac muscle contraction and ends with the beginning of the next contraction. The duration of the cardiac cycle varies among people and also varies during an individual's lifetime. In an adult subject, the normal cardiac cycle (0.7-0.8 sec.) depends on two factors: capability of cardiac muscle to contract and functional integrity of the conducting system. Abnormalities of cardiac muscle, the valves, or the conducting system of the heart may alter the cardiac cycle and compromise the pumping effectiveness of the heart.
24
In a foetus, through labour and delivery, we can invasively record foetal heart electrical activity by means of direct scalp foetal ECG, attaching electrodes to the presenting part of the foetus after membrane rupture, and obtain an ECG signal very similar to those described for adults, even if with a lower amplitude. Otherwise, after 16th week’s gestation, we can adopt the external abdominal ECG, putting electrodes
on the maternal abdomen.
However, foetal heart rate variability is also intimately related to foetal central nervous system; particularly, the most important mechanism immediately involved in producing heart rate variability is the autonomic innervations of the heart. The cardioregulatory centre in the medulla oblongata regulates the parasympathetic and sympathetic nervous control of the heart.
Parasympathetic stimulation is supplied by the cardiac branches of the vagus nerve. It is of primary importance in producing beat-to-beat variability. It decreases heart rate and can cause a small decrease in the force of contraction (stroke volume). This component of cardiac innervations is well suited to a role of fine tuning the heart rate on a beat-to-beat basis because of the very rapid decrease in heart rate which occurs whit vagal nerve stimulation, and the nearly equally rapid recovery after the end of a series of impulses. Moreover, postganglionic neurones secrete acetylcholine which increases membrane permeability to K+, producing hyperpolarization of the
membrane.
Sympathetic stimulation is supplied by the cardiac nerves which are projections of the cervical sympathetic chain ganglia (spinal nerve). Sympathetic stimulation increases heart rate and force of contraction (stroke volume). Changes in heart rate with stimulation of cardiac sympathetic innervation are slower compared to stimulation of cardiac vagal innervations. Moreover, it dilates vessels in skeletal and cardiac muscle.
2.2 Uterine physiology
The human uterus is a massive, hollow, pear-shaped organ with a thick wall, situated deeply in the pelvic cavity between bladder and rectum. It is composed of two
25
distinct anatomic regions: the cervix and the corpus. The corpus is further divided into the lower uterine segment and the fundus. The cervix is a narrow cylindrical passage which connects at its lower end with the vagina. At its upper end, the cervix widens to form the lower uterine segment (isthmus); the lower uterine segment in turn widens into the uterine fundus. The corpus is the body of the uterus which changes in size and structure during pregnancy to accommodate itself to the needs of the growing embryo. Extending from the top of the uterus on either side are the fallopian tubes (oviducts); these tubes are continuous with the uterine cavity and allow the passage of an ovum (egg) from the ovaries to the uterus where the egg may implant if fertilized. Spatial organisation of the smooth muscle fibres in the uterine wall is complicated and still remains the matter of debate. The thick wall of the uterus is formed of three layers: endometrium, myometrium, and serosa or perimetrium. The endometrium (uterine mucosa) is the innermost layer that lines the cavity of the uterus. Throughout the menstrual cycle, the endometrium grows progressively thicker with a rich blood supply to prepare the uterus for potential implantation of an embryo. In the absence of implantation, a portion of this layer is shed during menstruation. The myometrium is the middle and thickest layer of the uterus and is composed of smooth (involuntary) muscle. The myometrium contracts during menstruation to help expel the sloughed endometrial lining and during childbirth to propel the foetus out of the uterus. The outermost layer, or serosa, is a thin fibrous layer contiguous with extrauterine connective tissue structures such as ligaments that give mechanical support to the uterus within the pelvic cavity. Non-pregnant uterine size and position varies with age and number of pregnancies.
26
Figure 2.2 - Uterus or womb [2]
Uterine wall structure is aimed to effective expulsion of foetus if pregnancy is about to terminate. Although biological mechanisms prevent massive contractions of uterus during pregnancy, the uterine wall never remains quiet. Every single muscle fibre possesses the possibility to change its membrane potential slowly, which results in depolarisation. Working potential that it generates may be transmitted to other cells in a close neighbourhood, but the area it can spread on strongly depends on local properties of signal propagation. In course of a physiological pregnancy the intercellular communication is poorly developed, which seems to be a mechanism of a foetus’ safety. This leads to the lack of coordination between muscle fibres which produces a kind of fibrillation of uterine wall with almost no significance rise of pressure inside its cavity. In a full term pregnancy, or in some pathological circumstances even sooner, uterine wall becomes well coordinated and uterine contractions frequent, intense, persistent and painful. Low resistance intercellular connections – gap junctions appear in a smooth muscle tissue enhancing trigger wave propagation. Even though there is no specialised trigger wave conducting system in uterus, gap junctions enable it to contract as a whole, presenting a specific pattern of contraction. The certain degree of synchronisation of smooth muscle cells amplifies uterine working potentials, since their appearance results from spatial and temporal summation of electrical activity of single fibres [3].
In spite of the fact that the uterine contractility is predominantly commanded by hormonal and biochemical factors (estrogens, oxytocin, prostaglandins), there are
27
indications that the sympathetic and parasympathetic innervations of the uterus may also have a considerable influence upon it. Independently of the majority of the uterine contractions being endocrinally and biochemically triggered, the myometrial contractile activity exhibits a very peculiar characteristic that seems to demonstrate the existence of a precise nervous coordination: it is the "triple descending gradient." This gradient gives to the uterine contractility its typical expulsive pattern.
Concerning their characteristics, uterine contractions become very rhythmic and regular in shape during labour, when the hypophysis releases a large dose of oxytocin. The contraction length ranges between 15 and 20 seconds at the begin of the labour and between 60 and 70 seconds at the end (expulsive period) [57]. Approximately at 20th week of gestation irregular contractions with very small amplitude, called Alvarez’s waves, are present. They represent a located muscular contraction. In physiological conditions, their frequency decreases and their amplitude increases with gestation progress. In the second period of gestation, a large part of the uterus contracts itself giving rise to Braxton-Hicks’ contractions, also slang called “preparations contractions”. After 30th week, these contractions gradually become more frequent and strong [4].
28
CHAPTER 3
Diagnostic methods
3.1 Foetal Heart Rate diagnostic methods
3.1.1 Foetal electrocardiographyFoetal electrocardiography (FECG) has been deeply studied, but its recording through multiple electrodes placed on the maternal abdomen makes difficult to obtain high quality signals; moreover, the automated evaluation of FECG is less accurate than CTG [5 - 7].
ECG is a graphical recording of the electrical potentials generated in association with heart activity. Aristotle first noted electrical phenomena associated with living tissues and Einthoven was able to measure the electrical activity of the heart in 1901 that resulted in the birth of electrocardiography [8]. In adults, as the heart is not directly accessible, cardiac electrical activity is usually inferred from measurements recorded at the surface of the body, e.g., at the arms, legs, and chest.
For foetuses, electronic foetal monitoring by means of ECG can be external (outside), internal (inside), or both.
Internal methods for acquiring the FECG are invasive because internal monitoring involves placement of a small plastic device about the size of a pencil eraser through the cervix. A spiral wire called the foetal scalp electrode is placed just beneath the skin of the foetal scalp. The foetal scalp electrode then transmits direct information about the FHR through a wire to the foetal monitor that prints out this information. Because the internal foetal monitor is attached directly to the baby, the FECG signal is sometimes much clearer and more consistent than with an external monitoring device. However, there may be a slight risk of infection with internal monitoring.
![Figure 1.1 - Longitudinal section of heart. Source: Medline Plus. (2013). Heart, section through the middle [Online]](https://thumb-eu.123doks.com/thumbv2/123dokorg/8153043.126482/21.892.231.662.364.691/figure-longitudinal-section-source-medline-heart-section-online.webp)
![Figure 2.1 - On the right and on the left, different pictures of foetal blood circulation [2]](https://thumb-eu.123doks.com/thumbv2/123dokorg/8153043.126482/32.892.139.752.127.378/figure-right-left-different-pictures-foetal-blood-circulation.webp)
![Figure 3.1 - Insertion of a catheter through intrauterine applicator. Source: The Brookside Associates [Online]](https://thumb-eu.123doks.com/thumbv2/123dokorg/8153043.126482/44.892.293.605.297.511/figure-insertion-catheter-intrauterine-applicator-source-brookside-associates.webp)
![Figure 3.3 - On the top example of late deceleration, on the bottom relative UC [2]](https://thumb-eu.123doks.com/thumbv2/123dokorg/8153043.126482/48.892.279.631.549.768/figure-example-late-deceleration-relative-uc.webp)
![Figure 3.4 - Types of variability. Source: Medical Quick Review of Basics. Obstetrics [Online]](https://thumb-eu.123doks.com/thumbv2/123dokorg/8153043.126482/50.892.169.730.174.742/figure-variability-source-medical-review-basics-obstetrics-online.webp)

![Figure 4.7 – HRV power spectrum between 10-5 and 10-1 Hz (VLF) [73]](https://thumb-eu.123doks.com/thumbv2/123dokorg/8153043.126482/65.892.276.614.447.745/figure-hrv-power-spectrum-hz-vlf.webp)