DOI: 10.1002/ett.4118
R E S E A R C H A R T I C L E
Remote sensing to control respiratory viral diseases
outbreaks using Internet of Vehicles
Yesin Sahraoui
1Ahmed Korichi
1Chaker Abdelaziz Kerrache
2Muhammad Bilal
3Marica Amadeo
41Kasdi Merbah University of Ouargla,
Ouargla, Algeria
2University of Ghardaia, Ghardaia, Algeria 3Hankuk University of Foreign Studies,
Yongin, Korea
4Mediterranea University of Reggio
Calabria, Calabria, Italy
Correspondence
C. A. Kerrache, University of Ghardaia, Ghardaia, Algeria.
Emails: [email protected]; [email protected]
Abstract
The respiratory viral diseases, such as those caused by the family of coro-naviruses, can be extremely contagious and spread through saliva droplets generated by coughing, sneezing, or breathing. In humans, the most common symptoms of the infection include fever and difficulty in breathing. In order to reduce the diffusion of the current “Coronavirus disease 2019 (COVID-19)” pandemic, the Internet of Things technologies can play an important role; for instance, they can be effectively used for implementing a real-time patient track-ing and warntrack-ing system at a city scale. Crucial places to install the tracktrack-ing IoT devices are the public/private vehicles that, augmented with multiple con-nectivity solutions, can implement the Internet of Vehicles paradigm. In such ubiquitous network environment, vehicles are equipped with a variety of sen-sors, including regular cameras that can be replaced with thermal cameras. Therefore, this article proposes a new design for widely detecting respiratory viral diseases that leverages IoV to collect real-time body temperature and breathing rate measurements of pedestrians. This information can be used to recognize geographic areas affected by possible COVID-19 cases and to imple-ment proactive preventive strategies that would further limit the spread of the disease.
1
I N T RO D U CT I O N
1.1
Background and challenges
The new era of the Internet of Things (IoT) innovations enables the smart vehicles to connect to the Internet and to sense and interact with the surroundings, such as pedestrians, roadside units (RSUs), and other smart vehicles. As a result, smart vehicles become the central players of the new Internet of Vehicles (IoV) paradigm.1,2
In IoV, the smart vehicles are equipped with sensors, active control systems, GPS receivers, cameras, and embedded storage and processing units.3These advanced capabilities not only enable services that enhance safety on the road, help to avoid traffic jam situations, provide entertainment contents, monitor the public healthcare,4and so on, but they also materialize the idea of Social Internet of Vehicles (SIoV).5
SIoV, also known as Vehicular Social Networks (VSN),6is an enhancement of IoV that adds a social dimension to it. In SIoV, the vehicles are capable of establishing social relationships with each other and are allowed to have their own social networks based on their common interests, contexts, goals, and intent for socializing.7
Trans Emerging Tel Tech. 2020;e4118. wileyonlinelibrary.com/journal/ett © 2020 John Wiley & Sons, Ltd. 1 of 17
With the sudden spread of viral diseases like COVID-19 across the world, many lives are under threat; especially older people and those with chronic diseases like cardiovascular disease, diabetes, and cancer are at high risk.8Thus, detecting the suspected cases has become paramount. This can be accomplished by tracking the most common symptoms of the disease, like body temperature and breathing state, through cameras equipped with thermal sensors. In particular, the idea of using remote sensing (RS) data is especially useful in epidemiology, and consists of capturing real-time information about an object or phenomenon, without making physical contact with it.9The collected information is then processed for generating knowledge about suspected cases.
Currently, the family of coronavirus diseases are diagnosed by polymerase chain reaction (PCR),10 a method that requires qualified technicians and specialized machines. In addition, the thermal sensors for real-time temperature checks are placed in hot spots, such as seaports, bus terminals, airports, and shopping malls. This approach has the following limitations:
• It uses small-scale diagnostics and in specific places only.
• It is expensive when using PCR techniques; moreover, it relies on the availability of highly specialized equipment and
expertise and takes a lot of time, which reduces the number of diagnosed cases.
• It lacks of information about virus spread locations, due to the absence of a unified database.
Therefore, it is necessary to design an enhanced tool that helps those on the front line to identity and quickly treat the newly infected people.
1.2
Solution and contributions
In this article, we propose a novel respiratory viral diseases detection method, which employs the IoV paradigm. To effectively identify the infected people and reducing the false positive and false negative results, we detect the suspected cases by considering two factors, namely, the breathing rate and the body temperature. In our design, we assume that the vehicles, managed by the police or health departments, are equipped with thermal cameras to detect the body temperature and breathing complications caused by the disease, and with a GPS device to track the location of suspected cases. By leveraging these technologies, we collect massive amount of real-time data from pedestrians on the streets and create live statistics in the form of geographic heatmaps. More specifically, the main contributions of this work are summarized as follows:
• We propose a new method that leverages IoV to identify, monitor, and control viral diseases outbreaks. The conceived
method allows to detect possible infections in a very short time at a country level, by covering urban and nonurban areas with accurate localization information.
• Real-time information, collected by vehicles, is delivered to edge computing server(s) where it is temporarily stored,
processed, and accessed by the interested consumers, for example, police, health department inspectors.
• We provide a simulation testing of the proposed model in order to evaluate its performance under a variety of metrics,
including the time for transferring the sensed information.
To the best of our knowledge, the proposed model is the first attempt to utilize IoV and remote sensing for the detection and prediction of respiratory viral diseases.
The rest of this article is organized as follows. We briefly present the related work about IoT-based healthcare, epidemic applications, and remote sensing in Section 2. We illustrate the proposed model for remote sensing based on IoV in Section 3. How to exploit our model for prevention is proposed in Section 4, while the performance evaluation is reported in Section 5. Finally, Section 6 concludes the work.
2
R E L AT E D WO R K
This section first presents a description of how IoT is used in healthcare systems, and devote a special focus on the detection of infectious epidemics that spread very quickly. Then, we highlight representative remote sensing works that leverage IoV. Table 1 compares and highlights the key differences between the considered related work.
T A B L E 1 Comparison of related work.
Reference Application domain Advantage Drawback
Communication support
Baker et al13 Healthcare monitoring - Comfortable solution for
monitoring the vital signs anywhere, anytime.
- Cloud security threats still the main concerns
WSN, Cloud
- Replacement or repair process of wearable nodes is very easy
Ginsberg et al,18Schmidt,19
Sandhu et al24
Epidemic detection - Simple method and easy to use
- Suffer from accuracy problem
Cloud
Gupta et al20 Healthcare monitoring - Reliable, low cost, and
secured framework
- The interference of WBAN
Cloud, WSN
Sareen et al21 Epidemic detection - Provides a high degree of
diagnostic accuracy
- The mobile phones typically have limited battery life
IoT, WSN, Cloud, MANET
- Cloud security issues Sareen et al22 Epidemic detection - Provides high accuracy in
early symptoms Consumes a lot of cloud computing resources IoT, WSN, Cloud - Cost-effective solution
Sun et al23 Epidemic detection - Rapid screening saves time - Tested only with
small samples
IoT
Mathew et al25 Epidemic detection, - Fast and accurate solution - Suffers from the high
cost factor
IoT, Cloud
Healthcare
Wang and Chen26 Air quality monitoring
via IoV
- Cost-effective solution - Rely on rewarding policy depending on the destination
WSN, VANET
Mathur et al27 Monitoring parking
space availability via IoV
- High detection accuracy for parking spaces availability
- Limited battery lifespan for smartphone WSN, Cloud, MANET, VANET - Cost-effective solution
Dey et al28 Vehicular traffic
application
- Produce traffic updates, and road conditions in real time
- Detect only few types of vehicles
WSN, IoT, IoV, Cloud
2.1
IoT applications in healthcare
IoT solutions in healthcare have becoming popular in recent years thanks to their capability of improving the qual-ity of life of patients, by providing the ubiquitous medical services. Healthcare systems enable remote monitoring and real-time diagnosing of diseases, and even remote surgeries over the Internet. Data analysis, detection of critical events, and definition of rehabilitation strategies become automated processes, with low human intervention.
Several works have already discussed the benefits and research perspectives of IoT healthcare systems. For instance, the authors in Reference 11 give an overview of the IoT applications in the healthcare industry. First, they identify the enabling communication and sensing technologies and classify the existing smart healthcare devices and applica-tions. Then, they identify the key problems for designing smart healthcare systems, including resource and big data management. The crucial role of social networking in this field is however not investigated.
Similarly, Alqahtani et al in Reference 12 reviewed the IoT solutions for remote healthcare monitoring systems, and its applications in industry and business, and highlighted some issues and challenges.
Baker et al in Reference 13 identified the key components of an end-to-end IoT healthcare system, and proposed a hierarchical model that includes the following main components. At the user side, wearable sensors measure the physio-logical conditions and report them to a close central node, which processes the sensed information and may implement some simple decision making. Interactions between sensors and the central node are enabled by short-range communi-cation technologies such as Bluetooth. Remotely, a secure cloud storage and machine learning framework collects all the data to make them easily accessible by specialists and nurses and supports advanced processing through artificial intel-ligence techniques. Long-range communication technologies, such as 3G or low-power wide-area networks (LP-WAN), are used to enable the interactions between central nodes and the remote framework.
The authors in Reference 14 presented the Internet of Health Things (IoHT) concept and summarized the existing services and applications in the field. They recognize that the current solutions are mainly growing isolated and lack of interoperability and flexibility.
In recent years, IoT-based healthcare systems are further improving their diagnosis accuracy thanks to the use of artificial intelligence techniques15,16and to the deployment of advanced strategies that reduce the energy consumption and costs.17
Our article deals with the use of IoT technology to detect viral respiratory infections like COVID-19. Being this lat-ter a very recent disease, to the best of our knowledge, there are no IoT-based healthcare systems specifically devoted to it. However, some solutions for epidemic detection can be identified in the literature, as explained in the next section.
2.2
Applications in epidemics detection
To control the spread of contagious diseases, existing works have proposed distinct approaches that range from the use of IoT technologies coupled with cloud computing to fog computing and social sensing. In the following, we discuss some of them.
Ginsberg et al in Reference 18 presented a detection method based on social sensing for epidemics of seasonal influenza. The proposal relies on the numbers of Google search queries to track influenza-like illness in the population of web search users. However, the limited accuracy of this approach makes it ineffective in practice. A similar approach was proposed by Schmidt in Reference 19, where messages posted by people on social media were used to predict and track disease outbreaks.
Gupta et al in Reference 20 designed a distributed framework for remote health monitoring that leverages wear-able body area networks (WBAN) and sensor-cloud technology to efficiently retrieve data from the body sensors. An algorithm is deployed to minimize the effects of inter-WBAN interference and provide fast, reliable, energy-efficient, and fault-tolerant communications.
Sareen et al in Reference 21 designed a cloud-based monitoring system for a crowd of patients that uses mobile devices, wireless sensor technology, and fog computing for predicting and preventing the Zika Virus outbreak. A GPS system is used to display the infected users with over 90% accuracy. The same authors in Reference 22 proposed a framework based on radio frequency identification devices (RFIDs), wearable body sensor technology, and cloud computing to detect and monitor the Ebola virus disease, using the J48 decision tree to categorize infected users. The lack of an autonomous system to sense data about secondary and advanced symptoms led however to a decrease of efficiency.
Sun et al in Reference 23 proposed a combined visible and thermal image processing approach that uses a CMOS camera equipped with infrared thermography to remotely sense multiple vital signs and to rapidly and accurately screen patients who are suspected of carrying infectious diseases. Based on the measured vital signs, a logistic regression function is used to predict the possibility of infection within 10 seconds. The system has been proved to be effective in presence of small data samples, but its performance in real-world settings has not been evaluated.
Sandhu et al in Reference 24 presented an architecture for scanning and controlling the influenza A(H1N1) pandemic using social network analysis and cloud computing. The proposed architecture is tested on a synthetic data set gener-ated for two million users, but further accuracy and reliability of the predictions are needed, when collecting data from unreliable sources, such as individual users.
Mathew et al in Reference 25 proposed a smart IoT-based disease surveillance system that relies on a main server, located in every hospital, which automatically stores and processes patients’ records. If dangerous infections are detected, the information is immediately transmitted to the Health Ministry though a central backbone network. By doing so, proper countermeasures can be quickly implemented to reduce the spreading of disease. However, the system suffers from high
cost, since it requires a dedicated network infrastructure, and it may lack of accuracy, since data are only captured in specific hot spots.
2.3
Remote sensing using IoV
Connected vehicles are provided with a variety of sensors that may gather multiple information about the surrounding environment. So far, the majority of the works have focused on the deployment of smart cities applications targeting traffic control, and air quality monitoring.29 To improve the performance, social interactions have been also considered between vehicles.
For instance, Hu et al in Reference 30 proposed a VSN architecture that tracks the concentration of carbon diox-ide (CO2) gas remotely, based on GSM short messages and geographic information of vehicles. Data are collected in an edge server, which uses Google Maps to illustrate the result. In the same context, the authors in Reference 26, leverage remote sensing and VSN to assess the air quality in metropolitan areas. An efficient data gathering and estimation mecha-nism is implemented, which demonstrates a significant effectiveness under various scenarios. Vehicle drivers may receive rewards based on their reports sent to the edge server. However, since drivers cannot control the sampling rates of their cars, the architecture needs improved monitoring accuracy.
Mathur et al in Reference 27 designed an application named ParkNet, which combines smartphone with ultrasonic range finders and GPS to track the parking spots availability and report this information to a centralized parking server. The main issue of this architecture is that its performance is affected by the limited power source of the smartphones.
Du et al in Reference 31 proposed an effective VSN-based urban traffic monitoring system, which relies on probe vehi-cles, for example, taxis and busses, and floating cars, for example, patrol cars, for sensing the urban traffic and sending the reports to a traffic-monitoring center. There, the data are aggregated and analyzed to extract meaningful traffic infor-mation. The major limitation of this approach is that collected data are related to the roads covered by the considered vehicles and information about specific geographic areas could be missing.
On the same subject, the authors in Reference 28 designed an IoV-based traffic monitoring system where a central-ized database server collects data from sensors installed on-board of vehicles and provides augmented reality services. However, this architecture needs further enhancements to detect the distinct vehicles types and localize them.
Unlike previous works, in this article we leverage the sensing technologies on-board of vehicles to collect body param-eters from pedestrians and to infer the presence of a viral respiratory infection. To improve the accuracy of data gathering, our system also leverages the social relationships between vehicles.
3
P RO P O S E D M O D E L
By combining sensing process and networking, IoV represents a key and cost-effective technology for accessing user data, including epidemic information. In this section, we present the proposed framework that leverages IoV for the quick detection of viral diseases through the sensing of body temperature and respiratory rate of pedestrians. The con-sidered parameters may be symptoms of several viral infections, including seasonal influenza. However, since today COVID-19 is highly prevalent worldwide and poses a serious threat to citizens’ health, in the following we specifically refer to it.
3.1
Motivations and basics
It is worth to observe that many people affected by COVID-19 could have mild or no symptoms at all, and therefore the viral infection cannot be detected when measuring body temperature and breathing rate. At the same time, however, previous studies on influenza, and more recent studies on COVID-19, are demonstrating that the viral loads in asymp-tomatic carriers are relatively low, see References 32,33 and references therein. Therefore, the relatively transmissibility of asymptomatic cases could be significantly smaller than that of the symptomatic cases.
Our system is designed to detect symptomatic cases that are the most dangerous ones. Although people are recom-mended to stay at home when showing influenza-like symptoms, multiple events have been reported about people affected by COVID-19 that violated quarantine, even with high fever. Sometimes, they were accidentally recognized by the police
in railway or bus stations. Therefore, by supporting the autonomous recognition of symptomatic patients, the proposed system may have a crucial role in fighting the pandemic.
Our design is based on two main actors: vehicles and edge computing servers. The data collected by vehicles in a geographic area are forwarded to an edge computing server where they are temporarily stored, processed, and accessed by the interested consumers. According to the 3GPP-V2X (vehicle-to-everything) specification in Reference 34, a V2X application server can be implemented according to the multiaccess edge computing (MEC) paradigm to support V2X applications. By providing storage and computing resources close to where data are produced, the V2X application server ensures that data are processed in real time at the network edge thus also limiting the traffic load in the core network.35
In addition to traditional road traffic applications, the V2X application server can be extended to support a variety of IoV applications, including those for epidemic detection. Of course, multiple V2X application servers can be deployed in different geographic areas and their storage and processing resources can be sized according to the population density. Depending on their role, the interested consumers can access the data from a single edge server or from multiple ones. For instance, health department inspectors working on a specific area will access only the data from that area; vice versa, if the Health Ministry is interested in an overall map of the suspected infection cases, the data from all the V2X application servers will be accessed.
3.2
Remote sensing and processing operations
As shown in Figure 1, the proposed framework consists of two sections: a back-end section including the edge server, and a front-end section including vehicles equipped with GPS and thermal camera sensors. The workflow related to the remote sensing tasks for infection detection is instead depicted in Figure 2. It starts with the data acquisition and ends with the decision making about whether an intervention is needed to contain the spread of the infection. More specifically, the following stages are considered.
• Data acquisition stage. The first step in the process of detecting suspected cases is the data acquisition, which leverages
Vehicle to Pedestrian (V2P) communications. Emergency and patrol vehicles, like police cars and ambulances, are equipped with thermal cameras for checking the body temperature and calculating the breathing rate of pedestrians on the street. More specifically, each thermal camera is set for scanning pedestrians’ bodies on both sides of the streets, but its movement can also be controlled by the operator (eg, policemen and ambulance men) in order to reach the narrow corners and to sweep the wide areas. By monitoring how the temperature of the nasal area changes during inhalation and exhalation, the system is able to calculate the breathing rate and to infer if a person is affected by shortness of breath.23
After the data acquisition, a local processing is performed to detect possible infections from the measured data. It consists of checking if the minimum body temperature rises above the normal threshold1and if there are respiratory complications.37Data related to people that show no symptoms can be simply discarded. Conversely, in case potential infections are detected, the information is combined with the geographical coordinates of the pedestrians by using GPS localization.
In order to reduce the data collection time and avoid duplicated data, the vehicles work in a collaborative environ-ment: each one is responsible to sense the suspected cases in some predetermined city streets. Our model also leverages the social dimension of smart vehicles to let them exchange information about their specific covered (and not covered) areas in order to: (i) avoid redundant measurements in sensing tasks and (ii) to share crucial important information, such as places of mass gathering, which need assistance and reinforcement for rapid screening of infections.
• Sending data stage. It includes a two-step transmission process to relay the information about suspected cases and
their position to the edge server. First, vehicles transmit real-time information to the closed road side unit (RSU), using Vehicle-to-Road Infrastructure (V2I) communications. Then, the RSU leverages Vehicle-to-Broadband Cloud (V2B) communication,38for example, by exploiting 4G/5G LTE technology to cover both urban and rural roads, and forwards the information to the edge server, as shown in Figure 1.
• Aggregation and decision stage. It includes the process of aggregating, storing, and analyzing in the edge server all the
data generated by the sensors in real time. The output of this stage includes the creation of geographic heatmap reports, 1The normal body temperature or normothermia ranges from 36.5◦C to 37.5◦C.36
F I G U R E 1 The proposed model for identifying suspected cases of the COVID-19 virus
F I G U R E 2 Flowchart of the main stages for our proposed model Processing Yes No Check heat >38 breathing rate< 12 Aggregation, storage Start Data aquisition Send information + Localization Data store
Data acquisition stage
Sending data stage
Aggr
egation & decision stage
Discard
Analyse & decision
Application Results
Sending SMS b y
geolocation tar geting
Using OSN
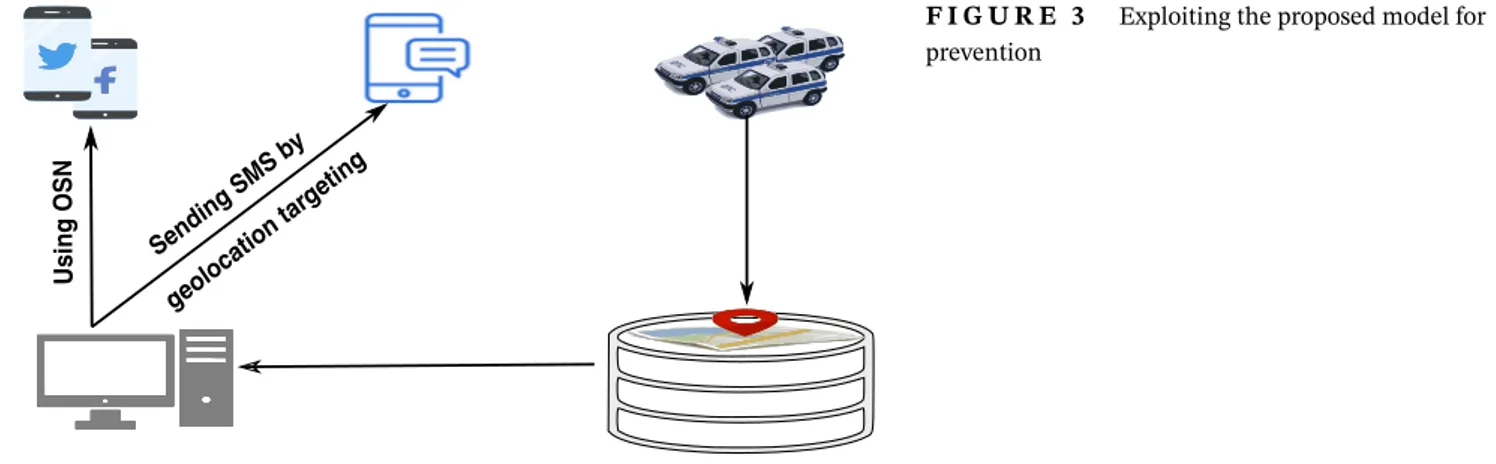
F I G U R E 3 Exploiting the proposed model for prevention
which can be sent to the Health Ministry for a prompt assessment. This allows to make decisions that can prevent or slow the spread of infections like COVID-19, including putting people in quarantine or under medical surveillance, performing viral tests and disseminating alert announcements, for example, through the use of online social networks (OSN) or SMS.
4
O S N / S M S BA S E D P R E V E N T I O N
OSNs are a fast avenue to create and spread announcements about possible risks of infections in specific geographical areas.39As the use of smartphones with social applications increases in societies, information within popular OSN can have a great impact on prevention support. Therefore, we can exploit our framework to promptly share the informa-tion collected in the edge server via OSN. Of course, to guarantee the reliability and credibility of the informainforma-tion, the dissemination must be performed through the use of official social media accounts, such as those of the Health Ministry. Another great and cheap way to notify people of possible exposure to the infection consists in sending free short messages (SMS). Again, to ensure the credibility of the information, the operation should be performed by the Health Ministry in coordination with all mobile network operators (MNO). Thanks to the geolocation information provided by the smartphones, it will be possible to alert only people in the affected regions. The notification may also include multiple suggestions, such as to limit social interactions, to wear a face mask, and so on. It is worth noticing that the conceived strategy does not compromise the privacy of pedestrian users. Indeed, the collected information is completely anonymous and only the location of possible infection cases is notified.
Figure 3 summarizes how to exploit the proposed model for prevention purposes.
5
P E R FO R M A N C E E VA LUAT I O N
5.1
Synthetic data generation
To perform a quantitative analysis of the proposed system, we need a huge set of input data about COVID-19 infection cases. Therefore, we created a synthetic data set that generates suspected cases according to the number of COVID-19 cases that are daily reported in specific geographic areas and the correspondent population density. Through this information, we defined an infection threshold T, equal to the ratio between the discovered infection cases and the inhabitants in that zone. For instance, if the population in a certain area is about P = 1000 people and, there, C = 10 cases of coronavirus have been discovered so far, we compute the threshold as T = C
P =0.01. When building the synthetic database for that specific geographic region, we consider that threshold to simulate the ratio of infected pedestrians.
As shown in the pseudocode of Algorithm 1, we consider a population of users and randomly assign values of body temperature and breathing rate to them. When the temperature exceeds 38◦C, and the breathing rate is slower than 12 breaths per minute,36then the user is considered as a new potential infected case.
We took Annaba city, Algeria, as a sample, and we divided it into five regions according to the population density. Table 2 shows the number of suspected cases vs the number of pedestrian users per each zone, obtained according to Algorithm 1.
T A B L E 2 Synthetic data set of suspected cases
Pedestrians Suspected cases
Zone 1 38 000 6500
Zone 2 24 000 1200
Zone 3 12 000 4500
Zone 4 5000 2000
Zone 5 4000 700
Algorithm 1. Generation of synthetic data set
Input : P a number of pedestrians at a particular location and C a number of reported cases per P population. Output: Number of suspected cases in this location.
Let s be the number of suspected cases initialized with 0, Let T be the infection threshold, where T←C
P:
while s
P ≤ T do
Assign random value to fever symptom Assign random value to breathing rate
if (the fever generated value< 38◦C) and (the breathing rate generated value> 12 rpm) then Add as suspected case.
Increment s by one.
else
Discard the new case.
end end
Such data are used to create a geographic heatmap representing the density of potential infections in different areas of the Annaba city in Algeria. As depicted in Figure 4, by displaying the density of suspected cases with geographic points as a gradient color layer to style the map, we can create an early alerting and reporting project.
5.2
Simulation and results
The performance of the proposed model was evaluated by using the network simulator-3 (ns-3),40 an open source discrete-event based network simulating software, developed for research and educational purposes.
In our scenario, the vehicles’ routes and mobility model of Annaba city are generated using the simulation of urban mobility (SUMO)41tool and the output file is imported into ns-3. The synthetic data set of the suspected cases is given as input to the vehicles, which send the information to the edge server. We assume that each data packet carries localization information, body temperature, and breathing rate of only one case. Vehicles leverages the LTE technology to connect to the edge server, as foreseen in the proposed model. More specifically, in addition to the LTE radio access network, the simulation scenario includes the evolved packet core (EPC) network, as shown in Figure 1, which connects to the edge server via a point-to-point link.
5.2.1
Simulation setup
General settings and LTE network parameters taken into account in the experimentation are summarized in Table 3. In order to measure the performance of the model when varying the vehicles density, we consider a number of vehicles ranging from 2 to 40 for each geographical zone. Non-line-of-sight (NLOS) channel conditions are appropriately modeled by using the Nakagami-m distribution.
Annaba
6 500 700
F I G U R E 4 Suspected cases of viral diseases heatmap
Simulation parameters Values
General Communication technology LTE + wired
Simulation time 50 s
Vehicle density 2, 6, 10, 20, 40
Number of eNB 2
Number of pedestrians 4000, 5000, 12 000, 24 000, 38 000 Ratio of contaminated pedestrians 17.5%, 40%, 37.5%, 5%, 17.1%
Data packet size 1024
LTE Propagation loss model Nakagami
LTE data packet type TCP
Data rate/RB allocation DL (50)/UL (50)
Transmission power eNB (49 dBm)/UE (23 dBm)
T A B L E 3 Simulation parameters
5.2.2
Performance metrics
To evaluate the performance of the proposed model, we consider the following network metrics.
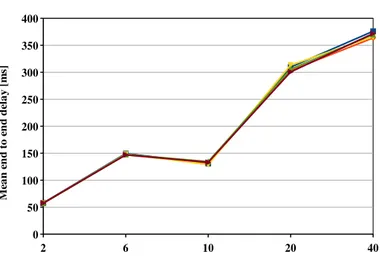
• End-to-end delay (E2E delay). It is defined as the time taken by a packet to be transmitted across the network from the
vehicle (sender) to the edge server (destination). It is computed as the average ratio between the sums of all delays and the total number of received packets, as follows:
Mean E2E delay = ∑
delaySum ∑
where:
delaySum = ∑
∀j∈receivedPackets
receivedj−sentj.
Figure 5 shows the average end-to-end delay when varying the number vehicles in each zone. It can be observed that, reasonably, the delay increases with the number of vehicles, that is, packet congestion occurs when a large number of vehicles send the packets to the destinations over the resource-limited wireless channel. However, even in the higher density settings (40 vehicles), the delay is always less than 1 second, thus guaranteeing that information is collected in a timely fashion.
• Packet delivery ratio (PDR). It is defined as the ratio between the number of packets received by the edge server, and
the number of packets transmitted by vehicles, during the simulation time, see Equation (2).
PDR = ∑
receivedPackets ∑
transmittedPackets. (2)
As shown in Figure 6, it can be observed that our model is able to maintain a relatively high packet delivery ratio, even when the vehicles density increases.
F I G U R E 5 Mean E2E delay variation according to vehicles density
F I G U R E 6 Average PDR variation according to vehicles density
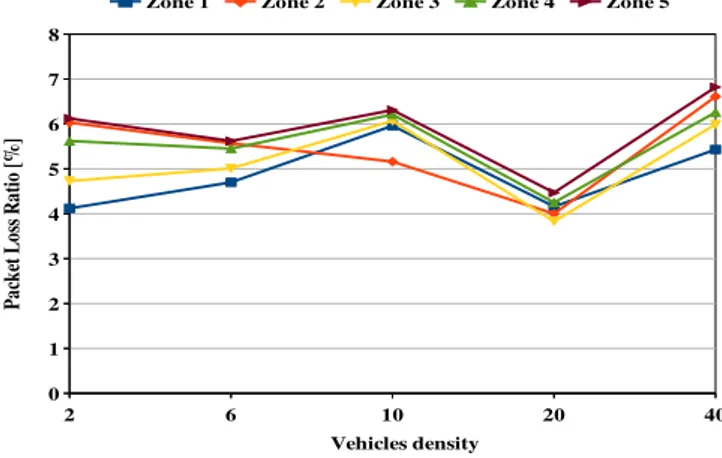
• Packet loss ratio (PLR). It represents the ratio of lost packets to the total number of sent packets, see Equation (3). PLR = ∑ lostPackets ∑ transmittedPackets =1 − PDR, (3)
As shown in Figure 7, the PLR is used to evaluate the loss performance of our proposed model. It can be observed that the PLR is inversely proportional to PDR. Indeed, when multiple competitors share the same limited channel resource, it is more likely that packets are lost due to collisions. Whenever this factor is small, the framework is suitable to send real-time sensing data.
• Throughput. It represents the amount of data successfully received by the edge server per unit time, measured in
kilobits per second (kbps), as shown in Equation (4).
Throughput = ∑ received data(kbps) Tlast−Tfirst , (4) where:
Tlast is the time of last packet send,
Tfirst is the time of first packet send.
Figure 8 shows that, reasonably, the throughput increases with the vehicle density because a higher number of packets are received by the edge server.
F I G U R E 7 Average PLR variation according to vehicles density
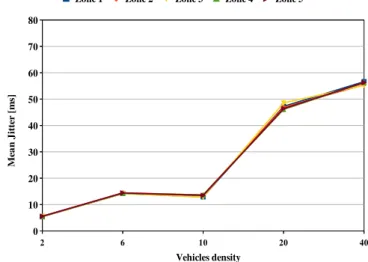
F I G U R E 9 Mean delay jitter in respect of vehicles density
• Delay variation (or delay jitter): jitter is defined as the variation in the end-to-end delay of packets, caused by some
factors such as congestion. The performance increases as jitter decreases. The mean jitter can be calculated using the formula given in Equation (5):
Mean jitter =
∑ jitter ∑
receivedPackets −1. (5)
Figure 9 shows that the delay jitter increases with the vehicle density, due to the higher congestion. However, in the worst case, the metric is below 60 milliseconds and therefore the system performance is not compromised.
5.3
Accuracy measures
It is well known that remote sensing can be affected by several factors, for example, people could show mild symptoms of the disease or they could develop fever and respiratory symptoms simply due to a common cold. This can lead, respectively, to the occurrence of false negative or false positive results:
• False negatives (FN): A test result which falsely indicates the absence of a condition or an outcome. • False positives (FP): A test result which falsely indicates the presence of a condition or an outcome.
To test the accuracy of the proposed model, we consider the zone 4 as an example. As shown in Figure 10, we assume that, for the total tested population, there is a false positive rate of 4% and a false negative rate of 1%; these numbers are in line with those reported in existing literature about remote sensing through thermal imagining cameras.42-44
In our model, we identify possible infections when the temperature is absolutely greater than 38◦C, and the breath-ing rate is less than 12 rpm. If pedestrians tested positives, they require treatment, isolation, and quarantine, thereby
F I G U R E 11 Graph to represent false negative and false positive
preventing the infection of others. Of course, having false positives is better than having false negatives, which lead to bad outcomes on the public health.
The graph in Figure 11 shows the false positive (FP) and false negative (FN) results around 38◦C. Similarly, for the breathing rate, we take false positive (FP) and false negative (FN) results around the threshold, where the threshold is 12 rpm.
From the tree diagram, we have:
FN = P(D ∩ P) =80, (6)
FP = P(D ∩ P) =50, (7)
where:
P, the sensing result is positive, D, the pedestrian has the disease.
In addition to false negatives and false positives, other most common accuracy measures are sensitivity and specificity.
• Sensitivity: also referred as the recall or true positive rate (TPR), it represents the ability of diagnoses procedure to
correctly identify all patients with a positive test (true positives). A very sensitive test is able to correctly identify all positive samples. From the tree diagram we have:
Sensitivity = TP
TP + FN =P(P|D), (8)
• Specificity: also referred as the true negative rate (TNR), it represents the ability of a diagnoses procedure to correctly
identify all patients with a negative test (true negatives). Sensitivity and specificity are inversely proportional, if the first increases, the second decreases and vice versa. A good diagnostic test which identifies all false positives and false negatives, consists of a test with high sensitivity and low specificity combined with another test having high specificity and low sensitivity. From the tree diagram we have:
Specificity = TN
TN + FP =P(P|D), (9)
It is worth observing that the accuracy of the results in our design is not 100% perfect, but this is inline with other diagnostic tests.
In presence of infectious diseases, false negative tests may have dangerous implications for the public health. Similarly, false positive tests poses different threats. For instance, the already overburdened medical facilities are used for patients that are actually healthy, or false positive diagnosed persons may experience adverse psychological consequences until the condition is not clarified.
To improve the accuracy of data collection, additional detecting strategies can be included in our system, for example, based on artificial intelligence modeling techniques.42-44However, this aspect is left as future work.
6
D I S C U S S I O N A N D CO N C LU S I O N
Today, COVID-19 is one of the most prevalent diseases in the world, taking thousands of lives every day. In this article, we presented an IoV-based remote sensing framework to identify and control the outbreaks of infectious disease like COVID-19. The proposed system is designed to scan the body of a huge number of pedestrians rapidly, by using ther-mographic cameras, and to transmit the data to the edge server in real time. The GPS is used to track the infected areas. Finally, to quickly spread the information about risk-prone areas and help the people to protect themselves, the use of OSN/SMS is proposed. Sensed data can be further transferred in a unified database, thus building a smart city sensing system.
A main challenge to our model is the deployment cost due to the installation of thermal cameras on board of vehi-cles, which may not be an affordable option for underdeveloped countries. However, the deployment cost can be highly rewarded by the benefits of the system, as showed by our preliminary evaluation campaign measuring different QoS metrics. Results demonstrated that our proposal is able to collect and process in real-time thousands of data and the performance is directly affected by the vehicles density. To further reduce the packet losses and mitigate the network congestion, additional assessments with an increased number of eNBs will be considered.
Future works will also include the evaluation of security risks and the design of strategies to protect the integrity of data.
O RC I D
Yesin Sahraoui https://orcid.org/0000-0001-5555-1393
Ahmed Korichi https://orcid.org/0000-0002-5741-4963
Chaker Abdelaziz Kerrache https://orcid.org/0000-0001-9990-519X
Muhammad Bilal https://orcid.org/0000-0003-4221-0877
R E F E R E N C E S
1. Gubbi J, Buyya R, Marusic S, Palaniswami M. Internet of things (IoT): a vision, architectural elements, and future directions. Future
Generat Comput Syst. 2013;29(7):1645-1660.
2. Abdelaziz Kerrache C, Amadeo M, Ahmed SH, Liang JC. Future internet of vehicles. Trans Emerg Telecommun Technol. 2020;31: e3975.
3. He W, Yan G, Da Xu L. Developing vehicular data cloud services in the iot environment. IEEE Trans Ind Inform. 2014;10(2):1587-1595.
4. Chen C-L, Yang T-T, Deng Y-Y, Chen C-H. A secure internet of things medical information sharing and emergency notification system based on nonrepudiation mechanism. Trans Emerg Telecommun Technol. 2020;e3946.
5. Maglaras LA, Al-Bayatti AH, He Y, Wagner I, Janicke H. Social internet of vehicles for smart cities. J Sens Actuat Netw. 2016;5(1):3.
6. Rahim A, Kong X, Xia F, et al. Vehicular social networks: a survey. Pervas Mob Comput. 2018;43:96-113.
7. Iqbal R, Butt TA, Afzaal M, Salah K. Trust management in social internet of vehicles: factors, challenges, blockchain, and fog solutions.
Int J Distrib Sens Netw. 2019;15(1):1550147719825820.
8. WHOhttps://www.who.int/health-topics/coronavirus. accessed May 20, 2020.
9. Dlamini SN, Beloconi A, Mabaso S, Vounatsou P, Impouma B, Fall IS. Review of remotely sensed data products for disease mapping and epidemiology. Remote Sens Appl Soc Environ. 2019;14:108–118.
10. Zhai J, Briese T, Dai E, et al. Real-time polymerase chain reaction for detecting Sars coronavirus, Beijing, 2003. Emerg Infect Diseases. 2004;10(2):311.
11. Yuehong Y, Zeng Y, Chen X, Fan Y. The internet of things in healthcare: an overview. J Ind Inf Integrat. 2016;1:3-13.
12. Alqahtani FH. The application of the internet of things in healthcare. Int J Comput Appl. 2018;180(18):19-23.
13. Baker SB, Xiang W, Atkinson I. Internet of things for smart healthcare: technologies, challenges, and opportunities. IEEE Access. 2017;5:26 521-26 544.
14. Rodrigues JJ, Segundo DBDR, Junqueira HA, et al. Enabling technologies for the internet of health things. IEEE Access. 2018;6:13 129-13 141.
15. Gadekallu TR, Khare N, Bhattacharya S, Singh S, Maddikunta PKR, Srivastava G. Deep neural networks to predict diabetic retinopathy.
J Ambient Intell Humaniz Comput. 2020.
16. Deepa N, Prabadevi B, Maddikunta PK, et al. An ai-based intelligent system for healthcare analysis using ridge-adaline stochastic gradient descent classifier. J Supercomput. 2020.
17. Maddikunta PKR, Gadekallu TR, Kaluri R, Srivastava G, Parizi RM, Khan MS. Green communication in iot networks using a hybrid optimization algorithm. Comput Commun. 2020;159:97–107.
18. Ginsberg J, Mohebbi MH, Patel RS, Brammer L, Smolinski MS, Brilliant L. Detecting influenza epidemics using search engine query data.
Nature. 2009;457(7232):1012-1014.
19. Schmidt CW. Trending Now: Using Social Media to Predict and Track Disease Outbreaks. USA: Public Health Services, US Dept of Health and Human Services; 2012.
20. Gupta A, Saha S, Adhikary S. Delay-sensitive remote health framework for secured wban using sensor virtualization. Appl Innovat Mob
Comput (AIMoC). 2016.
21. Sareen S, Gupta SK, Sood SK. An intelligent and secure system for predicting and preventing Zika virus outbreak using fog computing.
Enterprise Inf Syst. 2017;11(9):1436-1456.
22. Sareen S, Sood SK, Gupta SK. IoT-based cloud framework to control ebola virus outbreak. J Ambient Intell Humaniz Comput. 2018;9(3):459-476.
23. Sun G, Nakayama Y, Dagdanpurev S, et al. Remote sensing of multiple vital signs using a CMOS camera-equipped infrared thermography system and its clinical application in rapidly screening patients with suspected infectious diseases. Int J Infect Diseas. 2017;55:113-117.
24. Sandhu R, Gill HK, Sood SK. Smart monitoring and controlling of pandemic influenza a (h1n1) using social network analysis and cloud computing. J Comput Sci. 2016;12:11-22.
25. Mathew A, SA FA, Pooja H, Verma A. Smart disease surveillance based on internet of things (IoT). Int J Adv Res Comput Commun Eng. 2015;4(5):180-183.
26. Wang Y-C, Chen G-W. Efficient data gathering and estimation for metropolitan air quality monitoring by using vehicular sensor networks.
IEEE Trans Veh Technol. 2017;66(8):7234-7248.
27. Mathur S, Jin T, Kasturirangan N, et al. Parknet: drive-by sensing of road-side parking statistics. Paper presented at: Proceedings of the 8th International Conference on Mobile Systems, Applications, and Services, San Francisco, California; 2010:123-136.
28. Dey MR, Sharma S, Shit RC, Meher CP, Pati HK. Iov based real-time smart traffic monitoring system for smart cities using augmented reality. Paper presented at: Proceedings of the 2019 International Conference on Vision Towards Emerging Trends in Communication and Networking (ViTECoN); 2019:1-6; Vellore, India: IEEE.
29. Ang L-M, Seng KP, Ijemaru GK, Zungeru AM. Deployment of iov for smart cities: applications, architecture, and challenges. IEEE Access. 2018;7:6473-6492.
30. Hu SC, Wang YC, Huang CY, Tseng YC. A vehicular wireless sensor network for co 2 monitoring. Paper presented at: Proceedings of the SENSORS, 2009 IEEE, Canterbury, New Zealand; 2009:1498-1501.
31. Du R, Chen C, Yang B, Lu N, Guan X, Shen X. Effective urban traffic monitoring by vehicular sensor networks. IEEE Trans Veh Technol. 2014;64(1):273-286.
32. Yuen K-S, Ye Z-W, Fung S-Y, Chan C-P, Jin D-Y. Sars-cov-2 and covid-19: the most important research questions. Cell Biosci. 2020;10(1): 1-5.
33. He D, Zhao S, Lin Q, et al. The relative transmissibility of asymptomatic cases among close contacts. Int J Infect Diseas. 2020;94: 145–147.
34. 3GPP. TS 23.285 v15.2.0. technical specification group services and system aspects. Architecture Enhancements for V2X Services. Sophia Antipolis; France: European Telecommunications Standards Institute; 2018.
35. Amadeo M, Campolo C, Molinaro A, Harri J, Rothenberg CE, Vinel A. Enhancing the 3gpp v2x architecture with information-centric networking. Future Internet. 2019;11(9):199.
36. Hutchison JS, Ward RE, Lacroix J, et al. Hypothermia therapy after traumatic brain injury in children. New Engl J Medic. 2008;358(23): 2447-2456.
37. Fallah-Haghmohammadi H, Necsulecsu DS. Fever detection for dynamic human environment using sensor fusion. Paper presented at: Proceedings of the 2017 International Conference on Optimization of Electrical and Electronic Equipment (OPTIM) & 2017 International Aegean Conference on Electrical Machines and Power Electronics (ACEMP); 2017:881-886; IEEE.
38. Sahraoui Y, Ghanam A, Zaidi S, Bitam S, Mellouk A. Performance evaluation of tcp and udp based video streaming in vehicular ad-hoc networks. Paper presented at: Proceedings of the 2018 International Conference on Smart Communications in Network Technologies (SaCoNeT); 2018:67-72; El Oued, Algeria: IEEE.
39. Penni J. The future of online social networks (osn): a measurement analysis using social media tools and application. Telemat Informat. 2017;34(5):498-517.
40. NShttps://www.nsnam.org. accessed April 2, 2020.
41. SUMOhttp://sumo.sourceforge.net. accessed April 2, 2020.
42. Abdulshahed AM, Longstaff AP, Fletcher S, Myers A. Thermal error modelling of machine tools based on anfis with fuzzy c-means clustering using a thermal imaging camera. Appl Math Modell. 2015;39(7):1837-1852.
43. Ball M, Pinkerton H. Factors affecting the accuracy of thermal imaging cameras in volcanology. J Geophys Res Solid Earth. 2006; 111(B11):1–14.
44. Abdulshahed AM, Longstaff AP, Fletcher S. The application of anfis prediction models for thermal error compensation on cnc machine tools. Appl Soft Comput. 2015;27:158-168.
How to cite this article: Sahraoui Y, Korichi A, Kerrache CA, Bilal M, Amadeo M. Remote sensing to control
respiratory viral diseases outbreaks using Internet of Vehicles. Trans Emerging Tel Tech. 2020;e4118.https://doi. org/10.1002/ett.4118