1
Alma Mater Studiorum – Università di Bologna
DOTTORATO DI RICERCA IN
SCIENZE E TECNOLOGIE AGRARIE, AMBIENTALI E ALIMENTARI INGEGNERIA ALIMENTARE
Ciclo XXVII
Settore Concorsuale di afferenza: 07/C1
Settore Scientifico disciplinare: AGR/09
TITOLO TESI
Electric techniques for the assessment of quality parameters of
foodstuffs
Presentata da: Eleonora Iaccheri
Coordinatore Dottorato:
Relatore:
Prof. Giovanni Dinelli
Prof. Luigi Ragni
Prof. Angelo Fabbri
2
…ogni volta come se fosse la prima volta, senza nessuna estrema certezza, perché il dubbio è l’inizio della sapienza…
Cartesio “Discorso sul metodo”, 1637
3
Index
1.Introduction ... 6
1.1 Dielectric behavior of food ... 8
1.2 Electric polarization ... 9
1.3 Dielectric properties of food ... 13
Frequency ... 13
Temperature... 14
Food compositional constituents ... 16
Water ... 20
Dielectric water behavior ... 21
1.4 Methods for dielectric properties measurements ... 25
Waveguide and coaxial line ... 26
Parallel plate capacitor ... 28
Time-Domain Reflectometry method ... 29
Cavity perturbation technique ... 31
Open-ended coaxial probe technique ... 32
Free space transmission technique ... 33
Micro-strip transmission line ... 35
1.5 References ... 36
2. Extra virgin olive oil (EVOO) ... 46
2.1 Material and methods ... 49
Parallel plate capacitor ... 50
Statistical analysis ... 52
4
2.3 Conclusion ... 60
2.4 References ... 61
3. Orange Juice ... 65
3.1 Material and methods ... 67
Coaxial probe with vector analyzer ... 68
3.2 Results and discussion ... 68
3.3 Conclusion ... 72
3.4 References ... 73
4. Green and roasted coffee ... 74
4.1 Material and methods ... 76
Waveguide system ... 77
4.2 Results and discussion ... 80
4.3 Conclusion ... 83
4.4 References ... 84
5. Parmigiano Reggiano cheese ... 87
5.1 Material and methods ... 89
Parallel plate capacitor system ... 90
5.2 Results and discussion ... 92
5.3 Conclusion ... 100
5.4 References ... 101
6. Brief practical applications ... 104
6.1 Geographical origin discrimination by using a waveguide system ... 104
Conclusion ... 107
6.2 A capacitive technique to monitoring a freezing process of “milkshake” product .... 109
6.3 Time Domain Reflectometry as screening for EVOO quality parameters assessment ... 115
5 6.2 Capacitive system for the estimation of wafer biscuit cooking process ... 121 7. Conclusion ... 127
6
1.Introduction
In food industry, quality assurance requires low cost methods for the rapid assessment and preferably on-line measurement of the parameters that affect product stability. Chemical and physical properties of raw material, process streams and end products are the main aspects which define the level of product quality and stability. Quality parameters in foodstuffs define the degree of excellence of a product or suitability for specific applications (Soltani et al., 2011).
Foodstuffs are complex in their structure, mainly composed by gaseous, liquid and solid phases which often coexist in the same product (Rogers, 2001). For example, within the liquid portion fat and water may be combined and the result is called emulsion.
These structural characteristics include physical, mechanical and chemical properties that could undergo modification induced by the industrial process or storage.
Special attention is given to water, concerned as natural component of the major food product or as added ingredient of a production process, which assumes a great importance on technical and economical levels. Particularly water is structurally present in the matrix and not completely available. In this way, water can be present in foodstuff in many different states: as water of crystallization, bound to protein or starch molecules, entrapped in biopolymer networks or adsorbed on solid surfaces of porous food particles. Only this parameter can be exhaustive to well describe the variability of samples belonging from food industry.
Moreover foodstuffs change as a function of the season, the region of origin, the harvesting, the storage conditions as well as the processing step.
The traditional and most widely used technique for the assessment of food quality give reliable information but are destructive, time consuming and unsuitable for on line application (Barbosa-Canovas et al. 2006). The principal problem of an off-line measurement is the limitation to destructive disposal, time dispersant and the acceptance of not being able to correct the production process in real time (Rogers, 2001).
In particular technologies for non-destructive internal properties assessment are very limited. Therefore, investigation of the dielectric behavior of major food components and processing effects are needed to provide useful information to well understand the different
7 material for more solid design or better monitor of manufacturing process for quality control (Agilent.com, 2006).
The techniques proposed to monitor the quality parameters of foodstuff answer to the limited disposition of time and could be able to characterize the main compositional parameters. Dielectric interaction response is mainly related to water and could be useful not only to provide information on the total content but also on the degree of mobility of this ubiquitous molecule in different complex food matrix.
New development technologies are being introduced to provide selective analysis and adaptation to changing market structure, process procedures and variability of raw material. In this way the proposal of this thesis is to answer at this need. Dielectric and electric tool can be used for the scope and led us to describe the complex food matrix and predict food characteristic.
The thesis is structured in three main part, in the first one some theoretical tools are recalled to well assess the food parameter involved in the quality definition and the techniques able to reply at the problem emerged. The second part explains the research conducted and the experimental plans are illustrated in detail. For convenience this part is divided for kind of food considered and relative technique applied. Finally the last section is left for the practical application and rapid method easily implementable in an industrial control protocol or monitoring process.
8
1.1 Dielectric behavior of food
Biological materials, as food, act as non-ideal capacitor for their ability to store and dissipate energy from an external electric field. When a foodstuff is placed in an electric field, part of the electric charge does not pass through the material but only shift from their equilibrium causing a dielectric polarization (Britannica, 2009). In this way, food products have the ability to store energy when an external fields is applied and for this reason can be defined as a dielectric. The author has found that the capacity of a capacitor was dependent on the nature of the material separating the conducting surface. The properties related to the electrical capacitance and resistance are defined as dielectric properties. Every foodstuff has a characteristic pool of electrical properties that depend on its dielectric behavior. The complex quantity that describes the interaction of a material with the electric field is the permittivity (Ɛr).
Permittivity is composed by a real and an imaginary part and it is expressed by the following theoretical equation:
Where Ɛr is the complex permittivity, Ɛ’r is the real part called also dielectric constant and
Ɛr’’ is the imaginary part named loss factor.
The storage capacity of a material is related to the real part of permittivity, the dielectric constant. The dissipation of energy represents the imaginary part and can be classified as loss factor. The effects that contribute on this parameters are loss and conductivity.
When complex permittivity is considered, the relative losses of a material is the ratio of the energy lost to the energy stored and is called the loss tangent (tan ƍ).
This parameter provides a measure of the material’s loss angle which is complementary to the phase angle between the voltage and current related to material’s impedance and conduction (Mudgett, 1986).
9
1.2 Electric polarization
At atomic level, every material is primarily made of negative and positive charges. In the presence of an electric field these charges are distorted and this interactions result from dipole polarization (Collie et al., 1948). When the electric field is removed the atoms return to the original state after a period of time called relaxation time (Mudgett, 1995).
Five main polarization mechanism are resume and show in figure 1.
Fig. 1 Polarization effects (de Loor and Meij-boom, 1966).
The first polarization that occur is the “electronic polarization” caused by the deformation of the electron around the molecule. It occurs in neutral atoms when the electric field displaces with respect to negative charge.
The “atomic/ionic polarization” is due to the shift between two atoms belonging to different molecules. The atoms acquire charges of opposite polarity and the external field will tend to change the equilibrium positions of the atoms themselves, leading to atomic polarization.
10 The “dipolar/orientational polarization” is indication of a permanent dipole moment and its due to the re-orientation of the electric dipole which would line up with the electric field applied. This occurs only in dipolar materials possessing permanent dipole moment.
The last polarization that can occur is the “space charge polarization” involving free or fix charge of the material. It is present in dielectric materials which contain charge carries which can migrate through the bulk of the material creating a macroscopic field distortion. Space charge polarization can be classified into hopping polarization and interfacial polarization. In dielectric materials, localized charges (ions and vacancies, or electrons and holes) can hop from one site to another site, which creates the hopping polarization. Similarly the separation of the mobile positive and negative charges under an electric field can produce an interfacial polarization (Sudheendran et al., 2011).
Usually in foodstuff this last polarization is less frequent than the other. Nerveless every kind of polarization requires time to manifest which create a displacement between the material polarization and the electric field applied.
To simulate the permittivity of the dielectric materials and therefore the relaxation phenomenon were developed many models as Debye, Cole-Cole, Davidson-Cole o Havriliak-Negami.
Among all, however, the only model of Debye (shown in figure 2) was born from an observation of the physical system, while all the others are originated from a parametric fitting. Debye model described the dielectric behavior of polar molecules in terms of permittivity as function of frequency. Different mechanism of polarization in biological materials are associated at different electromagnetic spectrum regions (de Loor and Meijboom, 1966).
11 Figure 2 Debye model of the relaxation of water at 30°C.
The dipole rotation process persists until the relaxation phenomena occurs. The time of relaxation is the time required by molecule dipoles to become electric field oriented and it is strictly frequency dependent (Mudgett, 1986). At radiofrequencies the dipoles follow the external field and do not oscillate so fast to produce significant heat generation. Otherwise at higher frequency the dipoles are reacting to the electric field, but they are unable to follow the rapid field and relaxation phenomena occur. Moreover at high frequency the dielectric constant has a value of ∞ and loss factor reaches its maximum at the relaxation frequency. This Debye interpretation of the variation of dielectric constant and loss factor with frequency has limitations and large deviations can occur, in terms of dipolar rotation against frictional forces in the medium. Despite this, Debye equation is the best for describing the variation of dielectric properties with frequency of liquid water, as the best example of polar material.
In particularly when food is taken into account for an absorption of energy some mechanism occurs and are dependent on the shape, volume, surface area, dielectric properties and equipment configuration (Nelson and Datta 2001). Otherwise, the two mechanisms primarily involved are dipolar relaxation and ionic conduction. Considering a foodstuff, the main component affect by these two mechanisms is water. Collie et al. (1948) well
12 described that dipole rotation in biological materials is associated with positive and negative charge on the hydrogen and oxygen atoms of water molecules. Water characterized by its dipolar nature tries to follow the electric field and such rotational movement of molecules produce heat and migration of ions under the influence of the electric field. These mechanisms are all energy losses and are all considered in the loss factor parameter. Furthermore, the decrease and increase in loss factor has been related to ionic conductivity at lower frequencies, to bound water relaxation, and to free water relaxation near the top of frequency range (Nelson and Datta, 2001).
13
1.3 Dielectric properties of food
In food, permittivity is related to chemical composition, physical structure, frequency and temperature, with moisture being the dominant factor (Barbosa- Cànovas et. al 2006; Ohlsson et al., 1974; Kent and Jason, 1975; Engelder & Buffler, 1991; Nelson, 1961 and Nelson S O, 1992; Nelson & Kraszewski, 1990; Sipahioglu et al., 2003).
Subsequently, these main parameters are discussed.
Frequency
The dielectric properties of the foods may be determined in frequency intervals from direct current to optical frequencies by various measuring techniques (von Hippel, 1954).
The principal contribute of the frequency is polarization of molecules. With the increase of the frequency, the polar molecules follow the changes of the electric field up to the point where the orientation of the dipoles cannot keep up of the electric field and the dipoles relaxed. The dipoles relaxing assume a random orientation and as a result, the dielectric constant decreases or remains constant with the increase of the frequency (Içıer and Baysal, 2004). Spectroscopic techniques get information about the food matrix belonging from the emitted spectrum of the food propagation parameters. Food properties are more often detected in radio or microwave frequencies. Between 1 and 100 GHz, the microwave region, it can be possible to obtain different information compared to the radio frequency region. In the microwave range, the conductivity effects on the dielectric properties of the material can be ignored. Physical contact between sample and equipment is not required so does not alter or contaminate the material under test. Furthermore in microwave region at around 20 GHz, free water relaxes and allowing the detection of very small amounts of water (De los Reyes Canovas 2010).
A brief review of the main work showed the frequency influence is subsequently reported. Thermal denaturation of liquid egg whites and whole eggs influenced the dielectric constant and dipole loss component of eggs, as reflected by changes in loss factor of egg yolk. As expected ionic conductivity was considered a dominant factor determining the dielectric
14 loss behavior of egg products at radiofrequencies, whereas dipole water molecules played an increasing role with an increase in microwave frequencies (Wang et al., 2009).
Wang et al. (2008) observed the differences in the dielectric properties of anterior, middle, tail, and belly portions of Alaska pink salmon (Oncornynchus gorbuscha) fillets. Dielectric constant and loss factor were determined in the frequency range between 27 and 1800 MHz from 20 to 120 C to provide insights for improving the modelling of microwave and radio frequency commercial sterilization processes of salmon products. Different part of salmon fillet contributed to observe little differences in the dielectric properties. At radio frequencies of 27 and 40 MHz, the dielectric constant decreased with increasing temperature. Although at microwave frequencies (e.g. 915, 1800 MHz), an opposite trend was observed. Over the tested frequency range, the dielectric loss factor increased with increasing temperature. Dielectric properties at radio frequencies suggest that ionic conductivity was the major contributor to temperature dependence on the electrical conductivity of minced salmon fillets.
Penetration depths are used to assess whether microwave or radio frequency energy at particular frequencies penetrates through a certain thickness of food so that a relatively uniform heating could be achieved during dielectric heating provide important information in pasteurization processes (Al-Holy et al., 2005). The authors determined the dielectric constant, loss factor and penetration depth for salmon and sturgeon caviar at 27 MHz and 915 MHz. The penetration depth was higher at 27 MHz compared to the microwave region.
Temperature
Temperature has a significant influence on the dielectric properties of food. The dependence of dielectric properties on temperature is therefore complex, this can grow or decrease as function of the material taken into consideration. For most reliable measurements of the dielectric properties of food, a control on this parameter must be performed. The influence of temperature on the dielectric properties of the food depends on many factors such as humidity, composition, salt and frequencies involved (Tang, 2005).
The influence of temperature among foodstuff parameters is subsequently reported in a brief literature review. Everard et al. (2006) measured dielectric properties of 16 processed
15 cheeses over the frequency range 0.3-3 GHz. Authors found that dielectric constant increased at low temperature until reach a minimum at high temperature, while loss factor for medium-high moisture decreased at low temperature and increased at high temperature. In pure water for example, an increase in temperature increases the frequency at which the relaxation phenomena occurs and the loss factor raise (Mudgett, 1995).
Dielectric properties of ground samples of peanuts were measured for several densities, temperatures and moisture content in microwave region from 300 to 3000 MHz. The dielectric properties of peanuts increase with density. At higher moisture content the temperature effect was reduced by the high dependence of dielectric properties on moisture content (Boldor et al. 2004).
The dielectric properties of food at low temperature, particularly below the freezing point are affected by the progressive conversion of liquid water to ice with the concentration of dissolved salt (Mudgett et al.,1995). This phenomena suggest that dielectric properties in frozen foods are related to aqueous ionic environment, characterized by relative motilities of water and ions which can be determined as loss factor variation (Bengtoss and Risman, 1971; Westphal, 1972).
The dielectric properties of foods at high temperature, in specific about non-polar liquids and solids are reported (vonHippel 1954; Chernow et al. 1967; Westphal and Sils, 1972). These measurements indicates that the properties of non-polar food are constant over a wide range of temperatures and are dielectrically inert compared to the aqueous polar substances (Mudgett, 1995).
Wang et al. (2009) studied the effects of cooking on dielectric properties of liquid whole eggs and egg whites in relation to radiofrequencies and microwaves by using an open ended coaxial probe over a wide range of temperature 20-120 °C.
Moreover Coronell et al. (2008) tested ready to eat puddings, soy beverages and avocado paste products. Soy beverages followed the same general trend traduced in a decrease of dielectric constant and an increase of loss factor with temperature raise. For puddings the dielectric properties had similar values, 64 and 52 for dielectric constant and 17.2 and 22.7 for loss factor, respectively which can be used to implement flow applications.
16
Food compositional constituents
Dielectric constant and loss factor are primarily determined by the chemical composition of foodstuff, such as the presence of mobile ions and permanent dipole moment associated to water and the interaction between other molecules, and only subsequently by their physical structure (Barbosa- Cànovas et. al 2006).
Dielectric properties of food product depend on their major relevant components, such as moisture, salt content, carbohydrate, protein and fat.
Several studies regarding dielectric characterization of agri-food products were carried out in the past 40 years to study the influence on different compositional factors (Nelson, 1996; Venkatesh & Raghavan, 2005). These studies investigated grain and seed (Nelson, 2003), fruits and vegetables (Tran et al., 1984; Nelson, 1992; Nelson et al., 1996; Berbert et al., 2001), beverages (García et al., 2001), baked food and flours (Seras et al., 1987; Zuercher et al., 1990), dairy products (Sone et al., 1970; Kudra et al., 1992), fish and meat (Bengtsson & Risman, 1971; Ohlsson et al., 1974; Lyng et al., 2005).
An extensive analysis was conducted on compositional changes of fruit due to insect pest attack (Wang et al. 2008 and 2009; Ikediala et al. 2002). The authors explored in the first step the fruit dielectric behavior at the radiofrequencies region and then observed an increase in loss factor when the fruit was affected by insects.
Egg constituents were characterized by Ragni et al. (2007) through dielectric properties, to investigate the electrical changes during storage by using an open-ended coaxial probe in the frequency range 20-1800 MHz. Their results indicated R2 values up to 0.92, 0.60, 0.53 and 0.73 for the air cell height, thick albumen height, Haugh unit and Yolk index, respectively.
The differences in composition of grape juice varieties can be evaluated by using dielectric properties (Garcia et al. 2001). Red wine grape juice samples were used for measuring the dielectric constant and loss factor in the frequency range 0.2-3 GHz. The investigators observed differences among varieties in relation to the value of the total and dipolar losses at 3 GHz but more measurements are necessary to be decisive enough.
Regarding carbohydrates, the principal species present in food system are starches, sugars and gums. Detecting this kind of compounds by using dielectric properties can be difficult
17 because they do not show appreciable dipolar polarization at microwave frequencies (Ryynanen, 1995). Therefore, for carbohydrate solutions, the effect of free water on dielectric properties becomes significant. Hydrogen bonds and hydroxyl group water interactions also play a significant role in dielectric properties of high sugar, maltodextrin, starch hydrolasate and lactose like disaccharide based foods (Roebuck et al., 1972).
The dielectric properties of thirteen sweet potato cultivars were determined to develop a process for rapid sterilization and aseptic packaging of potato puree by using a continuous flow microwave system operating at 915 MHz (Brinley et al., 2008). Results indicated that temperature, moisture, sugar and starch content had a pronounced effect (p < 0.001) on dielectric properties measured from 15°C to 145°C. The authors described as the sugar content of the purees had a negative effect on the dielectric loss factor, as a consequence of the formation of hydrogen bonding with the free water which decreased the polarization of water molecules.
A simple method based on a designed dielectric cell was proposed for determination of dielectric properties of powder grains (Bhargava et al., 2014). Dielectric constant and loss factor of five varieties of wheat have been determined to investigate food nutrients dependence, such as moisture, protein, fat and carbohydrates. In particular, the authors underlined that the value of dielectric constant first increases and then decreases as the % of carbohydrates is increased, it being highest at about 66 % of carbohydrate value for all the grain sizes. The loss factor on the other hand first decreases and then increases, showing lowest value at about 66% of the carbohydrates.
Dielectric properties at 2450 MHz were determined for tapioca, corn, wheat, rice, waxy-maize and amylo-waxy-maize starches in granular, at temperatures from 30 to 95°C by Ndife et al. (1998). Dielectric properties were shown to be dependent on temperature, moisture content and starch type. Quadratic equations were developed to show the relationship between the changes in dielectric properties with temperature for starch species. The authors found significant differences in dielectric properties of different types of starches.
Protein are relatively inert and do not interact significantly with microwaves. Proteins are partially soluble and partially insoluble with ionizable surface regions that may bind water or salts to give rise to zeta potential and double-layer effects associated with free surface charge (Mudgett, 1995). The dielectric properties of proteins depend on their chains, which
18 can be nonpolar with decreasing order of alanine, glycine, leucine, isoleucine, methionine, phenylanine and valine or polar with decreasing order. Free aminoacids are instead dielectrically reactive and contribute to an increase in dielectric loss factor. Since protein dipole moments are a function of their amino acids and the pH of the medium, the dielectric properties and microwave reactivity of cereal, legume, milk, meat and fish proteins are expected to be different. The water absorbed on proteins affects their dielectric properties. The dielectric activity of proteins can be divided into four categories:
• high activity due to charge effects of ionization carboxyl, sulfhydryl’s and amines;
• hydrogen and ion binding as affected by pH;
• net charges on dissolved proteins;
• relatively low activity due to relaxation and conductive effects.
Bircan and Barringer (2002) determined the protein denaturation of muscle foods using the dielectric properties. Both the dielectric constant and loss factor increased at a temperature that appeared to match the denaturation temperature for collagen in beef, chicken breast, chicken thigh, perch, cod, and salmon. When the sample was reheated the change did not reoccur, indicating that the dielectric properties were measuring an irreversible change. At lower frequencies the increase in the dielectric properties was larger. When collagen and acto-myosin denature, the muscle shrinks, expelling water and minerals becoming more mobile. The dielectric constant and loss factor measure the mobility of water and ions; therefore they may be able to determine the temperature of protein denaturation.
The dielectric properties of milk protein (whey protein isolate), starch and water were investigated by Tsoubeli et al. (1995) to controlling the cereal product quality. At lower moisture contents, Ca-caseinate has a lower dielectric constant than whey protein isolate or starch. The addition of whey protein isolate in the starch water system could increase the ability of starch to dissipate energy, manifested by the higher dielectric loss at almost all moisture contents. It was evident that although the water environments were similar among the systems studied, their dielectric properties differed. Thus the authors concluded that the dielectric properties do not solely depend on water but are also influenced significantly by the macromolecule present.
Dielectric properties of soy protein isolate dispersions were measured by Ahmed et al. (2007) over the frequency range of 200–2500 MHz by the open-ended coaxial probe
19 method. Results indicated that the dielectric constant decreased with temperature and frequency while increased with protein concentration. Moreover the significant change in dielectric properties at 90 C was a result of protein denaturation which was identified by differential scanning calorimetry (DSC).
Lipids are hydrophobic compounds, except for ionizable carboxyl groups of fatty acids and do not strongly interact with microwaves (Mudgett, 1995). Therefore, the dielectric properties of fat are very low (Lizhi et al., 2008). The effect of fat on dielectric properties is due to the dilution effect in the system. In this way, the increase in fat content reduces the free quantity of water in the system, which reduces the dielectric properties (Ryynanen, 1995). Dielectric properties were used to study UHT skim, low fat and homogenized whole milk by Nunes et al. (2006). Dielectric constant and loss factor among these products were very similar in the same frequency region considered as a consequence of low fat contribution. Also Coronel et al. (2008) demonstrated the negligible effects of fat content on dielectric properties of skim milk and fat milk in the microwave range.
Dielectric properties of meat products and typical ingredients of meat manufacture in the microwave region are reported by Lyng et al. (2005). The authors found that fat had lower dielectric activity than lean tissue.
Zhang et al. (2007) examined the influence of the level of added water (21–29%), fat (12.4– 29.7%) and salt (0.4–2.4%) on radio frequency and microwave dielectric properties. Results revealed that added fat had an influence on thermal properties and a lesser influence than salt on dielectric properties.
One of the major components of food system is salt. Salt is one of the principal factor for ionic conduction. Addition of salt creates a decrease in dielectric constant due to the binding of water in the system which reduces the available water for polarization. On the other hand, addition of salt creates an increase in loss factor since more charged particles are added to the system and charge migration is increased (Mudgett, 1995). Nelson and Datta (2001) showed that in aqueous ionic solution, loss factor decreased with temperature for salt concentration less than 1.0%. On the opposite, loss factor increased as temperature for higher salt concentration in reason to a dominant ionic mechanism.
Ahmed et al. (2007) determined the dielectric properties of salted and unsalted butter in the microwave frequency range. The results showed a significantly dependence of salt among
20 the explored temperature while for frequency only loss factor decreases with an increase of this parameter.
Water
In order to investigate possible other dependences between dielectric properties and food composition, water content had to be taken as the initial guess (Datta et al.,1995).
Liquid water is a very polar compound and can easily absorb energy because of dipolar rotation. For this reason, moisture content is one of the major determinants of food dielectric properties. The increase in water content produce an increase of the polarization phenomena, raising both dielectric constant and loss factor of food system (Wang et al., 2008).
Moisture measuring, such as electrical conductance and capacitance and microwave interaction, are the most applied (Vlachos et al. 2000).
An on-line monitoring system to determine moisture content of grain during process was develop by Weidong (2007). The dielectric constant was measured with a cylindrical capacitive sensor and the proposed model were built to predict moisture content of wheat and corn. In this direction Rai et al. (2005) developed a moisture meter for grain (wheat, paddy, sunflower, mustard and soybean) by using a parallel plate capacitor as probe. The device works in the moisture range from 5 to 25%, with an accuracy of 1%. A capacitive moisture meter for corn was develop by Jùnior (2008). An alternate voltage, a divisor voltage and a capacitor in a moisture range of 11-27% offered at 10 KHz the best sensibility.
Berbert et al. (2001) predicted the water content of bean seeds by measuring the dielectric properties and proposed three models with low standard errors of calibration. Li et al. (2003) determined moisture content of cookies by using dielectric spectroscopy characterized by three electrodes used as a fringing field sensor. To measure the capacitance of sensor they used a sweep signal from 10 Hz to 10 kHz. At higher frequencies they reported an increase of sensitivity. 10 kHz were selected to calibrate the system. A linear correlation between capacitance and moisture content was determined. Furthermore the dielectric properties were used by Trabelsi et al. (2009) to estimate the moisture content of
21 shelled peanuts. The experiment was carried out in the frequency range from 8 to 14 GHz and in a temperature range from 1 to 38°C. The best equation for the moisture content prediction as function of temperature was at 10 GHz frequency. Mizukami et al. (2006) measured electrical impedance, resistance, reactance and capacitance by using four stainless steel electrodes and an LCR meter in the frequency range 10 Hz-10 MHz. The purpose of the research was the assessment of the moisture content of tea leaves. Satisfactory results were obtained only by developing a new equation that consider impedance and capacitance together. On the contrary, considering the impedance or capacitance separately, the levels of standard error was higher and low levels of correlation were achieved. An on-line monitoring system to determine moisture content of grain during process was developed by Weidong (2007). The dielectric constant was measured with a cylindrical capacitive sensor and the proposed model was built to predict moisture content of wheat and corn. A non-destructive and on-line moisture meter was proposed by Berbert et al. (2001) for the indirect determination of moisture content in coffee grains. The potential application of the knowledge of relative permittivity of coffee and bulk density of several varieties were determine and analyzed for frequency from 75 kHz to 5 MHz. A loss factor decrease was observed in reason to a frequency increase, but the behavior was less regular and dependent on moisture content.
The electrical properties of wheat bread as function of moisture content and storage time were studied by Bhargava et al. (2014).Various sections of bread were measured and the moisture content was estimated by using a multichannel ring electrodes. The capacitance variations were reported as a function of the moisture content of the bread crust, not only for the water content evaluation but also to further understand the glass transition phenomena.
Dielectric water behavior
Water in its pure liquid state is rarely found in food products. The relationship between water content and water availability plays a key role in the stability factors towards microbial spoilage and water migration (Lewicki, 2004). The influence of water on physical properties of food is dependent on the state. Water can exist in food system either in free form or in a loosely defined state called the bound state. Water in foods is dissolved as
22 constituents, physically absorbed in food capillaries or chemically bound to other molecules or absorbed on the surface of dry materials. Water can also act as plasticizer making possible movement of the structures (Seow et al., 1999).
The spatial configuration of a water molecule is pictured as a regular tetrahedron, where inside the solid there is an atom of oxygen and in corners there are positive charges and two orbitals of paired electrons (Lewicki, 2004). Partial charges lead to the interaction between other molecules. The water ability to engage in three dimensional hydrogen bounds provides a logical explanation for many of its unusual properties. Its large values of heat capacity, melting point, boiling point, surface tension and enthalpies of various phase transition are all related to extra energy needed to break intermolecular hydrogen bonds (Fennema, 1996). The permittivity of water is also influenced by hydrogen bonding. Hydrogen-bonded clusters of molecules apparently give rise to multi-molecular dipoles, which effectively increase the permittivity of water (Fennema, 1996). So, the dielectric constant and loss factor are affected by the presence of free and bound water surface charges, electrolytes, non-electrolytes and hydrogen bonds in the food product. Unfortunately, hydration of polar molecules cannot be estimated on the number of groups able to form hydrogen bonds since considering that these interactions can alter spatial conformation of a solute and solvent as well (Lewicki, 2004).
The stronger the binding forces among water and proteins or carbohydrates, the smaller is the contribution of the bound water to the dielectric constant or loss factor. In macromolecules such as proteins or polysaccharides intramolecular interaction are able to deform electron cloud and surplus or deficit of electrons occurs. Hence, hydrogen bonds can be formed and water molecules are built in the structure of biopolymers. In this case two states of water can be considered, one in which water molecules are immobilized in the structure of a macromolecule (structure water) and another state in which molecule are not completely restricted (hydration water) (Lewicki, 2004).
Apolar compounds interact with water reducing its degrees of freedom with a consequent stabilization of water molecules in space, in which the liquid acquires a structure of a solid. This phenomenon is called hydrophobic hydration. Hydrophobic interactions lead to the formation of structures in which properties of water differ from those of freezable water.
23 When water molecules are bound to hydrophilic center and polar groups do not freeze, is not available to chemical reactions and does not serve as solvent (Lewicki, 2004).
On the contrary of the large amount of data for water evaluation only few works showed the dielectric behavior of water in terms of mobility and availability. Furthermore knowledge are needed to definitely verify a strong correspondence between the dielectric behavior and water status.
Castro-Giraldez et al. (2010; 2011; 2012; 2013; 2014) demonstrated in the light of different research that dielectric measurements at microwave frequencies could be used to analyze the interactions between water bound state and different compositional parameters for controlling several industrial processes.
Henry et al. (2003) presented a methodology based on the resonant cavity in microwave domain to obtain dielectric parameters on hydrated material under test. A theoretical approach was useful to calculate the value of water activity on the surface of solid materials. Protein-water dynamics were studied by using dielectric relaxation spectroscopy. A dielectric relaxation of small polar groups of protein plasticized by water, overlapped by relaxations of un-crystallized water molecules and separate relaxation of water in the crystallized water phase were recorded (Panagopoulou et al., 2011).
DeLoor and Meijboom (1966) collected data on dielectric properties of fruit and vegetable. The authors demonstrated that at moisture contents less than 20%, dielectric properties were almost constant, showing that water was tightly bound form and very limited to move and assumes exiting status. Between moisture contents of 20 and 76% there was a rapid increase in dielectric properties due to the increase in freely available water. However, in frozen state, both dielectric constant and loss factor were small and not much affected by the increase in moisture content. This is attributed to the presence of water in bound form. Thus, since the moisture content of many food is greater than 60%, the free water with high dielectric activity should be the dominant component governing the overall behavior of foods (deLoor and Meijboom, 1966).
The relationship between the organization of cellular water, molecular interactions, desiccation tolerance, dielectric behavior of water and water plasticized biomolecules in red oak seeds were studied by Sun (2000). Three dielectric dispersion were investigated: the relaxation of loosely-bound water and small polar groups, the relaxation of tightly- bound
24 water, carbohydrate chain, large polar groups of molecules and the freezing in molecular mobility.
25
1.4 Methods for dielectric properties measurements
Dielectric properties measurement concerns the selection of different techniques depending on the nature of dielectric material, frequency of interest, degree of accuracy required and availability of the measuring equipment (Nelson and Datta et al, 2001). Moreover the choice of the equipment and sample holder should be made upon the dielectric material to be measured, the extent of the research, the device availability and the economic resources for the study (Venkatesh and Raghavan 2005).
Several foodstuff can be explored with improved sensing devices for control and automation, such as the moisture sensing devices that create an absolute possibility to well employ dielectric properties of materials as a consequence of more adaptable characteristic of the equipment (Venkatesh and Raghavan 2005).
Several methods can be used ranging from direct current to microwaves to determine the electrical properties of biological materials by using different devices including parallel plate capacitor, coaxial probe, lumped circuit, waveguide, resonant structure, inductance, capacitance, resistance (LCR) meter, impedance analyzer and scalar and vector analyzer (Nelson, 1999; Içier & Baysal, 2004; Ragni et. al, 2006; Sucher and Fox 1963; De Loor and Meijboom 1966; Bengtoss and Risman, 1971; Thompson and Zachariah, 1971; Metaxas and Meredith 1983; Nyfors and Vainikainen, 1989; Hewlett Packard, 1992).
The challenge in performing accurate permittivity measurements is not only related to the choice of the technique but also concerns designing of the material sample holder and circuit modeling for reliable calculation of permittivity (Nelson 1998). Nelson (1973, 1983, 1984, 1991) used different sample holders with various microwave measurement systems assembled for dielectric parameter evaluation of grain, seed, fruit and vegetable in the frequency range 1 to 22 GHz. For example if a radiofrequency circuit is well designed and it can be possible to register impedance or admittance data and the dielectric properties can be further calculated by using specific equations related to the material. Corcoan et al. (1970) reported dielectric properties of grain with a precision bridge for audio frequencies from 250 Hz to 20 GHz with a coaxial sample holder. Grain and seed samples were also tested by using a Q-meter based on resonant circuit between 1 and 50 MHz (Nelson 1991).
26 A review of the techniques for permittivity estimation in the low medium and high frequency ranges including the use several bridges and resonant circuits was written by Field (1954).
Software may also be required to convert measured data from the instrument in the most convenient physical quantity, allowing also the extraction of the properties of interest.
Accurate and useful analysis for most food products can be provide by automated network analyzers, but with an application limit due to the high cost of the equipment, such as Time Domain Reflectometry technique. In frequency range near to 915 and 2450 MHz dielectric properties can be performed with cavity perturbation technique by using a dielectric analyzer instead of a network analyzer. A vector analyzer is versatile but expensive and can be adapted for several studies, while scalar network analyzer and impedance analyzers are quite less expensive. For limited studies, more suitable equipment can be radiofrequency or microwave devices if a apposite sample holder is set up.
Economic instrumental chain, such as system using scalar network or impedance analyzers, could be attractive as function of its accuracy, ease of operation, simple sample preparation, convenient temperature control, and the affordability of owning this equipment (Datta et al, 2014). Furthermore impedance analyzers and LCR meter are used to measure the material properties at lower frequencies. Subsequently the principal technique are reported.
Waveguide and coaxial line
Transmission line methods involve placing the material inside a portion of enclosed conveyance system (Nelson 1998). The waveguide is a method belonging from the transmission line that exploits the transport of an electromagnetic wave within a closed cavity for the detection of the dielectric properties of the material (Behlriti et al., 2013). Each waveguide has endless configurations of electromagnetic field called MODES. The characteristics of MODES depend on size of the section, type of material and frequency used (Green, 1996). The MODES are generally classified according to the nature of the components of the electric field. The MODES most often in use are the TE MODE (transverse electric), TM MODE (transverse magnetic) or TEM MODE (transverse electromagnetic).
27 The waveguide system required a specific design of the device with particular attention paid to the dimension of the sample holder (vonHippel, 1954). Another critical aspect for a waveguide technique is a precise sample preparation requirement, with constant geometry and no air gaps. Both these factors can compromise the measurements by introducing errors. The geometry of the material influence the electromagnetic wave with course distortions that involved in wrong spectrum acquisition. Air gaps is a very important aspect to take into account as a consequence of very different behavior respect biological material. It is well known that air has a very low dielectric constant determining relevant changes in dielectric properties determination, as a consequence the sample does not have air gaps to avoid possible mistakes.
The values of dielectric constant and loss factor can be derived from the transmission line theory, which indicates that these properties can be calculated by measuring the phase and amplitude of a reflected microwave signal from a dielectric material placed against the end of a transmission line, such a waveguide (Roberts and von Hippel 1946; von Hippel 1954). The waveguide dimension are: a (width), b (height) and d (length). The cut off wavelength in the guide is λc=2a. The cut off frequency (fc) of the guide is given by the following expression (Baker-Jarvis et al., 1990):
)
(
c
2
2 2 2 r t rc
fc
ε
ε
ε
λ
+
+
=
The formula assumed a waveguide characterized by single mode propagation (mode TE10), completely filled with the material under test.
In agri-food sector this kind of technique is not so common. Hunger et al. (2011) describe path length waveguide setup to obtain accurately measurements of complex permittivity of liquid, such as water and water-ethanol mixtures, in the frequency range 60 to 90 GHz. The authors presented the technique to investigate low-loss as well as high loss liquids. Green (1996) studied the dielectric properties of cheddar cheese at microwave frequency (from 750 MHz to 12.4 GHz). The physical and chemical properties of the cheese were also measured and correlated with dielectric properties.
28 The waveguide technique was implemented for the evaluation of ripening indices of kiwi fruit (Ragni et al., 2012) and the freshness of the eggs (Ragni et al. , 2010), the composition of the grated Parmigiano Reggiano cheese (Cevoli et al. , 2012).
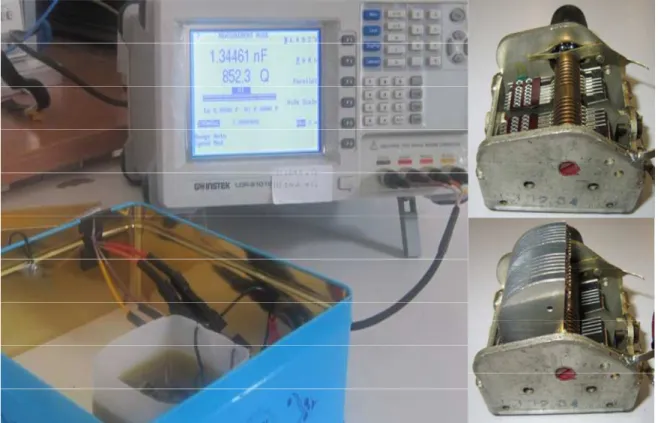
Parallel plate capacitor
The parallel plate capacitor method involves sandwiching a thin sheet of material between two electrodes to form a capacitor. A typical measurement system using the parallel plate method consists of an LCR meter or impedance analyzer and fixtures. It is an economic method and relatively simple. In a parallel plate capacitor, capacitance is directly proportional to the surface area of the conductor plates and inversely proportional to the separation distance between the plates. A capacitor is a device which is able to store energy and electric charge, made of two isolated conductors at closer distance. These two conductors are called plates where a uniform electric field can be generated. If the charges on the plates are +q and −q respectively, and V gives the voltage between the plates, then the quantity of charge Q is proportional to the voltage applied:
Q = CV
C is the capacitance and it is measured in Farad (F). The capacitance of the capacitor is dependent only by its structure and dimension, if a dielectric is absent between plates. So the related capacitance is:
C = Ɛ0A / d
Where A is the plates area, d the distance between plates and Ɛ0 is the dielectric constant of free space (8.85 pF/m). In the real case when an analysis is performed a dielectric is inserted between plates and generates voltage decrease. The capacitance in this case increases and if a saturation of the space between plates is considered, the capacitance raises with an a-dimensional factor Ɛr, the dielectric constant of the material submitted (Agilent.com).
29 Capacitive technique is employed for evaluation of water in wheat (Berbert and Stenning, 1996), water and bulk density in safflower (Sacilik et al. 2007), ripening of banana fruits (Soltani, 2005). Afzal et al 2010 estimated leaf moisture content by measuring the dielectric constant of leaf with the variation of capacitance by employing a capacitive sensors in five different types of crops. The dielectric constant of water at room temperature is 80 greater than that of air or solid, 1 and 2-5 respectively. According to their results, the capacitance was affected by the amount of ions and the thickness of the leaf. Campbell at al. (2005) developed a capacitive system for monitoring bees passing troughs a tunnel that was able to recognize between entering and exiting bees and provide information on the size and speed of each bee. They used a ring sensor which has small electrodes respect to a parallel plate sensor and allow a decreased size and precisely position during manufacturing.
Jarimopas et al. (2005) designed an electronic device with a cylindrical capacitive sensor to select vegetables and fruits by volume. Thirty samples were used to calibrate the device and a very good correlation was obtained compared to the water displacement method. Considering watermelons, large cucumbers, wax gourds and guavas were obtained the subsequently R2 0.999, 0.957, 0.999 and 0.99. Ragni et al. (2006, 2008) used a simple dielectric technique based on a sine wave radio frequency oscillator with a parallel plate capacitor probe to determine the quality of eggs during storage.
Time-Domain Reflectometry method
In the 1980s a new technique, with a high accuracy within a few percent of error was developed for the dielectric food properties assessment and is called Time Domain Reflectometry (TDR) (Afsar et al. 1986).
Time domain spectroscopy utilizes the reflection characteristics of the material under test to compute the dielectric properties. The TDR is a technique based on the generation of an electromagnetic signal and the time-domain analysis of the reflected signal from a generic load (sample). The instrumental chain setup is made of an electric step generator and an oscilloscope for the digital sampling. In this way, an electromagnetic pulse is propagated along the transmission line. The reflected and the transmitted signal are shown on the TDR
30 oscilloscope. TDR reveals the characteristic impedance of the line and shows the location and the type (resistive, inductive or capacitive) of each discontinuities along the line.
The transmission line consists of a continuous structure of resistors, inductors, and capacitors. Assuming that the line has an infinite length and characteristic, L (inductance), R (resistance), G (conductance) and C (capacitance) are defined per unit of length:
C
j
G
L
j
R
Z
Z
inω
ω
+
+
=
0Where Z0 is the characteristic impedance of the line and ω is the frequency of the applied voltage. The impedance is a physical magnitude vector that represents the dipole strength of opposition to an alternating electric current passage. The impedance is expressed as complex number and it takes into account the phenomena of electricity consumption and accumulation of electromagnetic energy.
The impedance is described mathematically by a complex number whose real part represents the dissipative phenomenon and corresponds to the resistance (R); the imaginary part, said reactance (X) is associated with the phenomena of energy accumulation.
jX
R
Z
=
+
A voltage supplied by the generator will require a finite time to walk the line up at the point x. The phase of the voltage that remains along the line will result in a delay with respect to the generator for an amount of β per unit length.
The TDR technique requires a small sample size and homogeneous substances to be analyzed and it is an excellent tool for advanced research on the interaction of electromagnetic energy over a wide range of frequency, despite the high cost (Mashimo et al. 1987; Ohlsson et al. 1974).
TDR was employed for the assessment of soil water content and salinity (Topp et al.,1982; Dalton and Van Genuchten, 1986; Noborio, 2001) and for dielectric permittivity and conductivity measurements of different kinds of liquids such as alcohols (Fellner-Feldegg,
31 1968), carbohydrate solutions (Van Loon et al., 1995), micro-emulsions (Nozaki and Bose, 1990) and various materials (Pettinelli and Cereti, 2002). Puranik et al. (1991) investigated the dielectric properties of honey-water mixture by using TDR technique in the frequency range 10 MHz-10 GHz at 25°C. Ragni et al. (2012) assessed the water content of EVOO and characterized different content of fatty acids alkyl esters of EVOO (Berardinelli et al., 2014) by using time domain reflectometry technique. TDR technique was able to predict very small water quantities in oil with R2 value up to 0.984 and a root mean square error of prediction of about 55 mg of water/kg of oil.
Cavity perturbation technique
The cavity perturbation technique is one of the most commonly used techniques for measuring the dielectric properties of homogenous food materials because of its simplicity, ease of data reduction, accuracy, and high temperature capability (Venkatesh and Raghavan, 2005; Sucher and Fox 1963; de Loor and Meijboom 1966; Bengtsson and Risman 1971; Metaxas and Meredith 1983). The technique is also well suited to low-loss materials. It is based on the shift in resonant frequency and the change in absorption characteristic of a tuned resonant cavity due to insertion of a sample of target material. Changes in the center frequency and width due to insertion of the sample, provide information to calculate the dielectric loss. The resonant cavities can be designed in two mode of propagation of the electromagnetic fields, the transverse magnetic (TM ) and the transverse electric (TE) which is based on the shift in resonant frequency and the change in absorption characteristic of a tuned resonant cavity. Changes in the center frequency and width due to the insertion of the sample provide information useful to calculate the dielectric constant while changes in the Q-factor are used to estimate the loss factor. The size of the cavity must be designed according to the frequency of interest, higher frequency need smaller cavity. The size of cavity must be designed for the frequency of interest taking into account that the relationship is inverse. It is quite reasonable that each cavity need a calibration, but after that permittivity data of different samples can be rapidly determined. Sample preparation is relatively easy, and the permittivities of a large number of samples can be determined in a short time.
32 This method can be used to determine the dielectric properties of many agri-food products over a wide range of frequencies, temperatures and compositions (Bengtsson and Risman 1971; Ohlsson and Bengtsson 1975; Venkatesh 1996). The cavity perturbation method was used to investigate dielectric properties of supersaturated a-D-glucose aqueous solutions (45-56% w/w) at 2.45 GHz from 25 to 80°C. Liao et al. (2001) reported the measurement details and the perturbation equations adapted for dielectric constant and loss factor calculation. Moreover Sharma and Prasad (2002) measured the dielectric properties of garlic at selected levels of moisture by using cavity perturbation in the temperature range 35-75°C. The authors determined the transmission characteristic by Hewlett-Packard 5410B Network Analyzer and S-parameter test set (HP 1992) combination.
Open-ended coaxial probe technique
The open ended coaxial probe method can be described as a modification of the transmission line method which calculates from the phase and amplitude of the reflected signal at the end of an open or ended line directly inserted into the sample. Care must be exercised with this technique because errors are introduced at both very low frequencies and very high frequencies, as well as at low values of dielectric constant and loss factor. Interpretation for lower loss materials, such as fats and oils, must be treated with caution. Nelson et al. (2007) considered the external part and the internal tissue of four cultivars of watermelons over a range of maturities by using an open-ended coaxial line probe and an impedance analyzer. Dielectric constant and loss factor were provided from 10 MHz to 1.8 GHz frequency range improving permittivity data. The analysis of the two main parameter showed the dominance of ionic conduction at lower frequencies and dipolar losses at higher frequencies. A correlation between soluble solids content and dielectric constant and loss factor was obtained with and R2 of 0.932.
Particularly for liquid and semi-solid food materials open ended coaxial-line probes have been used for permittivity measurements (Grant et al. 1989; Blackham and Pollard 1997), in particular for fresh fruit and vegetables investigation (Ohlsson et al. 1974; Nelson et al. 1994).
33 Such technique is not free of errors, in fact density variation of the material, air gaps or bubbles between the end of the coaxial probe and the sample can compromise the results. Moreover this tool is not suitable for granular and pulverized samples (Venkatesh and Raghavan 2005). This technique can be efficient in the frequency range from 915 to 2450 MHz (for materials with loss factor greater than 1), but care should be given to errors possible at very low or very high frequencies (Sheen and Woodhead 1999).
Dielectric properties of fruit commodities and four associated insect pests were measured with an open ended coaxial probe device in the frequency range 1-1800 MHz between 20 and 60°C of temperature (Wang et al. 2003).
Ragni et al. (2007) investigated the quality parameters of shell eggs during storage by using an open-ended coaxial probe measurement technique. The frequency explored ranged from 10 to 1800 MHz. R2 values up to 0.985 and 0.980 were obtained. Low coefficient of determination were determined for yolk index, thick albumen height, and Haugh unit. Moreover the authors investigated the dielectric parameter of fresh hen in the frequency range 20-1800 MHz, on thick albumen and yolk of eggs after 1, 2, 4, 8 and 15 days of storage at room temperature. Dielectric constant and loss factor of yolk raised with the storage time, until to reach a maximum after 15 days of storage (22%).
Free space transmission technique
Free-space transmission technique is a non-destructive and non-contact measuring method (Redheffer, 1966). It does not require special sample preparation, therefore, it is particularly suitable for materials at high temperatures and for inhomogeneous dielectrics (Kraszeski 1980, 1996). In addition, it may be easily implemented in industrial applications for continuous monitoring and control. In a free space transmission technique, a sample is placed between a transmitting antenna and a receiving antenna, and the attenuation and phase shift of the signal are measured (Venkatesh and Raghavan 2005). The results can be used to compute the material dielectric properties. Accurate measurement of the permittivity over a wide range of frequencies can be achieved by free-space techniques. In most systems, the accuracy of dielectric constant and loss factor depends mainly on the performance of the measuring system and on the validity of the equations used for the calculation. The usual
34 assumption made for this technique is that a uniform plane wave is normally incident on the flat surface of a homogenous material, and that the planar sample has infinite extent laterally, so that diffraction effects at the edges of the sample can be neglected. To enhance the measurement accuracy, special attention must be paid to the choice of the radiating elements, the design of the sample older, the sample geometry and location between the two radiating elements. To avoid disturbances resulting from multiple reflections between samples and antennas and problem caused by diffraction of edges for free space measurements an attenuation through the sample layer should be maintained (Trabelsi et al. 1998). Trabelsi et al. (1997) accounted for multiple reflections, mismatches and diffraction effects at the edges of the sample as the main sources of errors. In this way special attention must be paid to choice of radiating elements, design of sample holder and sample geometry. A free space measurements with a vector analyzer were used to obtain microwave dielectric properties of wheat and corn. The rectangular samples holders were placed between the horn antennas and a similar radiating element (Trabelsi et al., 1997).
Only a brief review, respect the amount of literature available, of the main work conducted on food material by using the free space transmission technique is subsequently reported. A free space transmission system, including a vector network analyser, horn/lens antennas, holder for grain and oilseed samples was used for measures reliable permittivity data for wheat, shelled corn and soybeans (Trabelsi et al., 2002). Dielectric constant and loss factor for wheat, corn and soybeans are listed for reference at frequencies from 5 to 17 GHz at different densities and moisture levels at about 23 °C.
Free space transmission technique was applied to measure the moisture content of powdered food, such as wheat flour, milk powder and coffee powder. In frequency range from 1 to 15 GHz the microwave attenuation, phase shift and moisture density were measured and correlated with correlation coefficient greater than 0.91 (Kim et al., 2006).
The waste of several agricultural products, such as rice husk, rice straw, and kenaf were studied in the frequency range of 2.2 to 3.3 GHz. The dielectric properties were determine by using microwave free-space transmission measurements technique. From the result obtained, rice husk was found to possess a high dielectric constant compared to rice straw and kenaf, due to the natural properties of rice husk. The large surface area of rice straw has provided the ability to absorb more electromagnetic signal (Wee et al. 2009) .
35
Micro-strip transmission line
The effective permittivity, represented by a combination of the substrate permittivity and the permittivity of the material above the line, of a micro-strip transmission line is strongly dependent on the permittivity of the region above the line (Venkatesh and Raghavan 2005). This effect has been utilized in implementing microwave circuits and to a lesser extent on the investigation of dielectric permittivity. Furthermore, the measurement of effective permittivity is relatively straightforward, and is well suited for implementation in industrial equipment. Such system could be based on determining the effective permittivity of a micro-strip line covered by an unknown dielectric substance (Datta et al., 1995). Unfortunately its applicability to food and agricultural material processing would still be an anticipatory issue at this stage (Venkatesh and Raghavan 2005).
36
1.5 References
Afzal A., Mousavi S.F., Khademi M. (2010). “Estimation of leaf moisture content by measuring the capacitance” Journal of Agricultural Science and Technology 12: 339-346. Agilent Technologies, Inc. 2006. 5989-2589 EN. agilent.com/find/open.
Ahmed J., Ramaswamy H.S. and Raghavan (2007). “Dielectric properties of soybean protein isolate dispersions as a function of concentration, temperature and pH” LWT- Food Science and Technology, Volume 41, Issue 1, p 71-81.
Al-Holy, M., Wang, Y., Tang, J., & Rasco, B. (2005). Dielectric properties of salmon (Oncorhynchus keta) and sturgeon (Acipenser transmontanus) caviar at radio frequency (RF) and microwave (MW) pasteurization frequencies. Journal of Food Engineering, 70, 564e570.
Amhed, J., Ramaswamy, S., & Raghavan, V. (2007). Dielectric properties of butter in the MW frequency range as affected by salt and temperature. Journal of Food Engineering, 82, 351e358.
Barbosa-Cánovas G.V., Juliano P., Peleg M., (2006). "Dielectrics (physics)". ENGINEERING PROPERTIES OF FOODS, in Food Engineering, [Ed. Gustavo V. Barbosa-Cánovas], in Encyclopedia of Life Support Systems (EOLSS), Developed under the Auspices of the UNESCO, Eolss Publishers, Oxford ,UK.
Belrhiti M. D., S. Bri, A. Nakheli, A.Mamouni, (2013). “Dielectric Properties by Rectangular Waveguide” Int. J. Emerg. Sci., 3(2), 163-171.
Bengtsson N. E. and P.O. Risman (1971). “Dielectric properties of food at 3 GHz as determined by cavity perturbation technique.” II. Measurements on food materials. Journal of Microwave Power 6 (2):107-123.
Berbert, P. A., Queiroz, D. M., Sousa, E. F., Molina, M. B., Melo, E. C., & Faroni, L. R. D. (2001). Dielectric properties of parchment coffee. Journal of Agricultural Engineering Research, 80(1), 65e80.
Bhargava Nidhi, Ritu Jain, Ila Joshi, K.S. Sharma (2014). “Investigation of dielectric properties of some varieties of wheat and their correlation with food nutrients”. International Journal of Engineering Science and Innovative Technology (IJESIT) Volume 3, Issue 2.