Alma Mater Studiorum – Università di Bologna
DOTTORATO DI RICERCA IN
SCIENZE BIOTECNOLOGICHE E FARMACEUTICHE
Ciclo XXX
Settore Concorsuale: 05/E1 - BIOCHIMICA GENERALE E BIOCHIMICA CLINICA Settore Scientifico Disciplinare: BIO/10 - BIOCHIMICA
DEVELOPMENT OF COMPUTATIONAL METHODS
FOR BIOLOGICAL COMPLEXITY
Presentata da:
SAMUELE BOVO
Coordinatore Dottorato
Supervisore
Prof. Santi Mario Spampinato
Prof.ssa Rita Casadio
i
In the appendix are included the printed versions of following journal articles:
1. Bovo S, et al. (2016) NET-GE: a web-server for NETwork-based Gene
Enrichment of sets of human genes related to the same phenotype. Bioinformatics,
32(22):3489-3491 PMID:27485441
2. Bovo S, et al. (2017) From Protein Variations to Biological Processes and
Pathways with NET-GE. Genomics and Computational Biology, 3(3); e45;
3. Babbi G, et al. (2017) eDGAR: a database of Disease-Gene Associations with
annotated Relationships among genes. BMC Genomics, 18(Suppl5):554.
PMID:28812536.
4. Xu Q, et al. (2017) Benchmarking predictions of allostery in liver pyruvate kinase
in CAGI4. Human Mutation, 38(9):1123-1131. PMID:28370845.
5. Daneshjou R, et al. (2017) Working towards precision medicine: predicting
phenotypes from exomes in the Critical Assessment of Genome Interpretation (CAGI) challenges. Hum Mutation, 38(9):1182-1192. PMID 28634997.
ii
iii
Abstract (English)
The cell is a complex system. In this system, the different layers of biological information establish complex links converging in the space of functions; processes and pathways talk each other defining cell types and organs. In the space of biological functions, this lead to a higher order of “emergence”, greater than the sum of the single parts, defining a biological entity a complex system. The introduction of omic techniques has made possible to investigate – in a single shot – the complexity of each biological layer. With the different technologies we can have a near complete readout of the different biomolecules. However, it is only through data integration that we can let emerge and understand biological complexity. Given the complexity of the problem, we are far from having fully understood and developed exhaustive computational methods. Thus, this make urgent the exploration of biological complexity through the implementation of more powerful tools relying on new data and hypotheses. To this aim, Bioinformatics and Computational Biology play determinant roles. The present thesis describes computational methods aimed at deciphering biological complexity starting from genomic, interactomic, metabolomic and functional data.
The first part (chapters 1 – 5) describes NET-GE, a network-based gene enrichment tool aimed at extracting biological functions and processes of a set of gene/proteins related to a phenotype. NET-GE exploits the information stored in biological networks, to better define the biological events occurring at gene/protein level. When tested against set of genes related to OMIM diseases (#244 gene set), NET-GE retrieves enriched terms not detectable by standard method, in a number of diseases ranging from 19% to 40% of the whole OMIM set.
The first part (chapters 6 – 7) describes also eDGAR, a database collecting and organizing gene-disease associations data as retrieved from OMIM, Humsavar and ClinVar. The database is aimed at providing a comprehensive knowledge of the molecular signatures at the basis of 2,672 diseases (621 are polygenic, i.e. associated to multiple genes). Thanks to its ability in detect new functional terms, NET-GE is used in eDGAR to enhance the understanding of the biological function involved in the development of diseases.
The second part (chapter 8 – 9) deals with metabolomics. I describe a new way to perform metabolite enrichment analysis. Given the strict relationship among genes, proteins and metabolites, I explore the metabolome by exploiting the features of an interactome. To do that, I developed NET-GEM, a version of NET-GE rewritten to enrich functions and pathways starting from a list of metabolites. The NET-NET-GEM analysis of a set of 41 metabolites related to Parkinson’s disease (PD) detected pathways not highlighted by a canonical metabolite enrichment tool. A fraction of these pathways is retrievable also when performing a NET-GE analysis with a gene set of genes related to PD. This highlights the notion that complementary information is stored in the gene and metabolite layers of biological complexity.
The third part (chapter 10 – 11) describes the methods and results obtained in the CAGI experiment, a community experiment aimed at assessing computational methods used to predict the impact of genomic variation on a phenotype. Different challenges were proposed in the CAGI4 edition, and here I describe the methods related to three of them: two challenges involving the prediction of the healthy status based on exome data, and one challenge related to the prediction of the effects of mutation on the activity and allosteric regulation of the human pyruvate kinase.
Overall, the developed methods aim at efficiently integrate different data and boost the way to decipher and understand biological complexity.
iv
Abstract (Italian)
La cellula è un sistema complesso. In questo sistema, i differenti layer biologici stabiliscono relazioni che danno origine a funzioni e pathway molecolari. Un sistema è solitamente caratterizzato da proprietà emergenti, dove il risultato finale e maggiore rispetto alla somma delle singole pasrti. Nel contesto biologico, le interazioni tra layer fanno emergere informazioni come la specificità cellulare e di organo.
L’introduzione delle diverse tecnologie omiche ha reso possibile investigare la complessità di ogni layer. Con una singola analisi, le diverse tecnologie riescono a restituire un profilo biomolecolare quasi completo. Tuttavia, per avere una chiara comprensione del problema biologico, i diversi profili devono essere integrati. Attualmente siamo distanti dall’avere sviluppato metodi per l’analisi della complessità in modo esauriente; questo rende urgente l’implementazione di metodi sempre potenti, bastati su nuovi dati e nuovi approcci. A tale scopo, la Bioinformatica e la Biologia computazionale giocano un ruolo fondamentale.
Questa tesi descrive nuovi metodi computazioni atti alla comprensione della complessità biologica a partire da dati genomici, di interazione, di metaboliti e di funzione biologica.
Nella prima parte (capitoli 1 – 5) introduco NET-GE, un tool che si propone di estrarre funzioni biologiche condivise tra geni, tramite l’utilizzo di reti di interazioni proteica (STRING). Quest’ultime permettono infatti di meglio definire le funzioni stesse. Testato con set di geni coinvolti in malattie (#244 malattie ricavate da OMIM), in un numero di malattie che varia dal 19% al 40% (a seconda del metodo e delle funzioni analizzate), NET-GE ha arricchito per nuove funzioni. Nella prima parte (capitoli 6 – 7) descrivo anche eDGAR, un
database che raccoglie associazioni gene-malattia da diverse risorse (OMIM, ClinVar, Humsavar). Per un totale
di 2,672 malattie (621 poligeniche; legate a più geni), eDGAR si propone di dare una completa caratterizzazione molecolare del fenotipo finale. Grazie all’abilità di arricchire per nuove funzioni, NET-GE è usato in eDGAR per migliorare la caratterizzazione funzionale delle diverse malattie.
La seconda parte (capitoli 8 – 9) tratta di metabolomica. Descrivo un nuovo metodo per l’analisi funzionale di dati metabolomici basato sullo stretto rapporto tra geni, proteine e metaboliti. Ho sviluppato NET-GEM, una versione di NET-GE riscritta per lavorare con dati metabolomici. In un caso di studio relativo alla malattia di Parkinson (PD), l’analisi di 41 metaboliti ha portato ad ottenere risultati interessanti: NET-GEM arricchisce per
pathway non individuabili con metodi standard (ma riscontrati in letteratura). Inoltre, parte di questi risultati si è
ottenuta tramite l’analisi – basata su NET-GE – di un set di geni relativo al PD. Questo ci permette di rimarcare quanto genomica e metabolomica siano tecniche complementari, con parte dell’informazione condivisa dai diversi layer biologici.
La terza ed ultima parte (capitoli 10 – 11) tratta del CAGI, un esperimento internazionale atto a valutare metodi computazionali utilizzati nella predizione dell’impatto di varianti genomiche a livello fenotipico. Diverse “sfide” sono state rilasciate nella quarta edizione. Qui descrivo i metodi sviluppati per affrontare tre di loro. Due sfide riguardavano la predizione dello stato di salute (sano/malato) partendo da dati di esomica. La terza sfida ha riguardato la predizione dell’effetto di mutazioni sull’attività e regolazione allosterica della piruvato kinasi umana.
Complessivamente, questi metodi si propongono di integrare in modo efficiente diversi dati biologici, migliorando il modo di comprendere e di analizzare la complessità biologica.
v
Acknowledgments
It goes without saying that many people have contributed in a scientific way to this thesis. I thank them all for the continuous support, guidance, insights and discussions given to me during the last three years.
Personally speaking, I would like to thank:
• my advisor, Prof. Rita Casadio, for teaching me what determination is and how to put it in every day of my life;
• all the members of the Bologna Biocomputing Group: Prof. Pier Luigi Martelli, Dr. Giuseppe Profiti, Dr. Giulia Babbi, Dr. Castrense Savojardo, Dr. Francesco Aggazio, Dr. Pietro Di Lena and Prof. Piero Fariselli (names randomly ordered);
• Prof. Luca Fontanesi, for providing me the opportunity to learn and participate in many different projects since the first time I met him;
• all the members of the Fontanesi’s Lab: Dr. Giuseppina Schiavo, Dr. Anisa Ribani, Dr. Valerio Joe Utzeri and Dr. Claudia Geraci;
• Dr. Gianluca Mazzoni, a special person always there for me; there are no words to express my gratitude to him;
• the Ph.D. program coordinator, Prof. Santi Mario Spampinato, for its passion and availability;
• the people I met in Bologna and around the world, that made the Ph.D. experience the best one I ever had.
vi
1
Contents
ABSTRACT (ENGLISH) III
ABSTRACT (ITALIAN) IV
ACKNOWLEDGMENTS V
Part I - Network-based
gene enrichment analysis with NET-GE
1 INTRODUCTION 5
1.1 DECIPHERING BIOLOGICAL COMPLEXITY 5
1.2 PROTEIN-PROTEIN INTERACTION: WHY IS IT SO IMPORTANT? 7
1.3 STRING AS COMPREHENSIVE PPI NETWORK 8
1.4 PROTEIN-PROTEIN INTERACTIONS NETWORKS AS GRAPHS 9
1.5 GENE/PROTEIN ANNOTATION AND RELATED DATABASES 11
1.5.1 KEGG 12
1.5.2 REACTOME 12
1.5.3 GENE ONTOLOGY 13
1.5.4 HIERARCHICAL REPRESENTATION OF FUNCTIONAL ANNOTATIONS 13
1.6 QUANTIFYING THE FUNCTION SPECIFICITY AND SIMILARITY. 14
1.7 GENE ENRICHMENT ANALYSIS 15
1.7.1 GENE ENRICHMENT ANALYSIS: HOW DOES IT WORKS? 15 1.7.2 CLASSIFICATION OF GENE ENRICHMENT METHODS 16 1.7.3 FROM STANDARD TO NETWORK-BASED GENE ENRICHMENT 17
2 NET-GE 19
2.1 DATABASES 19
2.2 MODULE EXTRACTION 20
2.3 ENRICHMENT PROCEDURE 23
3 NET-GE WEB SERVER 24
3.1 NET-GE WEB SERVER: INPUT 25
3.2 NET-GE WEB SERVER: OUTPUT 25
2
4 BENCHMARKING THE METHOD: A QUANTITATIVE APPROACH. 27
5 STUDY CASES: A QUALITATIVE EVALUATION OF NET-GE. 29
5.1 THE ADHD STUDY CASE 30
5.2 THE OCD STUDY CASE 32
6 NET-GE AND EDGAR: MOLECULAR SIGNATURES OF DISEASES 34
6.1 FUNCTIONAL RELATIONSHIPS OF DISEASE-RELATED GENES 34
6.2 HYPOPARATHYROIDISM AS CASE STUDY 37
7 CONCLUSIONS 37
Rethinking metabolite
enrichment analysis: NET-GE
M8 INTRODUCTION: WHY METABOLOMICS? 41
8.1 HOW TO FUNCTIONALLY INTERPRET METABOLOMIC DATA 42
8.1.1 METABOLITE-RELATED DATABASES: A BRIEF OVERVIEW. 42
8.2 NET-GEM:
RETHINKING METABOLITE FUNCTIONAL ASSOCIATION. 43
8.2.1 NET-GEM:
HOW DOES IT WORK? 43
8.2.2 IMPLEMENTING NET-GEM: DEFINING A METABOLITE-GENE MAPPING TABLE 44
8.2.3 WHY GENES INSTEAD OF METABOLITES?A CRITICAL VIEW 44 8.2.4 THE STATISTICS AT THE BASIS OF NET-GEMAND MBROLE2.0 46 8.2.5 TESTING THE METHOD: THE PARKINSON'S DISEASE CASE STUDY 46
9 CONCLUSIONS 50
Part III
The Critical Assessment of Genome
Interpretation (CAGI) experiment
10 INTRODUCTION 52
10.1 THE PYRUVATE KINASE CHALLENGE 53
10.2 DATASETS 55
10.3 METHOD 56
10.4 PERFORMANCE ASSESSMENT 57
10.5 RESULTS 59
10.5.1 PREDICTION OF THE L-PYK ENZYME ACTIVITY 59
3
10.5.3 PREDICTION OF QAX-F-1,6-BP 63
10.6 CONCLUSION 63
11 CAGI4 EXOME CHALLENGES 64
11.1 CROHN’S DISEASE 64 11.2 BIPOLAR DISORDER 65 11.3 DATASETS 65 11.3.1 CROHN'S DISEASE 65 11.3.2 BIPOLAR DISORDER 66 11.4 METHODS 66
11.4.1 DATA QUALITY ASSESSMENT 66
11.4.2 VARIANT/GENE ANNOTATION 67
11.4.3 GENE SELECTION 67
11.4.4 ASSESSORS EVALUATION 68
11.5 RESULTS 69
11.5.1 CROHN’S DISEASE EXOME CHALLENGE. 69 11.5.2 BIPOLAR DISORDER EXOME CHALLENGE. 71
11.6 CONCLUSION 73
12 GENERAL CONCLUSIONS 73
13 REFERENCES 75
14 SUPPLEMENTARY MATERIAL 87
15 LIST OF PUBLICATIONS 90
15.1 PEER-REVIEWED PUBLICATIONS RELATED TO THIS THESIS 90
15.2 OTHER PEER-REVIEWED PUBLICATIONS 90
15.3 ABSTRACTS AND POSTERS 91
4
Part I
Network-based
5
1 Introduction
1.1 Deciphering biological complexity
Omics techniques have changed the way to investigate the complexity of a biological system (Gullapalli et al., 2012; Robinson, 2014). But, what is a biological system? And why is it defined as complex?
A system can be defined as an integration of parts or elements, connected in some form of interaction or interdependence to form a (complex) unitary whole (Misra, 2008). Usually, systems share common characteristics such as: (i) structure, defined by components and their parts, (ii) behaviour, which involves input, processing and output of mass, energy, information and data, (iii) interconnectivity, meaning that the different parts of the system have functional and structural relationships to each other (Schreuder, 2014). In the biological context, proteins are systems, so are cells and organs. Moreover, all these entities linked together define an organism as a system too.
Although there is no clear definition of “complex system”, there is an understanding that when the single parts of a systems interact, the resulting global system displays emergent collective properties, culminating in a higher order of organization and functions, whose behaviour cannot be reduced to the sum of its parts (Casti et al., 2003). The interactions among the single parts are organized in non-random and non-completely ordered way. Moreover, the system units establish non-linear interactions (meaning that a small perturbation may cause a large effect, a proportional effect, or no effect at all) making the systems chaotic. When dealing with biological systems, we have also to consider that they cannot be treated as isolated entities: noise and stochastic behaviour have to be taken into account.
Omics techniques allow to explore the different single levels of biological complexity. However, it is only through multi-omic data integration that the understanding of each single biological layer can be boosted. Genomics can reveal the involvement of some genes or variations in the development of a disease or phenotype. However, how do these genes lead to the final phenotype? Beyond the investigation at the genome layer, genes/proteins must be analysed in the context of their interactions and in relation to biological processes/pathways, shedding light on the properties of the systems that cannot be derived from the analysis of the isolated elements. Thus, alongside the development/use of experimental techniques, we need to develop computational methods for data interpretation and integration in order to achieve a higher-level biological knowledge.
6
In the last twenty years of genomic research, a massively amount of data has been produced to decipher, understand and characterize phenotypes. As consequence, NGS based experiments and big data analysis have provided lists of “interesting” variants/genes/proteins that, in the context of functional genomics (Pevsner, 2015), need annotations for been reconciled with known and putatively common biological processes/pathways describing the phenotype. To highlight this “genes/proteins – biological processes/pathways – phenotype” relation, functional interpretation of gene/protein sets is usually done by applying gene enrichment analysis, i.e. a statistical procedure that consist of testing whether a gene/protein set is enriched with certain biological functions (Huang et al., 2009a). Gene enrichment procedures can be classified in two macro-classes: standard and network-based. The latter class take advantage from biological networks, by modelling the complexity of processes occurring in the cell through algorithms exploiting graph features (Junker et al., 2008).
The work I describe in this first part is a novel network-based method for gene enrichment analysis. The method, called NET-GE (network-based gene enrichment analysis; Di Lena et
al., 2015; Bovo et al., 2016; Bovo et al., 2017), uses graph- and information- theoretic
measures to mine the STRING interactome and build functional modules starting from genes annotated with a shared functional term. The resulting modules are then used to address the problem of the functional association. The web server implementation (Bovo et al., 2016) provides annotations based on the Gene Ontology resource (Gene Ontology Consortium, 2015), the KEGG (Kanehisa et al., 2016) and Reactome (Fabregat et al., 2016) pathways. Moreover, it implements both a standard and a network-based gene enrichment analysis. One peculiarity of NET-GE is the possibility to enrich terms that are not present in the annotations of the starting gene set (and thus not detectable through a standard gene enrichment method). When tested on a OMIM-derived benchmark sets (disease related gene sets), NET-GE was able to enrich for biologically meaningful terms neglected by other methods (Di Lena et al., 2015, Bovo et al., 2017). To prove the ability of NET-GE in dissecting biological complexity, two study cases were investigated (Bovo et al., 2017). Moreover, NET-GE have been recently used in the development of eDGAR, a database collecting and organizing gene/disease associations (Babbi et al., 2017).
Given this brief introduction about NET-GE, in the first chapter I introduce some notions necessary to understand how NET-GE has been built and how it works, such as the concept of protein-protein interactions, their representation as network/graph and some concepts of graph theory. Then, I introduce the concept of gene annotation by reviewing some of the main
7
databases used in the field. Lastly, the concept of gene enrichment analysis and the main methodologies at the basis of it are presented. In the second chapter I introduce the methods at the basis of NET-GE, the third chapter describes the implementation of NET-GE as web-service, the fourth chapter discusses the benchmarking procedure and the obtained results, the fifth chapter presents some study cases and applications exploiting NET-GE, while in the sixth chapter I introduce eDGAR.
1.2 Protein-Protein Interaction: why is it so important?
Proteins are biological objects that rarely act alone. In fact, a protein is often modulated – in terms of its function and activity – by other proteins it interacts with (Phizicky et al., 1995). Commonly, protein-protein interactions (PPIs) are described as physical contacts among two (or more) proteins: intermolecular forces and steric complementarity among surface patches determine precise patterns of relationships. However, in some cases the term “protein interaction” encompasses also functional and logical interaction events, such as the ones resulting from genetic interactions (De Las et al., 2010). Examples of functional interaction are the presence of proteins in the same pathway (not necessarily involving the physical contact) and the transcriptional relationship, by which a protein (transcription factor) influences the expression of other genes. Different techniques have been devised to catch this type of interaction. Among them: (i) neighbourhood relationships, i.e. functionally related proteins organized very closely in the genomes and likely inherited together during evolution process), (ii) gene fusion events, i.e. single-domain containing proteins in a given genome are joined together in a multidomain protein in another genome), (iii) gene co-expression, i.e. similar pattern of expression between genes and (iv) phylogenetic profiles, i.e. the analysis of the patterns of co-occurrence of different groups of genes in different genomes.
To understand the role of each protein in the cell, PPI studies have become of fundamental importance (Safari-Alighiarloo et al., 2014) and the huge amount of interaction data collected over the years has made it possible to construct several “interactomes”, also named protein-protein interaction networks (PPINs). Moreover, thanks to the advent of HTS techniques (such as purification-mass spectrometry, cross-linking MS analysis, MS-based protein correlation profiling and yeast two-hybrid screens; a review of these techniques is presented in Mehta et al., 2016) interactomes are more and more complete and complex. In fact, HTS techniques can determine in a single shot a huge number of interaction events (both at the gene and at the protein level) leading to an increment of the amount of detectable physical and
8
functional links. However, not all the interactions events discovered by HTS techniques are truly physiological interactions, and their incorporation in an interactome often add a certain degree of noise to the PPIN (von Mering et al., 2002).
Despite the problem of having or not a complete and noiseless PPIN, interactomes proved a discrete success in solving biological problems. PPINs have been used to solve different tasks such as the prediction of protein function and the identification of functional modules (Nabieva et al., 2005, Sharan et al., 2007; Chen et al., 2009, Tripathi et al., 2016). Moreover, PPINs are playing a more and more fundamental role in systems biology and systems medicine in order to elucidate the biological events at the basis of the different phenotypes/diseases.
1.3 STRING as comprehensive PPI network
The Search Tool for the Retrieval of Interacting Genes, formerly named STRING, is a biological database of known and predicted PPIs (Szklarczyk et al., 2010). Established in the year 2000 (Snel et al., 2000), STRING aims at providing a critical assessment and integration of PPIs from different resources by including physical and functional associations.
STRING sources of PPI data can be subdivided in seven channels (type of evidence) (Szklarczyk et al., 2017):
1) the experiments channel, collecting interactions experimentally observed in laboratories (bio-chemical/physical and genetic experiments). Sources of PPI are primary databases organized in the IMEx consortium (Orchad et al., 2012) plus BioGRID (Breitkreutz et al., 2008);
2) the database channel, where PPI evidences are imported from manually curated pathways databases;
3) the text-mining channel, where an association score is given to each pair of proteins frequently mentioned together in the same paper, abstract or even sentence;
4) the co-expression channel, where an association score is given to each pair of proteins consistently similar in their expression patterns. Co-expression data are retrieved from gene expression experiments carried out by using microarray and/or RNAseq approaches;
5) the neighbourhood channel, where an association score is given to each pair of proteins when they are consistently observed in each other's genome neighbourhood;
9
6) the fusion channel, where an association score is given to each pair of proteins when there is at least one organism in which their respective orthologs have fused into a single, protein-coding gene;
7) the co-occurrence channel: where an association score is given to each pair of proteins when their orthologs tend to be observed as “present” or “absent” in the same subsets of phylogenetically related organisms.
The last version of STRING (v.10.5; May 14, 2017) counts 9,643,763 proteins and 1,380,838,440 different interactions, for a total of 2,031 organisms. For each interaction, by integrating the probabilities of the seven channels, STRING provides a combined confidence score (scaled between 0 and 1) representing the estimated likelihood that a given interaction is biologically meaningful, specific and reproducible, given the supporting evidences (Szklarczyk et al., 2017). Confidence limits are given by STRING as following: low confidence, 0.15; medium confidence, 0.4; high confidence, 0.7; highest confidence, 0.9. Usually, the combined score is used to (i) draw PPINs at different confidence levels and (ii) to implement a weighted graph where scores are used to operate on the network. This second usage of the combined score will be briefly discussed in the next sub-chapter.
1.4 Protein-Protein Interactions networks as graphs
A PPIN is usually represented by means of a graph, a mathematical structure used to model different problems. In this structure, nodes represent genes/proteins and edges their interactions.
A graph is usually defined as G = (V, E), where V is the set of vertices representing the nodes {V1, V2, V3, …, Vn} and E is a set of edges representing the links among the nodes. An
edge is defined as E = {(u, v) | u, v ∈ V}, where u and v are the connected vertices.
Graphs can be directed or undirected depending on whether an edge direction is provided or not, respectively. In a directed graph, an edge E = (u, v) is directed from u to v and it indicates that it is possible traverse the graph only from u to v and not vice versa (unless also the edge E = (v, u) is present).
Moreover, when edges (or nodes) are labelled with a score, the originated graph is defined “weighted”. Generally, a PPIN is an undirected and unweighted graph.
When considering all the different information stored in it, STRING can be treated as a weighted and directed graph. In fact, by incorporating functional events (e.g. activation,
10
repression) the graph acquires directionality, while the assignment of a confidence score to edges makes it weighted.
To better understand the next paragraphs, I introduce some definitions and proprieties of a graph. A path from a source u ∈ V to a target v ∈ V, or (u,v)-path for short, is an alternating sequence of vertices and edges u,(u, V1),V1,( V1,V2),V1,…,(Vk, v),v starting with u and ending
with v, such that the vertices before and after an edge are its tail and head, respectively (Brandes, 2008). A path never passes two times over the same edge or node. A graph is
connected if it is possible to find a path between the all pairs of vertices. The path length of an
(u, v)-path is the number of edges it contains, and the distance (Ulrik 2008). If the graph is connected, two vertices could be connected by different paths of different lengths.
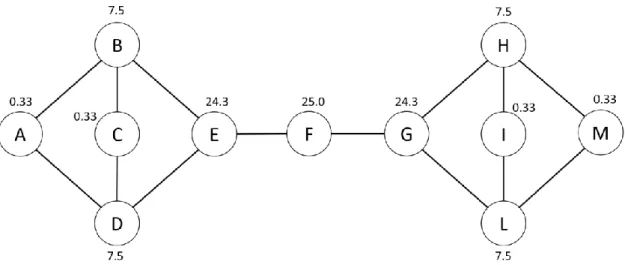
The shortest path between two vertices (Figure 1) is defined as the path which minimize the sum of the weights of its constituent edge (in an unweighted graph, the shortest path is the one with the lowest number of edges).
Figure 1. Shortest path between vertices A and F. Considering the proposed weighted directed graph, the shortest path minimizing the sum on the weights w is the ACEDF, with w = 22.
Figure 2. Betweenness centrality (BC) scores. Considering the proposed graph, the vertex F has the highest BC since it lies on all the shortest paths among the pairs of vertices.
11
To estimate the importance of a node for the connectivity (or the information flow) of a graph, different measures of node centrality have been developed. Among them, the betweenness centrality index measures the centrality of a node by considering the shortest paths (Figure 2). Given a node v of a graph G, its betweenness centrality is defined as:
𝐵𝐶(𝑣) = ∑ 𝜎𝑖𝑗(𝑣) 𝜎𝑖𝑗
(𝑖,𝑗)∊𝑉 (1)
where, for nodes i, j, v ∈ V, with i ≠ j ≠ v, σij is the number of shortest paths from node i to
node j, and σij(v) is the number of shortest paths that pass through v. The measure is usually
interpreted as the degree to which a vertex has control over pairwise connections between other vertices, based on the assumption that the importance of connections is equally divided among all shortest paths for each pair (Ulrik, 2008).
Many other graph-theoretic measures can be computed/extracted when studying a PPIN. Even though we discussed only those that are used in the development of NET-GE, it is clear that the study of a PPIN from a graph-theoretic point of view is necessary to elucidate the biological complexity at the basis of the phenomena under investigation.
1.5 Gene/protein annotation and related databases
Gene annotation databases are commonly used to evaluate the functional properties of genes. Annotating genes/proteins means endow sequences with specific biological features (i.e. the different protein domains, the different functions, biological processes and pathways in which the genes/proteins are involved). However, because experimental investigation is costly and time-consuming, only a small part of protein functions has been experimentally determined. To overcome this problem, many computational methods aimed at predicting protein function have been developed. These methods rely essentially on the expansion of the relatively small number of experimentally determined functions to large collections of proteins (Valencia, 2005) by means of some measure of similarity.
Several databases have been developed to classify genes according their roles in the cell. Among them, KEGG (Kanehisa et al., 2016) and Reactome (Fabregat et al., 2016) collect genes/proteins as well as metabolites, in maps representing the different biochemical pathways. The Gene Ontology (Gene Ontology Consortium, 2015) is a database mainly used to annotate genes with biological processes, functions and the cellular locations. However, differently from the KEGG and the Reactome databases – in which annotation is manually
12
curated – GO terms can be electronically assigned to a gene/protein. Moreover, alongside the difference in content, these databases vary in size.
In the following subchapter, I briefly introduce the KEGG, REACTOME and GO resources.
1.5.1 KEGG
KEGG (Kyoto Encyclopedia of Genes and Genomes) is a database for the systematic analysis of gene functions. The database consists of 15 main manually curated databases which are categorized into systems, genomic, chemical and health information (Kanehisa et
al., 2015, Kanehisa et al., 2016). Due to its comprehensiveness, it makes one of the most
attractive databases used in the annotation of gene/protein functions as well as small molecules. Among them, KEGG PATHWAY collects manually drawn pathway maps representing the links among genomic information and higher order functional information. Pathway maps are drawn to represent the dual aspect of the metabolism: the genomic network of how genome-encoded enzymes are connected to catalyse biochemical reactions and the chemical network of how compounds are transformed by means of those enzymes (Kanehisa, 2013). Alongside the canonical biochemical pathways representing the metabolism, KEGG provides maps depicting the processing of genetic and environmental information, cellular processes, and the molecular pathways involved in human diseases. Moreover, KEGG BRITE provides then a functional hierarchy of the KEGG objects.
The last release of KEGG (v.84.0, Dec. 2017) annotate a total of 7,314 human genes in 323 pathways (considering only the lowest level of the hierarchy). It is evident that about the 2/3 of the human genome lacks a KEGG functional annotation.
1.5.2 Reactome
Reactome (Fabregat et al., 2016) is a manually curated database of pathways and processes. It describes biological pathways as chemical reactions that closely mirror the physical interactions occurring in the cell. Reactome provides information about proteins and small molecules and how they participate in pathways to coordinate cellular events. Reactions are grouped into pathways, which in turn are assembled into a hierarchy of biological events. (Croft et al., 2011; Milacic et al., 2012). Like KEGG maps, the REACTOME ones describe canonical biochemical pathways, cellular processes, and the molecular pathways involved in diseases. However, REACTOME differs in the number of maps and in hierarchical structure:
13
REACTOME confines genes in specific “modules” of more general biochemical pathways. The last version of REACTOME (v.62, Sept. 2017) annotate a total of 10,712 genes in 2,176 pathways. By using REACTOME, it is possible to annotate about half of the human genome.
1.5.3 Gene Ontology
The Gene Ontology (GO; Gene Ontology Consortium 2015) is a controlled vocabulary of functional terms subdivided into three main categories: i) molecular function (MF); ii) cellular component (CC) and biological process (BP). Biological process terms describe biological events (e.g. negative regulation of apoptotic process) accomplished by one or more organized assemblies of molecular functions. Molecular function terms describe activities that occur at the molecular level (e.g. protein kinase binding) and the cellular component terms describe a component of a cell such as an anatomical structure (e.g. cytoplasm) or a gene product group (e.g. ribosome). The last version of the GO resource (Amigo 1.8) annotates more than 90% of human genes with 54,440 biological functions (17,788 GO:BP, 17,734 GO:MF and 18,918 GO:CC). It is evident that this resource functionally annotates the greatest part of the human genome. However, it is worth to note that out of the 442,065 associations, only about the 40% of associations has been experimentally derived.
1.5.4 Hierarchical representation of functional annotations
The three databases (GO, KEGG, Reactome) are structured in a hierarchic way, where parent–child relationships are defined. A parent terms represents a more general concept than its children terms. In the case of KEGG, term-term relationships are represented as a simple tree, while the Reactome and GO databases originate a directed acyclic graph (DAG).
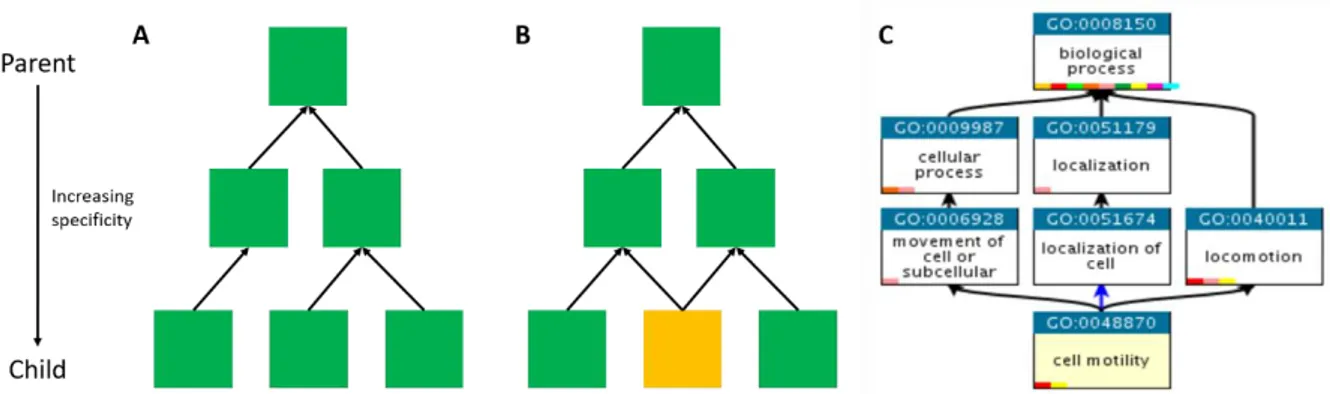
In a DAG, a term can have multiple parents and it is not possible to have a path in graph that starting from a term points back to the same term. An example of a simple tree and DAG is given in Figure 3.
14
Figure 3. Simple trees and directed acyclic graphs. Both structures are directed graphs in which boxes represent nodes (functional terms) and arrows represent edges. A) An example of a simple tree, in which each child has only one parent. Based on the BRITE hierarchy, KEGG pathways are structured as a simple tree. B) A directed acyclic graph (DAG) in which each child can have one or more parents. The node with multiple parents is highlighted in yellow. Like a simple tree, a DAG has directed edges and does not have cycles (a path cannot start and end at the same node). Reactome and GO terms are structured as a DAG. C) An example of a functional term of the GO:BP branch and its parent-child relationships.
1.6 Quantifying the function specificity and similarity.
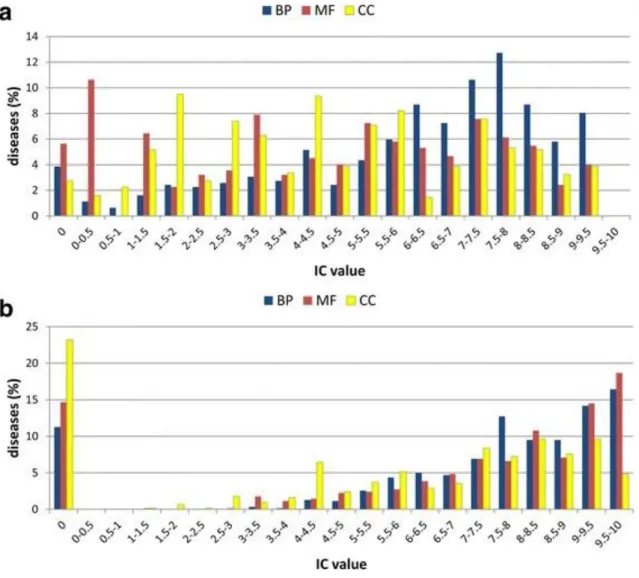
How is it possible to understand if a protein function is quite specific or general? When a gene is annotated with a functional term, the associations between the gene and the terms’ parents are implicitly inferred (Rhee et al., 2008). Based on these term-term relationships, a way to describe the function specificity of a given term as function of the annotation hierarchy, is to use the number of nodes in the shortest path connecting the term to its root. However, even if the level in the hierarchy is often assumed to be indicative of the terms specificity, this is not completely true. To overcome this problem other measures have been introduced. Among them, the Information Content (IC) score provides an alternate measure of functional specificity (Louie et al., 2010). The IC of a given term v is computed as follows:
𝐼𝐶(𝑣) = −𝑙𝑜𝑔2(𝑝(𝑣)) (2)
where p(v) is the relative frequency of occurrence of the term v in the gene/protein dataset under consideration. Terms that occur less frequently have higher IC and are assumed to be re specific.
Alongside the function specificity concept, there is the functional similarity one. A gene function can be annotated with different terms, but are these terms similar or different? An
15
accurate measure of semantic similarity of terms is critical for an accurate measurement of gene functional similarities (Song et al., 2014). Several approaches have been proposed in the last decades for measuring functional similarity. The most common measures used are the Resnik's (Resnik, 1995) and Lin's (Lin, 1998), which are measures relying on the IC score. Resnik’s measures similarity between two terms as simply the IC of their most informative common ancestor (MICA), while Lin’s considers how distant the terms are from their common ancestor. In this way, the Lin’s relate the IC of the MICA to the IC of the terms being compared as following:
𝑠𝑖𝑚𝐿𝑖𝑛(𝑣𝑖, 𝑣𝑗) = 2×𝐼𝐶 (𝑣𝑀𝐼𝐶𝐴)
𝐼𝐶(𝑣𝑖)+𝐼𝐶(𝑣𝑗) (3)
where IC(vi), IC(vj) and IC(vMICA) are the information contents of the two terms and their
common ancestor, respectively.
1.7 Gene Enrichment Analysis
Omics techniques identify lists of “interesting” genes/proteins characterizing the investigated phenotype. However, given this data, how can we understand the biology at the basis of the phenotype? How is it possible to reconcile genes/proteins with known and putatively shared functional information? Dealing with the interpretation of these gene/protein sets, gene enrichment analysis (also called pathway analysis) has become the most widely used approaches for functional associations, thanks to its ability to provide valuable insights into the biological events underlying a gene/protein set (Tipney et al., 2010).
1.7.1 Gene enrichment analysis: how does it works?
The principal foundation of enrichment analysis is that if a biological event is abnormal in a given study, the co-functioning genes/protein should have a higher (enriched) potential of being selected as a relevant group by the omic technologies (Huang et al., 2009a).
Enrichment analysis is generally performed by mapping genes/proteins to their associated biological annotations (e.g. processes, functions, pathways), comparing the distribution of the target gene set (investigated gen set) against the background distribution of these terms (i.e. the annotated genes) (Tipney et al., 2010). In doing this, enrichment is quantitatively measured by applying different statistical methods, such as the hypergeometric distribution or
16
its analogous one-sided Fisher's exact test (Huang et al., 2009a). Given a number of genes N, with F of these genes associated with a particular functional term and T of these genes in the target set, then the probability that b or more genes from the target set are associated with the functional term is given by the hypergeometric tail:
𝑃𝑟𝑜𝑏(𝑋 ≥ 𝑏) = ∑ ( 𝑇 𝑖)( 𝑁−𝑇 𝐹−𝑖) (𝑁 𝐹) min (𝑇,𝐹) 𝑖=𝑏 (4)
To each term, the Bonferroni or Benjamini-Hotchberg (FDR) procedure is then used to counteract the problem of multiple comparisons (Noble, 2009).
1.7.2 Classification of gene enrichment methods
Given a list of genes, which tool for functional association should be used? Are all the methods comparable? Dealing with the problem of functional association, several gene enrichment analysis tools have been developed over the years. Based on the algorithms on which they rely, they can be divided into three main classes (Huang et al., 2009a): (i) singular enrichment analysis (SEA), (ii) gene set enrichment analysis (GSEA) and (iii) modular enrichment analysis (MEA).
Singular enrichment analysis – Commonly referred as “gene enrichment analisys” or as
“Over-Representation Analysis” (ORA), SEA is the most traditional strategy for gene enrichment analysis. Examples of tools implementing the ORA strategy are DAVID (Huang
et al., 2009a; Huang et al., 2009b) and GoRILLA (Eden et al., 2009). They are based on
statistics like the hypergeometric distribution or its analogous one-sided Fisher's exact test. SEA methods simply assess the over-representation of biological annotations in a pre-selected “candidate” gene list, resulting very efficient in extracting meaningful biological features. However, as drawback SEA methods tend to generate a very large list of enriched terms. Moreover, results are highly impacted by the procedures/methods used to extract the candidate gene (Huang et al., 2009a; Irizarry et al., 2011).
Gene set enrichment analysis - GSEA methods were introduced having in mind the following:
is it possible to overcome the limits of using pre-selected “candidate” genes? This powerful approach allows to weight the importance of genes ranking them by some statistics (e.g. the
17
fold change of differentially expressed genes), by extending the analysis also to those genes not included in the “candidate” set, but marginally contributing to the biology of the phenotype. Thus, GSEA methods result very suitable in the analysis of microarray or RNAseq data, by allowing gene that cannot pass a hypothetical selection threshold (e.g. differential expressed genes with p-value > 0.05) to contribute to the enrichment analysis (Huang et al., 2009a). Differently from ORA methods, GSEA approaches rely on different statistics.
Among the GSEA strategies, GSEA (Subramanian et al., 2005) was the first method to be developed. It is based on a Kolmogorov–Smirnov-like statistic. GSEA computes an enrichment score (ES) that reflects the degree to which a set of genes sharing an annotation term is overrepresented at the extremes (top or bottom) of the whole ranked list of genes. Subsequently, to estimate the statistical significance of the ES, a permutation test is applied. The underlying assumption is that the genes ranked in higher positions, and driving the enrichment procedure, are likely the most contributors to the biology of the phenomena. However, this is not always true since in real biology a small change of some signal transduction genes can result in a larger downstream biological impact.
Modular enrichment analysis - MEA is the only class that takes advantage from the
relationships existing between annotation terms when performing enrichment calculations, i.e. using composite annotation terms (join terms). The use of composite annotation terms may therefore be able to provide biological insight lacking in analyses that treat single terms as independent objects (Huang et al., 2009a). In this class we have tool like Ontologizer (Grossmann et al., 2007) and topGO (Alexa et al., 2006).
1.7.3 From standard to network-based gene enrichment
Is it possible to improve methods for functional association? If yes, how? One of the major improvements made in the field of functional association has been the exploiting of information contained in biological networks. Standard methods treat genes/proteins as isolated objects, completely neglecting the functional/physical links among them. However, the analysis of gene sets in the context of their interactions could provide new valuable biological insights (Di Lena et al., 2015). Taking the advantage from this kind of information, a new class of tools, denoted as network-based enrichment analysis tools, has emerged. Based on the strategies and algorithms used to perform enrichment, this new class can be broadly classified into two sub-classes (Di Lena et al., 2015):
18
A) methods that use the topology of a PPIN to infer how much similar distinct sets of gene/proteins are (e.g. SPIA (Tarca et al., 2009), SEPEA (Thomas et al., 2009), PWEA (Hung et al., 2010), TopoGSA (Glaab et sl., 2010), EnrichNET (Glaab et al., 2012), SANTA (Cornish et al., 2014), JEPETTO (Winterhalter et al., 2014) and TPEA (Yang et al., 2017));
B) methods that identify functionally-related modules in a PPIN and then infer protein/gene biological roles from such modules (e.g. PINA (Wu et al., 2009; Cowley
et al., 2012), FunMod (Natale et al., 2014), MetaCORE (Bessarabova et al., 2012)).
In both classes, graph-theoretic measures and graph properties (such as shortest paths, degree, etc.) are used to extract meaningful information from an interactome. Among the publicly available tools, EnrichNet and PINA are the two most cited methods, representative of the A and B classes above, respectively. To give an idea of this new category, we briefly discuss the strategies at the basis of PINA and EnrichNet.
PINA (Protein Interaction Network Analysis) is a web resource developed by the integration of PPIs data from six different databases (IntAct (Kerrien et al., 2006), MINT (Chatr-aryamontri et al., 2007), BioGRID (Breitkreutz et al., 2008), DIP (Salwinski et al., 2004), HPRD (Peri et al., 2003) and MIPS MPact (Güldener et al., 2006)). The core of PINA consists in the identification of functional modules (clusters of densely interconnected nodes) which are likely to represent sets of functionally related proteins. After the module construction, modules are annotated by looking for enriched term coming from four databases (KEGG (Kanehisa et al., 2016), GO (Gene Ontology Consortium, 2015), PFAM (Finn et al., 2016a) and MSigDB (Liberzon et al., 2011)). Given an input set of genes/proteins, it is mapped on the pre-computed modules and the over-represented modules are identified by means of a hypergeometric test. As result, the input gene set is characterized by the significantly enriched annotations of the over-represented modules (Wu et al., 2009; Cowley
et al., 2012).
EnrichNet is a web application based on PPIN integrating different information: molecular interactions (STRING, Szklarczyk et al., 2017), cellular pathways (KEGG (Kanehisa et al., 2016), BioCarta (http://www.biocarta.com), WikiPathways (Kutmon et al., 2016), REACTOME (Fabregat et al., 2016), PID (Schaefer et al., 2009)), biological annotations (GO (Gene Ontology Consortium, 2015), InterPro (Finn et al., 2016b)) and tissue-specific gene expression data. The enrichment procedure at the basis of EnrichNET consists of two steps (Glaab et al., 2012): 1) the target genes are mapped on reference datasets in the network meanwhile scoring their distance using a random walk with restart procedure, and 2) the
19
significance of the distance scores is assessed by using a background model. Significantly annotations are then retained.
2 NET-GE
NET-GE is a novel method for network-based gene enrichment analysis (Di Lena et al., 2015; Bovo et al., 2016; Bovo et al., 2017). Considering the different methods described in the previous chapter, like the methods of the class B (e.g. PINA), NET-GE is based on a pre-processing phase aimed at extracting modules from a PPIN. However, differently from all the other methods, the modules built by NET-GE are function-specific by construction, since each one is construct starting with genes/proteins sharing a specific biological annotation (seed set).
By using graph- and information- theoretic measures, NET-GE builds functional modules by expanding each seed set into a compact and connected subgraph of a PPIN (Di Lena et al., 2015; Bovo et al., 2017). The resulting modules are then used to address the problem of the functional association.
Over-representation analysis is performed by mapping the input gene/protein set on each module, determining through a Fisher’s exact test whether there are significant overlaps among the input gene/protein set and the modules. To facilitate the use of NET-GE, a web-application have been released at http://net-ge.biocomp.unibo.it/enrich (Bovo et al., 2017).
The following chapters will introduce the databases, the algorithm and the datasets used to build and test NET-GE. The full articles Bovo et al., 2016; Bovo et al., 2017; and Babbi et
al., 2017 are reported in the appendix of the thesis.
2.1 Databases
NET-GE relies on the STRING Human Interactome (release 10; http://version10.string-db.org/). After its download, STRING was processed by retaining all the links (with the exclusion of self-loops) with a documented action, irrespectively of the STRING combined score and of the supporting evidence. The resulting network comprised 15,632 nodes and 307,413 links. Modules were also built by using a filtered version of STRING, here named STRING0.9, in which only the links with a STRING combined score ≥ 0.9 were retained. The filtered version comprised 9,422 nodes and 80,112 links. Annotation sets were retrieved from
20
the Gene Ontology resource (UniProt-GOA human 145 web resource; https://www.ebi.ac.uk/GOA), the KEGG (release 77; http://www.kegg.jp/) and Reactome (release 53; https://reactome.org/) databases.
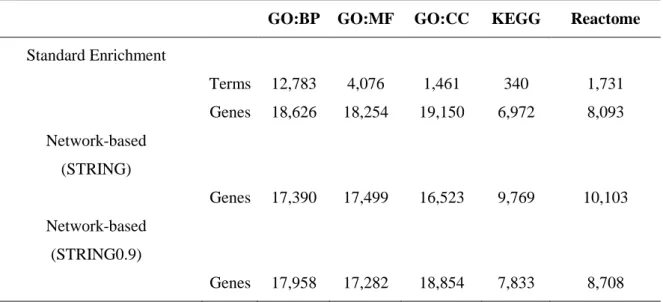
Genes were associated to each annotation term by means of the UniProtKB accession numbers. Given the hierarchical structure of the annotation features, associations were propagated till the root. The resulting seed sets were then expanded as will be described in the next paragraphs. Statistics about annotation sets are reported in Table 1.
Table 1. NET-GE statistics. Number of annotations and genes are presented.
GO:BP GO:MF GO:CC KEGG Reactome
Standard Enrichment Terms 12,783 4,076 1,461 340 1,731 Genes 18,626 18,254 19,150 6,972 8,093 Network-based (STRING) Genes 17,390 17,499 16,523 9,769 10,103 Network-based (STRING0.9) Genes 17,958 17,282 18,854 7,833 8,708
2.2 Module extraction
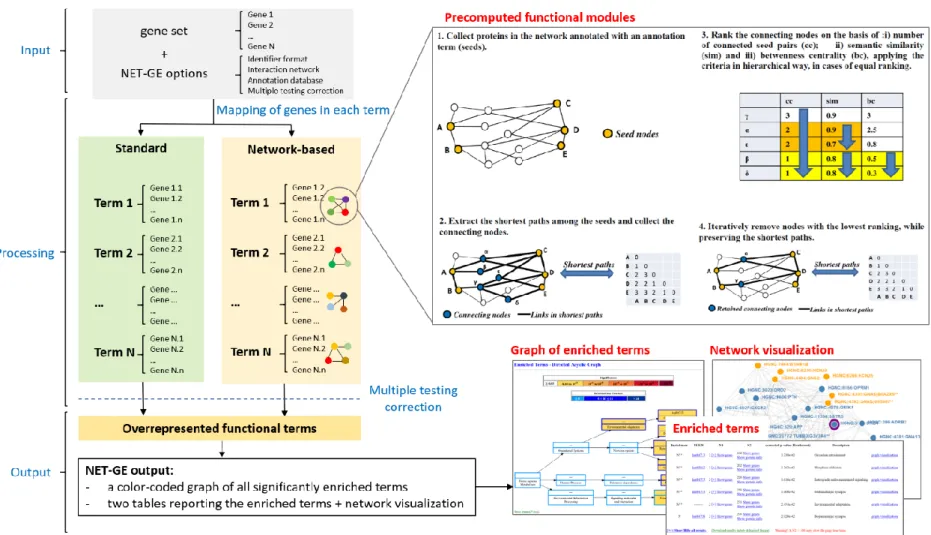
The module extraction procedure, aimed at extracting connected and compact subgraphs of the STRING interactome, consisted of four major steps (Figure 4). Briefly:
1) all the proteins of the network sharing a specific annotation term were collected into a seed set;
2) each seed set was expanded into a function-specific module by computing the shortest paths among each pair of seed nodes;
3) nodes connecting the seed set were collected and ranked by using graph-theoretic and information-theoretic measures;
4) the module was minimized by filtering out the less informative connecting nodes while preserving the shortest paths.
21 5)
6)
22
The ranking step, and the subsequent minimization, are steps aimed at simplifying the sub-network topology by highlighting its main structure. In fact, through the generation of the complete set of shortest paths (step 2), a very large module can be produced, leading to the risk of including nodes that are not representative of the annotation term under expansion.
To overcome this problem, a graph filtering procedure was applied to generate a minimal connecting network (MCN). The graph filtering procedure here applied (step 4) relied on some metrics (step 3) ensuring that the minimized network, when compared against the original one, preserves the number of shortest paths connecting the seed pairs. Details of the steps 2-4 are given as following.
Shortest-path extraction – Given a seed set and the STRING interactome, the all-pairs
shortest path algorithm was applied by treating STRING as an undirected and unweighted graph. Self-loops were discarded from the graph and seed proteins not appearing into STRING were kept as isolated nodes in the minimal network.
Ranking procedure – Nodes connecting the seed proteins were ranked on the basis of
three measures: 1) seed centrality, 2) semantic similarity with the reference annotation term and 3) betweenness centrality.
These measures were used as primary, secondary and tertiary sort key, respectively. The seed centrality score was adopted as measure of importance of a node. For each node it was computed by counting the number of distinct seed pairs connected by it. In this way, a higher score reflects the probability that such node appears in a subgraph. The semantic similarity score, here defined as the Lin’s measure, was used to measure the degree of relationship between the annotation terms and the reference annotation term of each connecting node. We defined the maximum semantic similarity of a connecting node with respect to the reference GO term as the highest Lin's score between the GO terms associated to the connecting node and the reference GO term. The betweenness centrality score measured the importance (centrality) of a node in the networks. Here, this measure was computed by considering the sub-network under analysis. Betweenness centrality was here used to assess the ranking of those connecting nodes presenting the same ranking with respect to the other two scores.
23
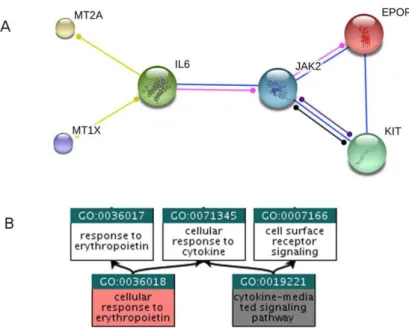
Figure 5. Minimal connecting network for GO:0036018. A) Minimal connecting network extracted from STRING 9.2 (http://www.string-db.org) build for the Biological Process term GO:003601 (cellular response to erythropoietin). The seed genes, directly annotated with GO:0036018, are HGNC:MT2A, HGNC:KIT, HGNC:EPOR and HGNC:MT1X. The connecting genes HGNC:JAK2 and HGNC:IL6, recovered by the minimization procedure, are associated to GO:0019221 (cytokine-mediated signalling pathway). B) Relationships between the reference GO term (GO:0036018) and the GO associated to the connecting genes (GO:0019221). Figure extracted from Di Lena et al., 2015.
Module minimization – Modules were minimized by using the measures above reported.
For each module, connecting nodes were ranked from the most to the less informative, and, starting from the last one, they were iteratively removed while preserving the shortest path. One example of minimal connecting network is provided in Figure 5.
2.3 Enrichment procedure
NET-GE implements both a standard and a network-based gene enrichment procedure. Entering with a gene/protein set, each gene/protein is mapped into the modules of a selected annotation database. Over-representation is tested through the Fisher's exact test. However, while the standard gene enrichment includes only annotations of the seed nodes, the network-based one includes, for each module, the seeds and their connecting nodes. Multiple testing correction is then applied by using either the Bonferroni or the Benjamini-Hochberg (FDR) procedure (Noble, 2009).
24
3 NET-GE web server
NET-GE have been released as web-application. The front-end of the web server follows the Model-View-Controller (MVC) paradigm thanks to the web2py framework (http://www.web2py.com/). After submitting the query, the server displays a book-markable page reporting the status of the job. This page is periodically updated and, at the end of the gene enrichment procedure, a link to the results is provided.
The final visualization of the results exploits the Graphviz library (http://www.graphviz.org/) for laying out the acyclic directed graphs for both Gene Ontology, KEGG and REACTOME. Enriched terms are then highlighted. In addition, the web server shows dynamic network renderings, based on the JavaScript library d3.js (http://d3js.org/), for the visualization of the underlying interaction networks involving a specific term. The user can also provide an e-mail address used to e-mail he/she as soon as results are ready.
For multiple submissions, each request is queued and runs as soon as there is available computing power. Running time depends on size of the input set and on the number of functionally related terms.
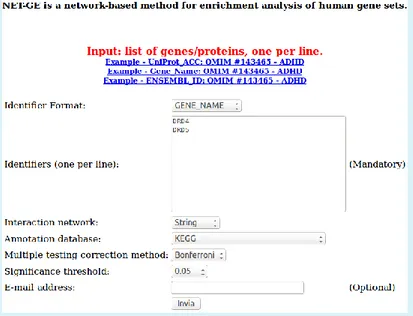
Figure 6. NET-GE web interface. To use the NET-GE web interface, the user is required to perform the following steps: i) choose an identifier format; ii) copy and paste a list of gene/protein identifiers; iii) choose a STRING network; iv) chose the annotation database and v) choose the multiple testing correction procedure and a cut-off. Optionally, the user can enter the e-mail address in order to be notified as soon as results are ready.
25
3.1 NET-GE web server: input
NET-GE web interface (Figure 6) accepts UniProtKB Accession Numbers, Ensembl genes and HGNC gene names. The end user can select: 1) annotation modules based on STRING or STRING0.9; 2) the annotation database (GO terms, KEGG, Reactome); 3) the multiple testing correction method (either the Bonferroni or the FDR based correction) and 4) the significance threshold.
3.2 NET-GE web server: output
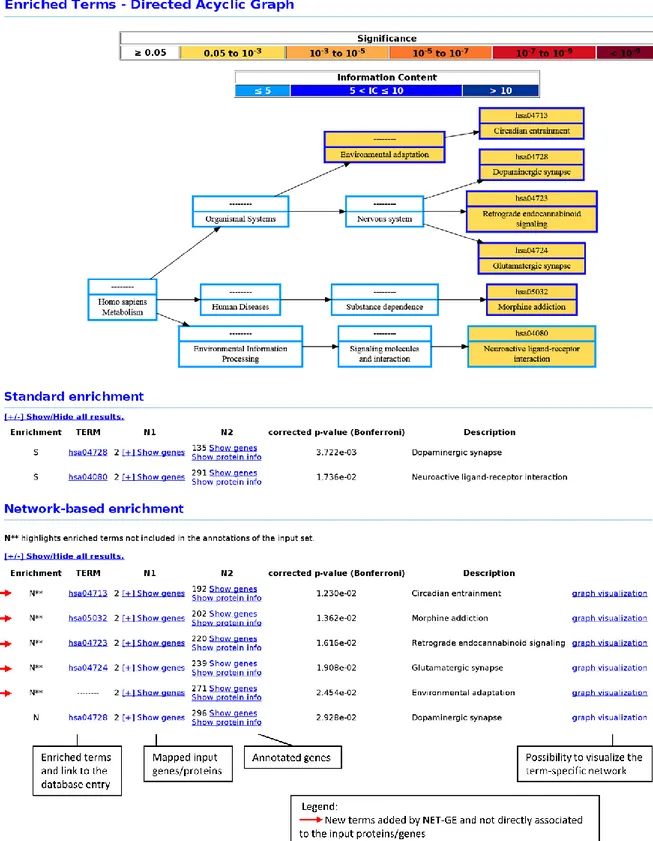
The output page reports two tables, one for the standard procedure and another for the network-based one. Both tables list the significantly enriched terms ranked by their adjusted p-value. Each table comprises seven fields: i) the procedure used to enrich the term i.e. standard or network-based enrichment (S and N, respectively), ii) the identifier of the term, linked to the corresponding database, iii) the number and the list of input genes associated to the term, iv) the number and the list of the genes (seeds and/or connecting) annotated with the term, v) the p-value of the association (Bonferroni- or Benjamini-Hochberg- corrected), vi) the name of the term and vii) the term-specific network (only for the network-based enrichment). In the network-based enrichment mode, new terms are highlighted with the symbol N** (Figure 7).
By default, the two tables display five significant enriched terms; it is however possible to expand the list of results and visualize all the enriched terms by clicking on the ‘Show/Hide all results’ button. Results can be downloaded as tab delimited plain text by clicking on the “Download results in tab-delimited format” button.
Moreover, the result page reports a graphical representation of the enriched terms in the context of their relationships (DAG; Figure 7).
26
Figure 7. Example of NET-GE output. Results of the ADHD study case (see chapter 5) are here presented as example of the NET-GE analysis over the KEGG database. Results of the standard gene enrichment and of the network-based one are reported in two separated tables. Enriched terms are graphically presented using the DAG structure. The colour code of the box reflects both the degree of enrichment and the information content of the term. Figure extracted from Bovo et al., 2017.
27
3.3 Graphical representation of the enriched terms
The nodes in the DAG are color-coded according to the significance of the enrichment and to the information content. The graph can be downloaded as image by clicking the “Save image (*.svg)” button. Whenever a term is enriched by the network-based procedure, the term-specific network can be explored by clicking on the “graph visualization” button. Nodes (proteins) in the network are color-coded highlighting seed, connecting and input proteins (Figure 8). The term-specific network can be also downloaded as plain text files, where nodes and arcs information are provided.
Figure 8. NET-GE module exploration. The graph of the two input proteins (ADHD study case; see chapter 5) and their first neighbours for the new enriched module GO:0014052 (regulation of secretion). Seed and connecting genes are highlighted in orange and blue, respectively. Nodes with a purple border identify the submitted IDs. Being a new enriched term, the two genes enter the module as connecting nodes.
4 Benchmarking the method: a quantitative approach.
NET-GE was benchmarked by using sets of genes involved in mendelian diseases as retrieved from the Online Mendelian Inheritance in Man (OMIM; Hamosh et al., 2005) resource. The dataset comprised 244 OMIM-related gene sets, with a number of protein associated to each disease ranging from 2 to 29, and an average number equal to 4. This dataset was analysed by using both the standard (S) and the network-based (N) methods. Annotation terms with a p-value < 0.05, Bonferroni corrected, were considered over-represented. Both the STRING and STRING0.9 implementations were tested for each
28
annotation database (GO terms, KEGG and REACTOME pathways), separately. For each OMIM disease we counted:
a) the number of terms enriched by the standard method;
b) the number of terms enriched by the network (new terms excluded);
c) the number of new terms (terms enriched only by the network -based approach and not present in the annotation sets of the input genes/proteins).
While evaluating the network-based approach, we focused only on terms that were not enriched by the standard method, filtering out also all the terms that were ancestors of terms enriched by the standard method.
Considering the three categories above reported, out of the 244 OMIM sets we computed: a) the number if diseases for which neither the network-based nor the standard method
retrieved significantly overrepresented terms (set “n.a.”);
b) the number of diseases for which the standard method retrieved more terms compared to the network-based method (set “S>N”);
c) the number of diseases for which both the methods retrieved an equal number of terms (S=N);
d) the number of diseases for which the network-based procedure enriched more terms compared to the standard method (set “N>S”);
e) the number of diseases for which the network-based procedure added term not included in the annotations of the input set (set “New Terms”).
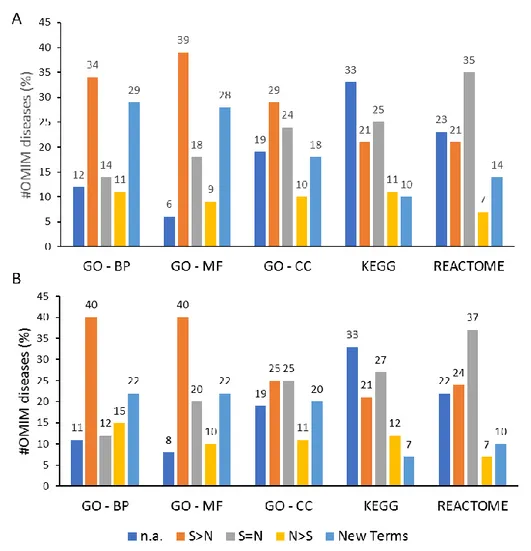
For each annotation database, results are presented in Figure 9, panels A and B for STRING and STRING0.9, respectively. STRING based analyses were characterized by more than 50% of OMIM diseases presenting over-represented terms, considering also the new terms and the terms present equally or in a greater number than the one enriched only by the standard method. By using STRING0.9 similar results were retrieved.
29
Figure 9. NET-GE benchmark results: A) STRING based and B) STRING0.9 based. The bar plot presents, for each annotation database, the percentage of diseases (out of the 244 tested) for which: neither the network-based nor the standard method retrieved significantly overrepresented terms (“n.a.”, blue), the standard method retrieved more terms compared to the network-based one (“S>N”; orange), both the methods retrieved the same number of terms (“S=N”; grey), the network-based approach enriched more terms compared to the standard method (“N>S”; yellow) and finally, the network-based approach added term not included in the annotations of the input set (“New Terms”; light blue).
5 Study cases: a qualitative evaluation of NET-GE.
NET-GE was evaluated by testing two gene sets related to 1) the Attention Deficit Hyperactivity Disorder (ADHD) and 2) the Obsessive-Compulsive Disorder (OCD). While the ADHD represented a hypothetical study case – because genes were retrieved from the OMIM database – the OCD study case represented a real study case because the investigated gene set resulted from the analyses of sequencing data.
30
5.1 The ADHD study case
ADHD is the most common neuro-behavioural problems afflicting children between 6 and 17 years of age (Sharma et al., 2014). ADHD is considered a chronic neurobehavioral disorder characterized by developmentally inappropriate levels of hyperactivity, impulsivity and inattention (Sharma et al., 2014; Tarver et al., 2014). In the last decade, several studies have supported a strong genetic contribution for ADHD. A review about the genetic of ADHD have been recently published by Bonvicini et al., 2016.
We tested NET-GE considering the ADHD-related genes reported in OMIM (OMIM #143465): the dopamine receptors DRD4 (UniProtKB AC: P21917) and DRD5 (UniProtKB AC: P21918). Enrichment analyses were carried out setting the significance threshold at 0.05 on the Bonferroni corrected p-values. For sake of clarity, we report only the most informative terms, neglecting all the parent terms of the hierarchy. Analyses ran over the GO:BP and KEGG databases.
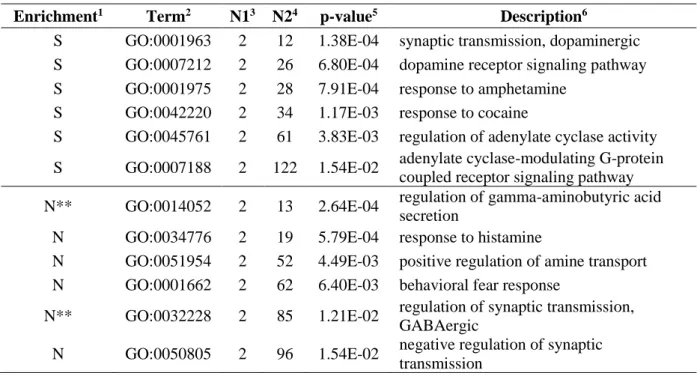
Focusing on the GO:BP branch, terms enriched by NET-GE are listed in Table 2. The standard enrichment statistically over-represented processes strictly related to the disease, such us the involvement of psychiatric functions (cognition, learning), the response to some chemical compounds (amphetamine, cocaine, alkaloids, ammonium ion) and the involvement of the dopaminergic pathway (including the intracellular signal transduction/second messenger pathways of cAMP). As reported in Table 2, the network-based approach added terms related to behavioural characters (such as the response to fear) or to the response to other chemical compounds (histamine). Interestingly, the network-based procedure added new terms (not associated to the input protein), unexpectedly involved in ADHD, such as the GABAergic pathway, process experimentally involved in the development of the disorder (Edden et al., 2012).
The standard enrichment over the KEGG database highlighted the involvement of the dopaminergic synapses and the neuroactive ligand-receptor interactions (Table 3). The network-based procedure added new terms related to the response to morphine (addiction), the involvement of the glutamatergic synapses, the pathway of retrograde endocannabinoid, and the circadian rhythm system (Table 3).
All these processes, although non-characterizing the input proteins, have been previously described in literature as being ADHD-related (Maltezos et al., 2014; Centonze et al., 2009; Gamble et al., 2013; Zhu et al., 2008).