UNIVERSITA’ DEGLI STUDI DELLA TUSCIA
DI VITERBO
DIPARTIMENTO DI AGROBIOLOGIA E AGROCHIMICA
CORSO DI DOTTORATO DI RICERCA IN
“GENETICA E BIOLOGIA CELLULARE”
XXIII CICLO
Role of Lamin A/C in neuroblastoma
differentiation: therapeutic implications
BIO/11
Coordinatore: Prof. Giorgio PRANTERA
Tutors: Dr. Igea D‟AGNANO
Dr. Armando FELSANI
Dottorando:
INDEX
ABSTRACT ... 1
1 INTRODUCTION ... 3
1.1 NEUROBLASTOMA ... 3
1.1.1 Neuroblastoma as a sympathetic nervous system-derived tumor ... 4
1.1.2 Neuroblastoma cell lines as “in vitro” differentiation model ... 7
1.1.3 Retinoids-induced neuroblastoma cell differentiation ... 9
1.2 NUCLEUS AND NUCLEAR LAMINA ... 10
1.2.1 Lamins ... 11
1.2.2 Lamins during development and differentiation processes ... 14
1.2.3 Lamins and regulation of the cellular mechanical properties ... 16
1.2.4 Role of lamins in chromatin organization and gene expression ... 17
1.2.5 Role of lamins in DNA replication and cell proliferation ... 18
1.2.6 Laminopathies ... 19
1.2.7 Lamins and cancer ... 22
2 AIMS ... 23
3 MATERIALS AND METHODS ... 24
3.1 Cell lines maintenance, differentiation and treatments ... 24
3.2 Generation of recombinant viruses and lentiviral infection of cells ... 24
3.3 Western Blot analysis ... 26
3.4 Immunofluorescence microscopy ... 26
3.5 Total RNA preparation ... 26
3.6 Real‐time RT‐PCR analysis ... 27
3.7 Whole genome expression profiling... 27
3.8 Plating Efficiency Assay ... 30
3.9 In vitro Cell Migration Assay ... 30
3.10 Zymography of Gelatinolytic Activity ... 30
3.11 P-Glycoprotein immunostaining ... 31
4 RESULTS ... 32
4.1 Silencing of LMNA gene inhibits RA-induced differentiation in SHSY5Y cell line ... 32
4.2 Gene expression profiling of SHSY5Y CTR and miRL cells reveals an impairment of differentiation ... 35
4.3 The impairment of cell differentiation in LMNA silenced SHSY5Y cells is associated with increased tumor progression ... 38
4.4 Low levels of Lamin A/C expression are associated with increased resistance to chemotherapeutic agents ... 41
5 DISCUSSION ... 43
6 BIBLIOGRAPHY ... 46
1
ABSTRACT
Neuroblastoma is one of the most aggressive solid tumors in childhood. The degree of its differentiation can influence patient outcome since high differentiated tumors have been correlated to favourable prognosis. Most neuroblastoma cells maintain the ability to differentiate in vitro in the presence of various agents, rendering them a good model to study the differentiation potential of these tumors.
Nuclear lamins are type V intermediate-filament proteins that form a scaffoldlike meshwork underlying the inner nuclear membrane and have many different and not completely known functions. Among lamins, the A-type ones are expressed in differentiated tissues and are involved in the differentiation processes during the embryonal development. Their expression is reduced or absent in different human malignancies even though their role in the tumorigenesis is not yet characterized.
Our aim was to investigate the role of Lamin A/C, belonging to A-type lamins, in the differentiation and tumorigenesis of neuroblastoma cells. We have also studied whether Lamin A/C could represent a marker of drug sensitivity, which could contribute to develop therapeutic strategies based on the molecular profile of the individual tumor.
As cellular model we employed a neuroblastoma cell line able to differentiate in vitro and showing high expression levels of Lamin A/C, the SHSY5Y cell line. As differentiating stimulus we used the all-trans retinoic acid (RA), the most effective compound which has been shown to induce differentiation in neuroblastoma cells and that is employed as biological agent in clinics to improve patients‟ survival.
Silencing of Lamin A/C blocked the differentiation processes activated by the RA in SHSY5Y cells, thus preventing the formation of neurites and inhibiting the expression of the tyrosine hydroxylase differentiation marker. The genome-wide gene-expression profiling of SHSY5Y cells silenced for LMNA gene (miRL cells), in the presence or not of the differentiating stimulus confirmed that miRL cells have down-regulated those genes necessary for the differentiation program. As well an increase of tumor progression related genes shifted the SHSY5Y cells phenotype towards a more aggressive one, with a higher resistance elicited versus some chemoterapic agents, thus demonstrating that Lamin A/C could represent a good marker of neuroblastoma tumor progression and of response to antitumoral therapeutics.
2
SOMMARIO
Il neuroblastoma è uno dei tumori solidi infantili più aggressivi. Il suo grado di differenziamento può influenzare lo sviluppo della malattia e l‟esito clinico poiché più il tumore risulta differenziato più la prognosi è favorevole. La maggior parte delle cellule di neuroblastoma mantiene la capacità di differenziare in vitro in presenza di diversi stimoli e ciò le rende un buon modello per studiare il potenziale differenziativo di tali tumori.
Le lamine nucleari sono proteine che appartengono alla classe dei filamenti intermedi di tipo V. Formano una struttura reticolare al di sotto della membrana nucleare interna e svolgono diverse funzioni, alcune delle quali non sono state ancora del tutto chiarite. Tra le lamine, quelle di tipo A sono espresse nei tessuti differenziati e sono coinvolte nei processi differenziativi che avvengono durante lo sviluppo embrionale. La loro espressione risulta ridotta o assente in molti tumori umani, tuttavia non è stato ancora caratterizzato un loro ruolo nei processi di tumorigenesi.
Il nostro obiettivo è stato quello di indagare il ruolo della Lamina A/C, appartenente alle lamine di tipo A, nel differenziamento e nella tumorigenesi delle cellule di neuroblastoma. Abbiamo inoltre verificato la possibilità che la Lamina A/C sia un marcatore di sensibilità ai farmaci chemioterapici, in quanto ciò consentirebbe di sviluppare strategie terapeutiche personalizzate sulla base del profilo molecolare del singolo tumore.
Come modello cellulare abbiamo utilizzato la linea di neuroblastoma SHSY5Y, che esprime ad alti livelli la Lamina A/C ed è in grado di differenziare in vitro. Abbiamo scelto quale stimolo differenziativo l‟acido retinoico (RA), poiché è il composto più efficace nell‟indurre il differenziamento delle cellule di neuroblastoma ed è inoltre utilizzato in clinica per aumentare la sopravvivenza dei pazienti affetti da neuroblastoma.
Il silenziamento della Lamina A/C nella linea SHSY5Y ha causato un blocco dei processi differenziativi attivati da RA, in quanto risultano inibite sia la formazione dei neuriti che l‟espressione del marcatore tirosina idrossilasi. Lo studio del profilo di espressione genica delle cellule SHSY5Y silenzate per il gene LMNA (cellule miRL), in presenza o meno dello stimolo differenziativo, ha confermato una repressione di diversi geni necessari al differenziamento. Le cellule miRL mostrano inoltre un incremento nell‟espressione di geni relati alla progressione tumorale che si accompagna ad un fenotipo più aggressivo nonché ad un‟aumentata resistenza ad alcuni farmaci chemioterapici. L‟espressione della Lamina A/C nel neuroblastoma potrebbe dunque essere un buon marcatore di progressione tumorale e di risposta alla terapia farmacologica.
3
1
INTRODUCTION
1.1 NEUROBLASTOMA
Neuroblastoma is an embryonic tumor of the autonomic nervous system and is the most common extracranial solid cancer in childhood. As can be expected with a disease of developing tissues, neuroblastoma generally occurs in very young children: close to 50 percent of neuroblastoma cases occur in children younger than two years old .
The clinical presentation of neuroblastoma is extremely variable, ranging from highly aggressive phenotypes to benign tumors with a high propensity for spontaneous regression (Brodeur, 2003). Three broad risk categories (low, intermediate, and high risk) have been proposed on the basis of analysis of age at diagnosis, histology category, grade of tumor differentiation, DNA ploidy, and copy-number status at the MYCN oncogene locus at chromosome 11q. In particular the MYCN oncogene is target of high-level amplifications at chromosome band 2p24 observed in about 20% of neuroblastoma and since such amplification has been found to profoundly affect the patients‟ clinical outcome, it is routinely used as prognostic biomarker and for treatment stratification (Seeger et al., 1985).
Treatment strategies employed in neuroblastoma patients depends on the risk group they belong to. Patients with localized neuroblastoma (low risk) have excellent event-free survival rates with surgical excision of tumor only and an overall survival rate higher than 95%. Intermediate risk group patients include children younger than 18 months with essentially non-MYCN–amplified tumors. They are subjected to surgery and chemotherapy (drugs employed are cyclophosphamide, doxorubicin, carboplatin and etoposide). Treatment of high-risk group patients includes multi-agent chemotherapy, surgery, and radiotherapy, followed by consolidation therapy with high-dose chemotherapy and peripheral blood stem cell rescue. Control of minimal residual disease with biological agents has also been shown to improve survival. The most effective compound is 13cis -retinoic acid, which has been shown to induce differentiation in neuroblastoma cells (Matthay et al., 1999).
The high degree clinical heterogeneity of neuroblastoma reflects the complexity of genetic and genomic events associated with the development and progression of this disease. Inherited genetic variants and mutations that initiate tumorigenesis have been identified in neuroblastoma and multiple somatically acquired genomic alterations have been described that are relevant to disease progression (Capasso and Diskin, 2010). Familial neuroblastoma is reported in only about 1% of patients and is caused by a very rare germline mutation in the anaplastic lymphoma kinase (ALK)
4
oncogene (Mosse et al., 2008).These mutations result in a constitutive activation of the kinase and a premalignant state. Children with either sporadic or familial neuroblastoma usually have loss-of-function mutations in the homeobox gene PHOX2B. Thus, genetic analysis of ALK and PHOX2B mutations should be considered every time a patient has family history of neuroblastoma (Mosse et al., 2004). Nevertheless, additional familial genes may still be discovered. A genome-wide association study of neuroblastoma is currently under investigation, with the support of Children‟s Oncology Group. To date, the study has shown that a relative common copy-number variation at 1q21 chromosome is associated with the neuroblastoma and that alleles with common single-nucleotide-polymorphism variations within the putative genes FLJ22536 and BARD1 are significantly enriched in neuroblastoma patients compared with control groups (Capasso et al., 2009; Maris et al., 2008).
1.1.1 Neuroblastoma as a sympathetic nervous system-derived tumor
The human nervous system consists of the Central Nervous System (CNS), comprising the brain and the spinal cord, and the Peripheral Nervous System (PNS), which links the CNS with the body‟s sense receptors, muscles, and glands. The PNS is divided in two components: the somatic or skeletal nervous system, which controls voluntary movement, and the autonomic nervous system, which regulates inner organ function via the sympathetic, parasympathetic or enteric ganglia.
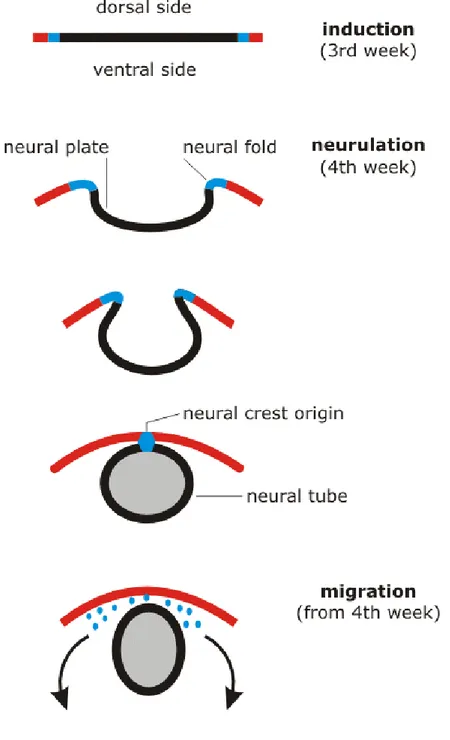
The human nervous system originates from the neural plate, an embryonic structure evolving from the ectodermal germ layer during the third week of gestation. During the process of neurulation, the neural plate invaginates ventrally and closes in order to form the neural tube, which will give rise to the CNS. During this closure, neural crest cells originate at the interface between the closing neural tube and the dorsal ectoderm (LaBonne and Bronner-Fraser, 1999). The neural tube is initially composed of a single layer of cells. However, as development proceeds and extensive cell division occurs, the neural tube becomes multilayered, with precursor cells dividing in the medial portion of the neural tube adjacent to the central cavity, which will give rise to ventricles. The portion of the neural tube adjacent to the ventricles becomes the Ventricular Zone (VZ) and contains neural stem cells and dividing progenitors (Greene and Copp, 2009). These stem cell populations are capable of self-renewing through symmetric cell divisions or can differentiate through asymmetric cell divisions.
5
Fig. 1.1 Nervous system development (cross-section): invagination of the dorsal ectoderm, closure of the neural tube,
neural crest formation at the interface of the closing neural folds and dorsal ectoderm, and migration of the pluripotent crest cells (human time frame).
The neural tube expands in the head of the embryo to form the brain and in the trunk to form the spinal cord. The PNS derives from the neural crest and the ectodermal placodes. Neural crest cells delaminate from the neural tube and migrate extensively throughout the embryo to generate, differentiate, and populate numerous organs. The migrating neural crest cells are largely guided along distinct pathways by specialized adhesion molecules in the extracellular matrix or by
6
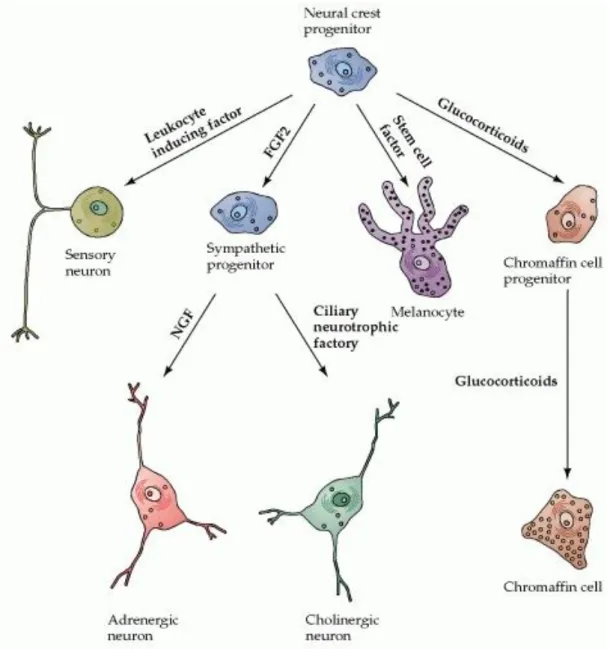
molecules on the surfaces of cells in the embryonic periphery. The movement through a varying cellular environment has important effects on their differentiation. In fact, during their migration specific growth factors induce neural crest cells to differentiate into distinct phenotypes including the neurons and glia of the sensory and visceral motor (autonomic) ganglia, the neurosecretory cells of the adrenal gland, and the neurons of the enteric nervous system. They also contribute to variety of non-neural structures such as melanocytes, cartilage, dentine, and bone. NSCs can persist in adult organism as undifferentiated immature populations, and can be recruited to replace dead or damaged cells following injury or during the course of normal development and aging (Anderson, 1997).
Fig. 1.2 The differentiation of neural crest cells. The establishment of each precursor type relies on signals provided by
7
Extensive parallel characterization of marker genes expressed in human Sympathetic Nervous System (SNS) during embryonic and fetal development and in human neuroblastoma, reveals that these tumors have immature neuronal characteristics, thus indicating their derivation from precursors cells of the sympathetic lineage (Hoehner et al., 1998).
Recently, it has been proposed that mutations in specific neural stem cells or early neural progenitors can give rise to a small population (1-2% of the total) which is capable of tumor initiation. As described in the stem cell hypothesis of cancer initiation, neoplasms may be viewed as a heterogeneous population of cells formed by cancer cells and cancer stem cells (CSCs) (Bjerkvig et al., 2005). As normal stem cells, CSCs are capable of self-renewing and differentiation within the tumor. It has been shown that CSCs can naturally survive antitumoral treatments and could be responsible for tumor re-growth and metastasis. This resistance can be attributed not only to their quiescent nature but also to an elevated expression of anti-apoptotic proteins and drug efflux pumps belonging to superfamily of ABC transporters (Hirschmann-Jax et al., 2004). As a consequence, more effective chemotherapy could be achieved by specifically targeting also these cells. Although the very low representativeness of CSCs in tumors they have been identified in several brain tumors, including neuroblastoma, as well as in established cancer cell lines (Singh et al., 2004) (Walton et al., 2004). The neuronal CSCs express several surface markers peculiar of stem cells such as the CD133, CD34, ABCG2, and nestin (Mahller et al., 2009).
1.1.2 Neuroblastoma cell lines as “in vitro” differentiation model
The degree of neuroblastoma differentiation has been related with the patient outcome, high differentiation stage correlating to favorable prognosis (Hedborg et al., 1995). Nevertheless, the mechanisms governing neuroblastoma cell differentiation are only partially understood. In such a rare malignancy as neuroblastoma, access to fresh tumor material is limited and in vitro studies based on primary tumor explants are difficult to perform. The possibility to use long term cultures derived from neuroblastoma tumors allowed to study the peculiar properties of such tumors and to understand the propensity of neuroblastoma cells to differentiate in vitro and in vivo. As previously stated, neuroblastoma cells are very heterogeneous; usually they are undifferentiated, round and small with scant cytoplasm, but most of them retain the capacity to differentiate in vitro following an adequate stimulus (Edsjo et al., 2007).
8
Many established neuroblastoma cell lines contain at least 3 distinct morphological variants (Walton et al., 2004) (Ciccarone et al., 1989). The most common variant are the sympathoadrenal neuroblasts (N-type), which grow as poorly attached aggregates of small, rounded cells with short neuritic processes. The S-type cells are instead large and flattened cells that attach strongly to the substrate. They resemble Schwannian, glial or melanocytic progenitor cells and they are non-malignant. The third cell type is termed I because its phenotype is intermediate between the N and S type. I-type cells are small, flattened and moderately adherent, and have the potential to differentiate into N- or S-type cells (Ross et al., 1994).
The ability of many neuroblastoma cell lines to differentiate in the presence of various agents (e.g. retinoids and phorbolesters such as 12-O-tetradecanoyl phorbol-13-acetate) and growth factors (NGF, BDNF) has led to the use of neuroblastoma cell lines as model systems to study tumor cell maturation in general and human neuronal differentiation in particular (Edsjo et al., 2007).
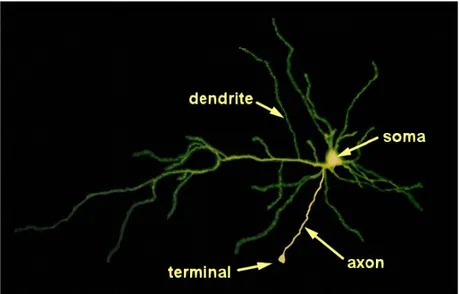
One of the hallmarks of neuroblastoma differentiation in culture is the ability of the cells to form neurites, a property which is peculiar of normal neurons. During development, neurons assembled into functional networks by growing out axons and dendrites (collectively called neurites) which connect neurons each other through particular junctions, named synapses (or synaptic terminals), and allow the interneuronal transmission of electrical or chemical signals.
Fig. 1.3 General Structure of a Neuron. Each neuron has three basic parts: cell body (soma), one or more dendrites, and
9
Additional markers evidenced in neuroblastoma differentiated cells are the expression of neurofilaments; the synthesis of neurotransmitter biosynthetic enzymes; the expression of opioid, muscarinic and neurotrophin receptors; the presence of dense core granules, presumed sites of catecholamine storage; the expression of neuron specific enolase (NSE). When differentiated, neuroblastoma cells present either an adrenergic phenotype producing relatively high levels of tyrosine hydroxylase (TH) and dopamine-ß-hydroxylase (DBH), or a cholinergic phenotype showing a high activity of choline aceltyltransferase (ACHE) (Hill and Robertson, 1997) (Handler et al., 2000).
1.1.3 Retinoids-induced neuroblastoma cell differentiation
Among the most widely used agents that induce terminal differentiation reducing cell growth in selected neuroblastoma cell lines are retinoids. (Sidell, 1982).
The retinoids (all-trans-retinoic acid or ATRA, 13-cis retinoic acid and 9-cis retinoic acid) are a class of polyisoprenoid lipids which include vitamin A (retinol) and its natural and synthetic analogs. Retinoids are compounds with multiple functions. They are involved in the control of cell proliferation, cell differentiation, and embryonic development. Vitamin A is indispensable for embryonic pattern formation, for visual function, and the differentiation of epithelial tissues.
The signaling pathway of retinoids involves specific nuclear receptors that regulate gene expression: the retinoic acid receptors (RAR α, β, γ) and the retinoic X receptor (RXR α, β, γ). These non-steroid nuclear hormone receptors bind their retinoid ligands, target to retinoic responsive elements on DNA and up- or down-regulate transcription. Neuroblastoma cells constitutively express RARα, RARγ, RARβ and RXRs although the levels of RARβ are reduced compared to RARα and RARγ (Li et al., 1994). Neuroblastoma treatment with ATRA besides inhibiting cell growth results in a decreased anchorage-independent growth, and in the expression of some neuronal differentiation markers such as extensive neuritic processes, ultrastructurally and electrophysiologically similar to those of normal neurons; increased neuron specific enolase activity; slight accumulation of norepinephrine; up-regulation of GAP43, coding for the growth associated protein 43, a protein important in axonal growth. (Pahlman et al., 1984). Moreover, decrease in a number of proto-oncogenes (MYCN, MYB, HRAS), increase in the TrkB and RET receptors expression and activity, were shown to precede the morphological differentiation (Thiele et al., 1988).
10
As a therapeutic tool, retinoids, such as 13-cis-retinoic acid (isotretinoin), have been shown promising in reducing the risk of recurrence after high-dose chemotherapy and stem cell transplant. Recently, potentially more effective retinoids, such as fenretinide, are now being studied in clinical trials (Villablanca et al., 2006).
Fig. 1.4 Scheme of the intracellular pathways involving retinoids (CRBP: cellular retinol binding protein; CRABP:
cellular retinoic acid binding protein; RARE: retinoic acid response element; RBP: retinol binding protein; RoDH: retinol dehydrogenase.)
1.2 NUCLEUS AND NUCLEAR LAMINA
In eukaryotic cells, the nucleus is a large membrane-bound organelle which houses the genetic material. The nucleus is separated from the cytoplasm by a nuclear membrane known as the nuclear envelope (NE) that consists of two parallel cellular membranes, an inner and an outer membrane, separated by 10 to 50 nanometers. The outer nuclear membrane (ONM) is continuous with the membrane of the rough endoplasmic reticulum (RER) and is studded with small openings called nuclear pore complexes (NPCs), which allow the movement of selected molecules in and out of the nucleus. In fact, the NE acts as a selective barrier controlling the traffic of macromolecules, including proteins and RNAs. The space between the membranes is called the perinuclear space and is continuous with the RER lumen. The inner nuclear membrane (INM) is lined by a complex meshwork of intermediate filament proteins forming the Nuclear Lamina (NL) that structurally
11
supports the NE and largely determines the overall shape of the interphase nucleus (Gerace and Burke, 1988).
Fig. 1.5 Schematic representation of nucleus structures
1.2.1 Lamins
The major components of the NL are type V intermediate filament (IF) proteins, the nuclear lamins. Like all proteins, they are synthesized in the cytoplasm and then transported into the nucleus, where they are assembled before being incorporated into the existing network of NL (Aebi et al., 1986).
Lamins are divided into A and B types based on sequence homologies. In mammals, two major A-type lamins (Lamin A and C) and two major B-type lamins (Lamin B1 and B2) have been characterized. Minor isoforms such as the Lamin AΔ10 (Machiels et al., 1996), the germ cell-specific lamins C2 (Furukawa et al., 1994) and B3 (Furukawa and Hotta, 1993), have been also identified. While B-type lamins are encoded by different genes, Lamins A and C are derived from one gene, LMNA (located on chromosome 1q21.2-q21.3), by alternative splicing ((Broers et al.,
12
2006); (Schumacher et al., 2006); (Verstraeten et al., 2007)). These two latter lamins are produced in roughly equal amounts.
Little is known about the regulation of lamins gene expression. Slight informations are available on the regulation of LMNA gene expression. LMNA promoter presents different regulatory motifs among which a retinoic acid-responsive element (Okumura et al., 2000), binding sites for various transcription factors such as c-Jun, c-Fos and Sp1/3 (Okumura et al., 2004) or transcriptional coactivator such as CREB-binding protein (Janaki and Parnaik, 2006). Within the first intron of LMNA gene there are also binding sites for two transcription factors, the hepatocyte nuclear factor-3β and the retinoic X receptor β (Arora et al., 2004).
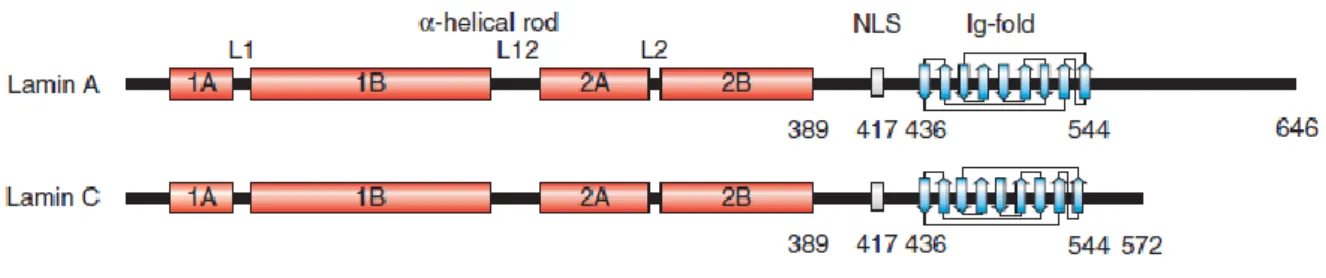
The lamins consist of an amino (N)-terminal globular domain, a central α-helical coiled-coil rod domain and a globular carboxy (C)-terminal tail domain. Like the components of other intermediate filaments, the lamin alpha-helical domain is used by two monomers to coil around each other, forming a dimer structure called “coiled coil”. Two of these dimer structures then join side by side, in an antiparallel arrangement, to form a tetramer called “protofilament”. Eight of these protofilaments are laterally combined and twisted to form the characteristic 10 nm intermediate filament structure. These filaments can be assembled or disassembled in a dynamic manner. Although A- and B-type lamins interact each other in vitro (Sasse et al., 1998), little is known about their composition and structure in the cells within the lamina. Lamins contain a structural motif similar to a type of immunoglobulin fold (Ig-fold) within their C-terminal domain (Dhe-Paganon et al., 2002). Unique among the other intermediate filaments, lamins contain also a nuclear localization signal (NLS) and, with the exceptions of lamins C and C2, a C-terminal CAAX motif (where C is cysteine, A is an aliphatic amino acid and X is any amino acid), which allows to extensive post-translational modification of these proteins.
Fig. 1.6 Schematic structure of mature lamin A and lamin C polypeptide chains. The lamin structure consists of a short
amino terminal head domain, a central α-helical rod domain (red), and the carboxy-terminal domain containing the NLS and the Ig-fold (blue; the nine b-strands of the Ig-fold motif are depicted).
13
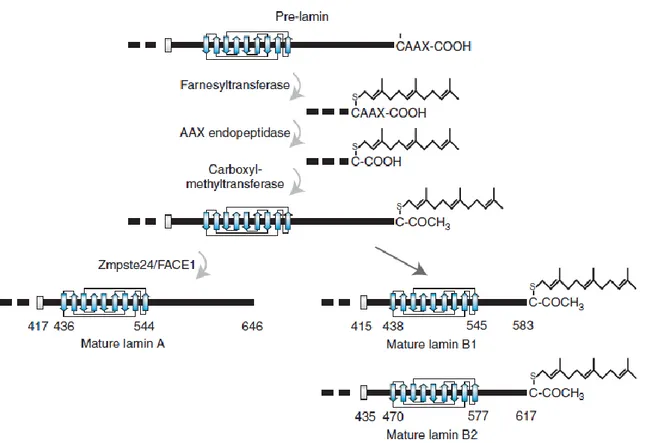
Lamins A, B1, and B2 are initially expressed as pre-lamins that require extensive post-translational modifications of their carboxy-terminal –CAAX box to become mature lamins (Rusinol and Sinensky, 2006). The maturation process starts with farnesylation at the terminal cysteine site and is followed by cleavage of the last three amino acid residues of the CAAX motif and methylation of the carboxy-terminal cysteine. While the maturation of B-type lamins is terminated at this step, resulting in permanent farnesylation and carboxymethylation, an additional 15 amino acids are removed from the carboxyl terminus of farnesylated/carboxymethylated prelamin A (Corrigan et al., 2005). The last cleavage probably takes place during or after incorporation of this molecule into the nuclear lamina. Lamin C, which is 74 residues shorter than mature Lamin A, does not possess a –CAAX box and therefore is not farnesylated or otherwise modified.
Besides to farnesylation and carboxymethylation, lamins are also posttranslationally modified by phosphorylation (Ottaviano and Gerace, 1985), sumoylation (Zhang and Sarge, 2008), ADP-ribosylation (Adolph, 1987), and possibly by glycosylation (Ferraro et al., 1989). At the onset of mitosis, the phosphorylation of lamins at specific sites by cyclin-dependent kinase 1 (Cdk1) and protein kinase C (PKC) is required to drive disassembly of the lamina (Dessev et al., 1988; Goss et al., 1994). Subsequently, dephosphorylation of the lamins by protein phosphatase1a is required for lamin/lamina assembly during the telophase/early G1 transition (Thompson et al., 1997).
14
Fig. 1.7 Posttranslational processing of the carboxyl terminus of prelamins A, B1, and B2. Processing takes place in a
series of steps: (1) addition of a farnesyl group to the cysteine residue of the –CAAX box of pre-lamin A, prelamin B1 and prelamin B2 by a farnesyltransferase; (2) removal of the last three residues (2AAX) by an AAX endopeptidase; (3) methylation of the terminal carboxylic acid group (2COOH) by a carboxyl methyltransferase; (4) removal of the carboxyl terminal 15 amino acids of lamin Awith the farnesyl attached by the metalloprotease Zmpste24/FACE1. This last proteolysis step does not occur on B-type lamins and therefore they remain farnesylated.
1.2.2 Lamins during development and differentiation processes
Studies of the early development of Xenopus have shown that the individual types of lamins are differentially expressed in early development and that the changes in the nuclear lamina composition correlate with major programs in cell differentiation (Benavente et al., 1985). Similar changes in lamins expression have been reported in early developing Drosophila (Riemer et al., 1995) and chicken embryos (Lehner et al., 1987).
In mammals, although at least one B-type lamin is expressed in all cells throughout development, the expression of A-type lamins is regulated during development (Schatten et al., 1985). In mice, B-type lamins are expressed during early development, while acquisition of the Lamin A/C expression varies according to developmental stage of tissue differentiation (Stewart and Burke, 1987) (Rober et al., 1989). This has been confirmed in several studies using human and
15
mouse cultured cells (Lin and Worman, 1997). More recently it has been shown that B-type lamins, but not A-type ones, are expressed in undifferentiated mouse and human embryonic stem (ES) cells. The regulated expression of A- and B-type lamins is also evident during differentiation of stem cells in culture. In fact, during the in vitro differentiation process, human ES cells appear to express Lamin A/C before a complete down-regulation of the pluripotency marker Oct-4, suggesting that Lamin A/C expression is an early indicator of ES cell differentiation (Constantinescu et al., 2006). Differential expression of A- and B-type lamins has also been shown during neurogenesis in the adult rat brain (Takamori et al., 2007).
Comprehensions into the role of lamins during development come from the analysis of mutations in the B-type Drosophila lamin Dm0 that cause lethality at different embryonic or late pupal stages (Osouda et al., 2005). Further insights into the requirement for a specific lamin isoform during development have been obtained from knocking out either LMNA or LMNB1 in mice. The Lamin A/C-deficient animals develop normally until birth, but have severe postnatal growth retardation and develop muscular dystrophy (Sullivan et al., 1999). By contrast, mice that are null for Lamin A but express Lamin C and the B-type lamins appear to be healthy. On the other hand, Lamin B1-deficient mice die at birth and have defective lungs and bones (Vergnes et al., 2004).
The developmental regulation of Lamin A/C expression has led various laboratories to hypothesize that these proteins play a role in differentiation. This has been recognized in muscle and adipocyte differentiation processes. More specifically, in the case of muscle, during myoblast differentiation there are changes in Lamin A/C organization strictly dependent from the tumor suppressor pRb (Muralikrishna et al., 2001). Expression of a mutant form of Lamin A in C2C12 myoblasts induces elevated levels of hyperphosphorylated pRb, leading to an inhibition of the differentiation of myoblasts into myotubes (Favreau et al., 2004). In addition, in vitro myogenesis is impaired in LMNA-null skeletal myocytes (Frock et al., 2006). Otherwise, several LMNA mutations have been linked to the development of lipodystrophies. In fact, it is known that the adipocyte differentiation factor, sterol response element binding protein 1 (SREBP1), interacts with the C terminus of Lamin A/C and that this interaction is impaired to various degrees by mutations in Lamin A (Lloyd et al., 2002; Hubner et al., 2006), thus contributing to the dysregulation of adipocyte differentiation.
16
1.2.3 Lamins and regulation of the cellular mechanical properties
The highest and well-established function of nuclear lamins is to provide shape and mechanical stability to the nucleus (Goldman et al., 2005). In support of this, the nuclei of LMNA knockdown fibroblasts display increased deformability and impaired viability under mechanical strain (Houben et al., 2007). Increased nuclear deformability is also observed in human ES cells lacking A-type lamins (Pajerowski et al., 2007). Moreover, cells either deficient in lamins or expressing mutant lamin proteins often contain deformed nuclei (Muchir et al., 2003; Bechert et al., 2003; Vaughan et al., 2001).
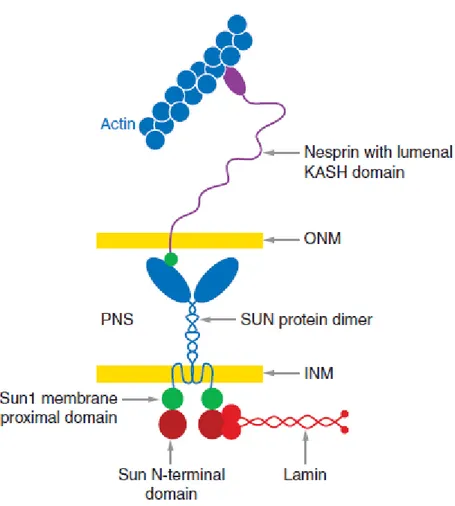
Furthermore, several evidences support a role for the lamins in maintaining the mechanical properties of the entire cell by forming not only a complex network in the nucleus but also a bridge between the nucleus and the cellular membrane via the cytoskeleton. Indeed, Lamin A/C deficiency causes impaired mechanotransduction and decreased mechanical stiffness (Lammerding and Lee, 2005). These alterations may be explained by modifications in connections between the nucleoskeleton and the cytoskeleton. Specifically, the connection between the cytoplasm and nucleoplasm might be mediated by the interaction between integral proteins of INM (the Sun proteins Sun1 and Sun2) and of ONM (the nesprins nesprin-1, nesprin-2, and nesprin-3α) in the luminal space (Padmakumar et al., 2005; Ketema et al., 2007). In the nucleoplasm Sun proteins interact with Lamin A (Haque et al., 2006), while in the cytoplasm, nesprins are thought to bind to actin (Warren et al., 2005) and possibly microtubules (Wiche, 1998). This assembly is referred to as the LINC complex (for LInker of Nucleoskeleton and Cytoskeleton) and establishes a physical connection between the nucleoskeleton and the cytoskeleton (Crisp et al., 2006).
17
Fig. 1.8 A model for the LInker of Nucleoskeleton and Cytoskeleton (LINC) complex. Nuclear components, including
lamins, bind to the inner nuclear membrane SUN domain proteins, which in turn bind to the KASH domain of the actin-associated giant nesprins on the outer nuclear membrane. The LINC complex establishes a physical connection between the nucleoskeleton and the cytoskeleton.
1.2.4 Role of lamins in chromatin organization and gene expression
In mammals, heterochromatin is highly organized and closely associated with the lamina at the nuclear periphery (Marshall and Sedat, 1999). Instead, actively transcribed regions (euchromatin) appear to have a more random distribution in the nucleoplasm (Francastel et al., 2000). Recent models of nuclear architecture describe lamins as determining factor for chromosome positioning throughout the nucleus (Dorner et al., 2007; Vlcek and Foisner, 2007; Reddy et al., 2008). As a consequence the lamins would be involved in anchoring chromatin to the nuclear lamina and would also act as a nucleoplasmic scaffold for organizing chromatin in the nucleus.
The interaction between the lamins and chromatin involve their non-α-helical C-terminal tail domain and the N- and C-terminal tail domains of core histones (Mattout et al., 2007; Goldberg et
18
al., 1999). Several proteins have been also described as lamin-binding proteins which directly link both A- and B-types lamins to DNA (Schirmer and Foisner, 2007). Among these proteins are a Lamin B Receptor (LBR), which is an integral protein of the INM (Ye and Worman, 1994), the LAP2α protein, that binds specifically to Lamin A/C, the LAP2β protein, that interacts exclusively with B-type lamins (Dechat et al., 2000; Furukawa and Kondo, 1998), and the Barrier to Autointegration Factor (BAF), which has been reported to bind to dsDNA and to histones (Margalit et al., 2007). However, the functional significance of these complex interactions remains to be determined.
On a more global level, lamins could influence gene expression also because they may provide a structural scaffold for the organization of RNA polymerase II transcriptional complexes but not for RNA polymerase I- and III-directed transcription (Spann et al., 2002).
A-types lamins have been also described to interact with transcription factors thus regulating gene expression. These interactions appear to regulate transcription in several ways: by sequestering transcription factors in inactive complexes at the nuclear envelope, altering posttranslational modifications important for their function and regulating transcriptional complexes (Andres and Gonzalez, 2009).
1.2.5 Role of lamins in DNA replication and cell proliferation
Several lines of evidence indicate that lamins play a role in DNA replication. Indeed, a properly assembled nuclear lamina is necessary to DNA replication activity (Ellis et al., 1997). It has been shown that Lamin B1 colocalizes with the replication foci during late S phase in mouse 3T3 cells (Moir et al., 1994) and that Lamin A/C are present at sites of early replication in normal human fibroblasts (Kennedy et al., 2000). Functional lamins are needed for a correct localization of replication factors such as PCNA and RFC, which are required in the elongation phase of replication (Moir et al., 2000). The dependence of DNA replication on the nuclear lamina may be, in part, mediated by the tumor suppressor Retinoblastoma product (pRb) since a complex formed by pRb and Lamin A/C has been localized to replication foci (Ozaki et al., 1994). In consideration of the physical interaction between Lamin A/C and pRb, there are clear evidences that Lamin A/C is involved in the regulation of the cell cycle. pRb is a major cell cycle regulator that in its hypophosphorylated state binds and inhibits the E2F transcription factors family necessary for cell cycle progression (Giacinti and Giordano, 2006). Upon hyperphosphorylation of pRb, E2F is
19
released to initiate S phase. A role for lamins in this process is further suggested by the finding that hypophosphorylated pRb is tightly associated with Lamin A/C-enriched nucleoskeletal preparations of early G1 cells (Mancini et al., 1994). In addition, there is a dramatic reduction in pRb levels in
LMNA−/− fibroblasts, indicating that lamins are involved in regulating the turnover and
proteasomal degradation of pRb. Based on these findings, it has been suggested that the increased rate of cell proliferation and the decreased capacity to undergo cell cycle arrest reported for Lamin A/C-deficient cells is attributable to the destabilization of pRb (Johnson et al., 2004; Van Berlo et al., 2005).
1.2.6 Laminopathies
Many aspects of nuclear as well as cytoplasmic activity are affected by modifications of the NE and the nuclear lamina. Processes as fundamental as DNA replication, transcription, and cell survival are altered in response to disruption of nuclear lamina, overexpression of mutant or truncated lamins, and loss-of-function mutations of the LMNA gene. Given the diversity of functions affected by these alterations, it is not surprising that complex patterns of tissue-specific pathologies are associated with lamins defects in humans. At present, no mutations in the Lamin B genes have been linked with human diseases, thus presuming that mutations in B-type lamins could be embryonic lethal. Conversely, mutations in the LMNA gene has been directely associated with a variety of human disorders broadly named “laminopathies” that are classified into primary and secondary laminopathies. The primary laminopathies are caused by mutations in the LMNA gene. The secondary ones are caused by mutations in the gene ZMPSTE-24 encoding for the endoprotease
FACE-1, enzyme which is required for the post-translational modification of the A-type lamins
(Ben et al., 2005).
The primary laminopathies are generally classified into five groups.
Group 1. This is the most frequent group and concerns diseases of skeletal and cardiac muscle.
The first mutations identified in the LMNA gene were those causing Autosomal-Dominant Emery- Dreifuss Muscular Dystrophy (AD-EDMD) (Bonne et al., 1999). LMNA mutations display a wide variability in the severity of the defects produced which could be lethal (Morris, 2001). However, mutations in LMNA could also be responsible for dilated cardiomyopathy with conduction system disease (DCM-CD1) without apparent dystrophy in the skeletal muscles (Fatkin et al., 1999). Limb girdle muscular dystrophy 1B (LGMD1B) is also caused by mutations in LMNA, and is associated
20
with fewer cardiac complications and tendon contractures (Muchir et al., 2000). The heterogeneity in phenotypes, even among members of a single family carrying the same LMNA mutation, indicates that these disorders represent a spectrum of diseases that may originate from a common genetic alteration and can be successively influenced by environmental factors. To date, diseases affecting striated muscle comprise about 60% of the laminopathies. Considerably, about 50% of patients diagnosed with AD-EDMD or EDMD have mutations in either the emerin (EMD) or LMNA genes (Ben et al., 2005).
Group 2. The second group is associated with diseases in white adipose tissue and/or the
skeleton, such as Dunnigan-type familial partial lipodystrophy (FPLD) and Mandibuloacral dysplasia (MAD) (Cao and Hegele, 2000) (Novelli et al., 2002). FPLD is inherited as an autosomal-dominant trait mainly associated with a missense mutation of Arg482. FPLD is characterized by an aberrant adipose tissue redistribution that may be a result of an autonomous defect in specific subsets of mesenchymal or adipocyte precursors (Shackleton et al., 2000). Rare autosomal-recessive mutations in the C-terminal domain of A-type lamins are responsible for MAD (Simha et al., 2003). MAD is a disease with many of the metabolic and fat depot redistribution phenotypes of lipodystrophy, but with a wide range of defects including alterations in skeletal development.
Group 3. The third group is a single autosomal-recessive mutation in the rod domain of A-type
lamins resulting in a peripheral neuropathy associated with demyelination of motor neurons, the Charcot-Marie-Tooth syndrome type 2b (CMT2B1) (Chaouch et al., 2003). Families homozygous for the R298C lamin variant have abolished deep-tendon reflexes, distal amyotrophy, motor deficits, and loss of large myelinated nerve fibers. The muscular weakening associated with this disease is likely a secondary result of loss of enervation and subsequent muscle atrophy. Interestingly, neurons in the sciatic nerve of the LMNA null mice showed extensive demyelination (De Sandre-Giovannoli et al., 2002).
Group 4. The fourth group includes the premature aging diseases, Hutchinson Gilford Progeria
Syndrome (HGPS) and some cases of atypical Werner syndrome. HGPS is a rare dominantly inherited disease associated with a splicing defect in exon 11 of the LMNA gene causing a 50 amino acid truncation in the Lamin A protein without affecting the Lamin C protein (De Sandre-Giovannoli et al., 2003). The resultant Lamin A mutant has been named Progerin. Patients show symptoms of premature aging, including severe growth retardation, loss of subcutaneous fat, alopecia, reduced bone density, and poor muscle development. The average age of death in HGPS is 12 to 15 years, usually due to severe artherosclerosis resulting in myocardial infarction or stroke (Sarkar and Shinton, 2001). A second premature aging syndrome is the autosomal-recessive
21
inherited Werner syndrome. Most (83%) patients have mutations at the WRN gene codifying for a DNA helicase-exonuclease. A few (15%) but significant number of cases of atypical Werner syndrome shows mutations in LMNA. These atypical patients have short stature, alopecia, osteoporosis, lipodystrophy, diabetes, and muscle atrophy (Chen et al., 2003).
Group 5. The fifth group is a heterogeneous group of syndromes comprising overlapping
pathologies in different tissues described in the first four groups, suggesting a possible continuum in the mechanisms underlying the laminopathies.
To date, over 200 mutations from more than 1000 individuals have been identified in the
LMNA gene, and a database on the nuclear envelopathies can be found at http://www.umd.be.
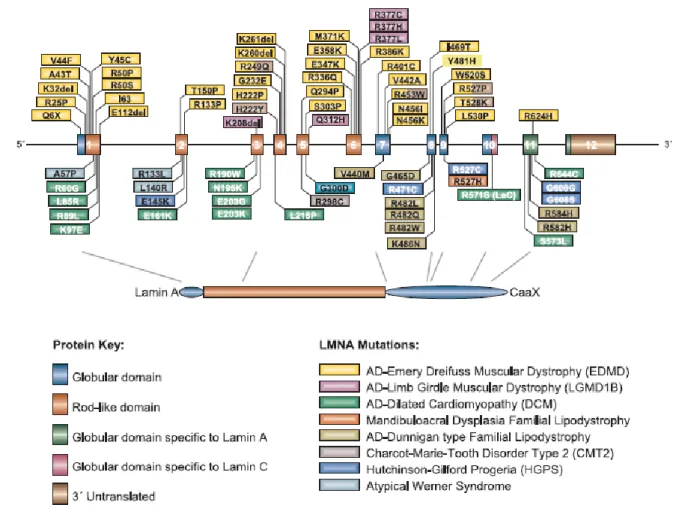
Fig. 1.9 Different mutations in LMNA are associated with different diseases. Most of the mutations resulting in the
diseases affecting striated muscles are distributed throughout the gene. The majority of the mutations that result in Mandibuloacral disease, Dunnigan-type familial partial dystrophy, and Hutchinson Gilford Progeria syndrome cluster in the region of the LMNA gene encoding the C-terminal globular domain.
22
1.2.7 Lamins and cancer
The expression of the A-type lamins is often reduced or absent in subsets of cells with a low degree of differentiation and/or cells that are highly proliferating including human malignancies, particularly leukemias, lymphomas, some skin cancers, including basal cell and squamous cell carcinoma, adenocarcinoma of the stomach and colon, squamous and adenocarcinoma of the esophagus, small cell lung cancer, testicular germ cell tumors and cancerous prostate tissues. (Stadelmann et al., 1990) (Oguchi et al., 2002) (Venables et al., 2001) (Moss et al., 1999) (Broers et al., 1993) (Machiels et al., 1997) (Coradeghini et al., 2006).
Altered expression and aberrant localization of A-type lamins often correlate with cancer subtypes and cancer aggressiveness, proliferative capacity and differentiation state. Given that tumor progression is often associated with regression from a more differentiated to a less differentiated state, loss of Lamin A/C expression may not be surprising. Even though the altered lamins expression are currently emerging as an additional event involved in malignant transformation and tumor progression, the role of A-type lamins in the tumorigenesis is not yet characterized and the molecular defect underlying the loss of A-type lamins in human cancer remained unknown.
It has been reported that A-type lamins CpG island promoter hypermethylation is a significant predictor of poor outcome in some lymphomas (Agrelo et al., 2005). Cancer may also be considered an epigenetic disease and patterns of aberrant DNA methylation are now recognized to be a common hallmark of human tumors. In fact, transcriptional inactivation by CpG island promoter hypermethylation is a well-established mechanism for gene silencing in human tumors. Since A-type lamins present an important dual role as protector of chromatin from damage and as multifunctional regulators of gene transcription, the epigenetic silencing of LMNA gene in hematologic malignancies could aid understanding as to how lamins dysregulation could contribute to cellular transformation.
23
2 AIMS
Considering the involvement of Lamin A/C in the tissue differentiation during the embryonal development, the main objective of this work was to investigate whether Lamin A/C could regulate neuroblastoma differentiation. Neuroblastoma is a highly aggresive embryonic tumor of the autonomic nervous system and is the most common extracranial solid cancer in childhood.
Moreover, taking into account the significance of differentiation stage in the neuroblastoma tumor progression I intended to identify a role of Lamin A/C in the tumorigenesis of this neuronal cancer and to investigate whether A-type lamins could also represent a marker of drug response.
To this aims I chose a neuroblastoma model able to differentiate in vitro and showing high expression levels of Lamin A/C. As differentiating stimulus I used the all-trans retinoic acid, the most effective compound which has been shown to induce differentiation in neuroblastoma cells and that is employed as biological agent in clinics to improve patients‟ survival.
24
3 MATERIALS AND METHODS
3.1 Cell lines maintenance, differentiation and treatments
Human malignant neuroblastoma (NB) SHSY5Y cell line was purchased from the American Type Culture Collection (ATCC, Manassas, VA, USA). Cells were grown in a 1:1 mixture of Eagle's Minimum Essential Medium and F12 Medium (Gibco, Grand Island, NY, USA) supplemented with 10% fetal bovine serum (FBS, Hyclone), 2 mM L-glutamine, 0.5% non-essential amino acids, 0.5% sodium pyruvate and 1% penicillin and streptomycin in a fully-humidified incubator containing 5% CO2 at 37˚C. LAN-5 NB cell line was a gift of Dr. Doriana
Fruci and was grown in RPMI-1640 (Gibco, Grand Island, NY, USA) supplemented with 10% FBS, 2 mM L-glutamine, 100 U/L penicillin and 100μg/L streptomycin in a fully-humidified incubator containing 5% CO2 at 37˚C.
For differentiation experiments cells were seeded at a density of 5×10³ cells/cm2. The following day cells were induced to differentiate by 10 µM retinoic acid (ATRA; Sigma Chemical, St. Louis, MO, USA, named RA throughout the thesis) in a “differentiation medium” composed by 50% fresh and 50% conditioned culture medium. Cells were fed after 3 days with differentiation medium containing fresh RA. RA was dissolved in dimethyl sulfoxide (DMSO, Sigma Chemical, St. Louis, MO, USA) and stored as stock at -80˚C. Because of light sensitivity of RA, all incubations were performed under subdued lighting. The concentration of DMSO in each experiment was always ≤0.01%, which was not toxic and did not induce differentiation.
For drugs experiments cells were seeded at a density of 5×10³ cells/cm2. Twenty-four hours after plating, fresh medium was added and after further 24 hours (48 hours of growth) cells were treated with different doses of cis-platin (DDP) or etoposide (VP-16), both dissolved in DMSO , for 2 hours.
3.2 Generation of recombinant viruses and lentiviral infection of cells
LMNA-Knock Down SHSY5Y cell line (named miRL) was generated by using a lentiviral
expression vector containing a double strand oligo encoding a pre-miRNA sequence as “knockdown cassette” thus enabling the expression of engineered miRNA sequence from Pol II promoters directed versus the LMNA mRNA. The knockdown cassette contains specific miRNA flanking sequences that allow proper processing of the miRNA. The expression vector design is based on the miRNA vector system developed in the laboratory of David Turner (U.S. Patent
25
Publication No. 2004/0053876) and includes the use of endogenous murine miR-155 flanking sequences. The lentiviral expression vector was produced using the BLOCK-iT Lentiviral Pol II miR RNAi Expression System (Invitrogen,, San Giuliano Milanese, Milan, Italy) to obtain from the pcDNA6.2-GW/EmGFP-miR-LMNA (Invitrogen) a Gateway®-adapted lentiviral destination vector (pLenti6/V5-DEST vector) according to the manufacturer‟s instructions. As a negative control we used the pcDNA™6.2-GW/± EmGFP-miR-neg control plasmid that contains an insert that can form a hairpin structure that is processed into mature miRNA, but is predicted not to target any known vertebrate gene.
Briefly, to transfer the pre-miRNA cassette (named, LMNA pre-miRNA cassette or Neg CTR pre-miRNA cassette) from pcDNA™6.2- GW/+EmGFP-miR expression clone into pLenti6/V5-DEST vector, we performed two Gateway® recombination reactions as follows. An “entry clone” was generated by performing a BP recombination reaction between the attB substrate (pcDNA™6.2-GW/EmGFP-miR expression clone) and attP substrate (pDONR™221 vector) using BP Clonase™ II Enzyme Mix. Next, an LR recombination reaction between the resulting “entry clone” (attL substrate) and pLenti6/V5-DEST vector (attR substrate) was performed using LR Clonase™ II Enzyme Mix, obtaining the GW/LMNA miRNA and the pLenti6/V5-GW/Neg CTR miRNA expression plasmids.
In order to produce lentiviral stocks, these vectors (3 µg) and the ViraPower™ Packaging Mix (9 µg) were cotransfected into 6x10⁶ packaging 293FT cells using Lipofectamine 2000 (Invitrogen Corp), according to the manufacturer‟s instructions. The supernatants were collected after 48 and 72 hours, and used for infection.
SHSY5Y cells were seeded into 6-well plates at a concentration of 2×10⁵ cells/well and the following day were infected for 18 hours with virus supernatant from pLenti6/V5-GW/LMNA miRNA or pLenti6/V5-GW/Neg CTR miRNA and then fresh medium was added. After 6 hours cells were subjected to a second round of infection for additional 18 hours. Stably transduced cells were selected by culturing in presence of blasticidin 3 µg/mL (Invitrogen). The transduced cells were screened by western blotting and real-time PCR assays to determine the levels of LMNA expression.
26
3.3 Western Blot analysis
Cultured cells were washed 2 times with PBS 1X and then incubated 1 min in urea buffer (8 M urea, 100 mM NaH2PO4, 10 mM Tris pH 8), scraped, harvested and then briefly sonicated. Proteins were subjected to SDS–polyacrylamide gels electrophoresis. The resolved proteins were blotted overnight to nitrocellulose membranes, which then were blocked in PBS 1X containing 5% non-fat milk for at least 1 hour. Blots were incubated with the following primary anti-human antibodies: anti-lamin A/C polyclonal antibody (N-18; Santa Cruz Biotechnology); anti-tyrosine hydroxyase polyclonal antibody (Cell Signaling); anti-GAPDH monoclonal antibody (6C5, Chemicon). The membranes were then incubated 45 min with the relevant secondary antibody (anti mouse, anti-rabbit or anti-goat IgG) conjugated with Alexa fluor 680 (Invitrogen) or IRDye 800 (LI-COR Biosciences) and analyzed with the Licor Odyssey Infrared Image System in the 700 or 800 nm channel.
3.4 Immunofluorescence microscopy
Cells were seeded on coverglass supports in complete medium and treated with ATRA for the indicated times. Cells fixed with 4% (w/v) paraformaldehyde were permeabilized in PBS containing 0.1% Triton-X100. NF200 was detected using the anti-NF200 monoclonal antibody (N52; Sigma). Alexa Fluor 594 goat anti-mouse was used as secondary antibody. Antibodies were diluted in PBS. The nuclei were stained with 1 mg/ml DAPI for 5 min in PBS. Finally, cells were washed in PBS, briefly rinsed in ddH2O and glasses were mounted in ProLong Gold anti-Fade Reagent (Molecular Probes). Images were acquired through a confocal laser scanning microscope (Leica Confocal Microsystem TCS 566 SP5). Images were processed using Leica Application Suite 6000. Brightness and contrast were adjusted. Figures were generated using Adobe Photoshop 7.0 and Adobe Illustrator 10.
3.5 Total RNA preparation
Cells were seeded in complete medium and after the different treatments were harvested and total RNA was isolated using NucleoSpin RNA II silica columns (Macherey-Nagel). RNA quantity was determined by absorbance at 260 nm using a NanoDrop UV-VIS spectrophotometer. Quality and integrity of each sample was checked using the Agilent BioAnalyzer 2100 (Agilent RNA 6000
27
Nanokit): samples with a RNA Integrity Number (RIN) index lower than 8.0 were discarded (Schroeder et al., 2006).
3.6 Real
‐time RT‐PCR analysis
RNA (500 ng) was retro-transcribed with High-Capacity cDNA Reverse Transcription Kit (Applied Biosystem) according to the manufacturer‟s instructions. Equal amount of cDNA was then subjected to real time PCR analysis with an Applied Biosystems 7900HT thermal cycler, using the SensiMix SYBR Kit (Bioline) and the following specific primers at a concentration of 200 nM:
LMNA (unigene Hs.594444) F: AGCAAAGTGCGTGAGGAGTT and R:
AGGTCACCCTCCTTCTTGGT; TH (unigene Hs.435609) F: ACGCCAAGGACAAGCTCA and
R: AGCGTGTACGGGTCGAACT; GAPDH (unigene Hs.544577) F:
AGCCACATCGCTCAGACA and R: GCCCAATACGACCAAATCC; TBP (unigene Hs.590872)
F: GAACATCATGGATCAGAACAACA and R: ATAGGGATTCCGGGAGTCAT; PPIA
(unigene Hs.356331) F: ATGCTGGACCCAACACAAAT and R:
TCTTTCACTTTGCCAAACACC. Each experiment was done in technical quadruplicates.
Expression data were normalized using the Ct values of the internal controls GAPDH, TBP and
PPI1A.
3.7 Whole genome expression profiling
The gene expression profiling was performed using the Agilent one-color microarray System (http://www.chem.agilent.com/enUS/Products/Instruments/dnamicroarrays/Pages/default.a spx). Poly A+RNA (500 ng) was retrotranscribed using oligo-dT primers linked to the T7- promoter and the resulting cDNA was used as a template for cyanine 3- CTP labelled cRNA preparation, using the Agilent Low Input Linear Amplification Kit. The labeled cRNA was purified with Qiagen‟s RNeasy mini spin columns. To monitor both the labelling reactions and the microarray performance, Agilent Spike-In Mix was added to the mRNA samples prior to labelling reactions according the RNA Spike-In protocol. Cyanine 3 labelled cRNA were hybridized to Agilent 4x44K whole human genome oligonucleotide microarray (GE2-v4_91). In this library the number of mRNAs is larger than the total number of genes, since in many cases different mRNAs probes (1 to 5) target the same gene. Agilent microarray probes are 60-mer DNA oligonucleotides and contains 41000 unique biological genes and transcripts. Microarray hybridizations were carried out in
28
Agilent‟s SureHyb Hybridization Chambers containing 1650 ng of Cyanine 3-labelled cRNA per hybridization. The hybridization reactions were performed at 65°C for 17 hours using Agilent‟s Gene Expression Hybridization Kit. The hybridized microarrays were disassembled at room temperature in Agilent Gene Expression Wash Buffer 1. After the disassembly, the microarrays were washed in Gene Expression Buffer 1 for one minute at room temperature, followed by washing with Gene Expression Wash Buffer 2 for one minute at 37°C. The microarrays were then treated with acetonitrile for one minute at room temperature. Post-hybridization image acquisition was accomplished using the Agilent Scanner G2564B, equipped with two lasers (532 nm and 635 nm) and a 48 slide auto-sampler carousel. Data extraction from the 20 bits TIFF images was accomplished by Agilent Feature Extraction ver 10.1 software using the standard Agilent one-color gene expression extraction protocol (GE1_107_Sep09). For all the subsequent analysis, the “gProcessedSignal” data column of the output file was used, containing the median signals corrected by spatial and multiplicative detrend.
Data filtering was performed in Microsoft Excel using any of the following criteria to discard spots: spots with more than 5% of saturated pixel in any of the two channels, spots with a Signal/Noise ratio smaller than 3 in any of the two channels, where Signal = (median of the spot - median spot background level) and Noise is the Standard Deviation of the median spot background. Differential gene lists were obtained from filtered data using Agilent GeneSpring GX 7.3 and Microsoft Excel. A threshold of 100.0 in the absolute expression level was chosen to obtain a higher stringency. Differentially expressed genes were identified as those showing an average fold change ratio larger than 1.5 and lower than 1/1.5 in the linear scale.
Functional annotations of differential gene lists was performed using the DAVID web tool (http://david.abcc.ncifcrf.gov/) (Huang et al., 2009), selecting the following categories both for functional clustering (high stringency) and charts: goterm_bp_4, goterm_bp_5, goterm_cc_4,
goterm_cc_5, goterm_mf_4, goterm_mf_5, panther_bp_all, panther_mf_all, interpro,
pir_superfamily, smart, panther_family, panther_subfamily, kegg_pathway, panther_pathway, chromosome, cytoband, cog_ontology, sp_pir_keywords, up_seq_feature. Gene clustering analysis was done using MeV 4.4 (MultiExperiment Viewer, TM4 suite , http://www.tm4.org/mev/) (Saeed et al., 2006).
Subsets of differential genes associated to specific cancer features were selected, based on the gene annotations in the Cancer Gene Index of the National Cancer Institute (NCI). The database is a file in XML format that can be downloaded from the URL: https://cabig.nci.nih.gov/inventory/data-resources/cancer-gene-index/. The current Index version
29
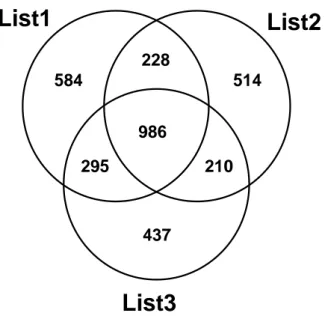
(June 2009) is a collection of records on about 7000 human genes identified as having an association with cancer, based on data mining of Medline. A gene is included in the database if the name co-occurs in a single Medline sentence with a cancer disease or compound/treatment term found in the NCI Thesaurus. The gene symbols are those defined by the HUGO Gene Nomenclature Committee, and the annotations of Agilent microarray probes are updated to 15 January 2010. We have compiled three gene symbol lists by extracting, from the whole Cancer Gene Index, genes associated to the following three Boolean queries, inserted as Regular Expressions in the search tool of a pure text editor (TextPad): List1: “migration OR invasion OR invasive OR metastasis OR adhesion OR adhesive”; List2: “drug resistance OR drug resistant OR survival OR survive OR sensitive OR sensitivity”; List3: “aggressive OR aggression OR progression OR progressive”. A gene was included in out lists if any of the terms in the corresponding query appeared in the gene annotation records. In particular most of the search terms in these lists appeared within the annotations tags <Statement>, <Comments> or <MatchedDiseaseTerm>. The overlap between the three gene lists is shown in the Venn diagram below.
Fig. 3.1 Venn diagram of the three gene lists obtained from the Cancer Gene Database of the National Cancer Institute (NCI). Numbers correspond to gene symbols in the different set regions.
We selected for specific analysis subsets of genes differential in our experiments and with a match in at least one of the three lists List1, List2 or List3.
986 584 514 437
List1
List2
List3
210 295 22830
3.8 Plating Efficiency Assay
One thousand cells were seeded at clonal density on a 35 mm Ø dish in complete medium. After 10 days from seeding, cells were fixed for 1 hour with a solution of 2% methilene blue in 96% ethanol. Dishes were then accurately washed with double distilled H2O and colonies were counted.
The number of colonies formed was expressed as percent of colonies with respect of cells seeded. A total of three independent experiments were performed.
3.9 In vitro Cell Migration Assay
The assay was performed in Boyden chambers. Cells (8 x 10⁵ cells/800 µl) were added to the upper chamber in complete medium without FBS. The lower compartment was filled with 200 µl of complete medium containing 10% FBS, or with medium supplemented with 0.1% bovine serum albumin (BSA) to evaluate random migration (negative control). The compartments were separated by an 8-mm pore size polycarbonate filter (Costar Corp., Cambridge, MA), coated with gelatin (5 µg/ml; Sigma, Milan, Italy) for chemotaxis. After incubation for 6 hours in a humidified 5% CO2 atmosphere at 37°C, cells on the upper side of the filter were removed mechanically and
cells that had migrated to the lower surface of the filter were fixed in ethanol and stained with crystal violet solution (2% crystal violet, 10% ethanol) for 30 min. Cells were washed twice with distilled water, 200 µL of a 10% acetic acid solution was added, and cells were incubated at room temperature for 1 hour. Absorbance was measured at 570 nm. Each migration was tested in quintuplicate and experiments were repeated at least three times.
3.10 Zymography of Gelatinolytic Activity
Subconfluent cells were incubated for 24 hours in complete medium containing 1% FBS. Supernatants were collected and centrifuged (2000 g, 10 min, 4°C) to remove cellular debris. The conditioned media (CM) of cells were concentrated with Centricon-30 concentrators (Amicon, Danvers, MA). Each sample derived from 4x10³ cells was applied to SDS-PAGE on a 10% polyacrylamide gel with 0.2% (w/v) gelatin. Gel electrophoresis was performed under non-reducing conditions without boiling. The gel was rinsed twice for 30 minutes in 2.5% (v/v) Triton X-100 to remove SDS and renature the proteins and incubated with activation buffer (50 mM Tris-HCl pH 7.6; 5 mM CaCl2;1 µM ZnCl2; 1% Triton X-100) overnight at 37°C with constant shaking. The gel
31
was stained with 0.1% (w/v) Coomassie Brilliant Blue R-250 in 50% (v/v) methanol and 10% (v/v) acetate and then destained in 10% (v/v) methanol and 10% (v/v) acetate. Enzymatic activity was detected as a white band on the resulting blue background of undigested gelatin.
3.11 P-Glycoprotein immunostaining
Cells (106/sample) were washed in Washing Buffer (WB, PBS; 10 mM NaN3; EDTA 0.002%) and purified anti-P-Glycoprotein mouse (4E3.16, Calbiochem) or control IgG, diluted in complete medium at 12.5 μg/mL, were added to samples and incubated for 1 hour on ice. Cells were washed twice with WB and incubated in WB containing goat anti-mouse RPE (Southern Biotec Associates) for 40 min. After washing twice in WB, cells were resuspended in 300 μl of PBS for flow cytometric analysis. Ten thousand events per sample were acquired by using a FACScan cytofluorimeter.
3.12 Calcein/AM Retention Assay
Cells (5x10⁵/sample) were suspended in 1 mL of complete medium and incubated with or
without Verapamil (5 µM, Sigma–Aldrich USA) for 30 min at 37 oC. Then cells were washed two
times in PBS containing 0.2% BSA to eliminate Verapamil retained in cells. Washed cells were suspended into the same medium and incubated with Calcein/AM (100 nM, Sigma–Aldrich USA) for 20 min at 37 oC. Finally, cells were washed twice in PBS containing 0.2% BSA, cooled to 4 oC and analysed by FACS. Twenty thousand events per sample were acquired by using a FACScan cytofluorimeter.
32
4 RESULTS
4.1 Silencing of LMNA gene inhibits RA-induced differentiation in SHSY5Y
cell line
To investigate whether Lamin A/C could play a role in neuroblastoma differentiation, the SHSY5Y and LAN-5 neuroblastoma cell lines, showing different expression levels of Lamin A/C, were induced to differentiate for 3, 5 and 7 days in response to 10 µM RA. SHSY5Y cells increased the expression of Lamin A/C upon induction with RA as evaluated at protein and mRNA level. Conversely, LAN-5 cells showed barely detectable expression levels of Lamin A/C protein and of
LMNA mRNA, with no variation during the induced differentiation (Figure 4.1 A and B).
Fig. 4.1 Increased Lamin A/C expression during RA-induced differentiation in SHSY5Y cell line. A) Levels of
Lamin A/C protein in the SHSY5Y and LAN-5 neuroblastoma cell lines untreated or after 10 µM RA treatment for 3, 5 and 7 days (d) as detected by Western blot analysis using anti-Lamin A/C N18 polyclonal antibody. Each lane was loaded with 30 µg of proteins from cell lysate. GAPDH was used as a loading control. The experiment was repeated three times showing similar results. Representative blots are presented. B) Quantitative RT-PCR analysis of LMNA mRNA levels in SHSY5Y (white) and LAN-5 (black) cells untreated or after 10 µM RA treatment for 3, 5 and 7 days. The amounts of LMNA mRNA were normalized to GAPDH housekeeping gene. Data are reported as mRNA quantification relative to SHSY5Y untreated cells and are average of three separate experiments. Bars represent standard deviation. NT, untreated cells.