IOP Conference Series: Materials Science and Engineering
PAPER • OPEN ACCESS
Infrared spectroscopy analysis of montmorillonite thermal effects
To cite this article: M T Caccamo et al 2020 IOP Conf. Ser.: Mater. Sci. Eng. 777 012002
View the article online for updates and enhancements.
Functional Materials for Cultural Heritage (Fun4Heritage)
IOP Conf. Series: Materials Science and Engineering 777 (2020) 012002
IOP Publishing doi:10.1088/1757-899X/777/1/012002
Infrared spectroscopy analysis of montmorillonite thermal
effects
M T Caccamo1*, G Sabatino1,A Bennardo1 and S Magazù1,2
1 Department of Mathematical and Informatics Sciences, Physical Sciences and Earth Sciences, Messina University, Viale Ferdinando Stagno D' Alcontres 31, 98166 Messina, Italy
2 Istituto Nazionale di Alta Matematica “F. Severi” (INDAM), Gruppo Nazionale di Fisica Matematica (GNFM), Città Universitaria, Pl. Aldo Moro 2 - 00185 Roma, Italy
*E-mail: [email protected]
Abstract. The present work reports the analysis of the intramolecular OH stretching band obtained by Infrared spectroscopy measurements. In order to characterize the effect of montmorillonite on the properties of Lysozyme the so-called two-state model is adopted for the analysis of the intramolecular OH stretching band. This latter assumes that the OH stretching can be partitioned into two different states of intermolecular bonding. Such a result confirms that the montmorillonite leads to a stabilization of the Lysozyme structure. Moreover, the analysis of the spectra temperature dependence shows a montmorillonite-induced higher thermal restraint of the Lysozyme in respect to pure Lysozyme.
1. Introduction
In this work samples of montmorillonite [(Na,Ca)0,3(Al,Mg)2Si4O10(OH)2•n(H2O)] and its mixture with Lysozyme were investigated as a function of temperature by means of Infrared spectroscopy technique.
The mineral montmorillonite, whose name derives from the town of Montmorillon, department of Vienne in France, is an Aluminium and Magnesium phyllosilicate [1-4].
Its crystalline structure is due to the overlapping, along to the C axis, of different small layers of pyrophyllite, among which are interposed one or more layers of water molecules, coordinated by a Sodium ion; this represents the so-called interchangeable ion, that can be easily substituted. Moreover, the distance between the reticular levels depends on the hydration level of the mineral; by increasing the number of water layers, the crystalline reticula expand according to the C axis, while for the complete dehydration it loses its attitude to expand.
In Nature it is possible to find this mineral in the form of very thin scales that often come together in microcrystalline masses, greasy to the touch, friable and with a remarkable absorbing power. Among the chemical-physical characteristics [5-7] one can mention:
Functional Materials for Cultural Heritage (Fun4Heritage)
IOP Conf. Series: Materials Science and Engineering 777 (2020) 012002
IOP Publishing doi:10.1088/1757-899X/777/1/012002
2
As far as the applicative point of view is concerned, Table 1 shows some industrial fields of application and the reasons why montmorillonite is nowadays of fundamental importance for the preparation of different products.
Table 1. Some industrial applications of montmorillonite. Montmorillonite industry applications
For removing toxins from cooking oil, due to its adsorbing and cation exchange properties For purification of petrol and kerosene
For Waste-water treatment
For drilling mud, fireproof (suspended fire) due to the swelling properties of water As a filler in the paper industry
Thanks to its good adhesion, it can be used instead of starch In animal bedding, because it can absorb urine and faecal substances
In the ceramic sector where it is used as a plasticizer For feed production
For paints production For waterproof land in agriculture
In order to determine the thermal protective effects of montmorillonite on a fragile system of biophysical interest, a protein, i.e. the Lysozyme was chosen; this latter is an enzyme of 14,4 kilodaltons present in animal tissue and equipped with bactericidal activity; as such it can damage the bacterial cell wall of some bacteria (Gram +) catalyzing the hydrolysis of beta linkages 1,4 between N-acetylmuramic acid (NAM) and N-acetylglucosamine (NAG) which are the main component of peptidoglycan [8-11]. Its structure is constituted by two domains: one made by alpha-helix, the other one made by one beta antiparallel layer and by two alpha-helix [12-15]. The tridimensional configuration of the molecule is maintained by the presence of 3 disulfide, two located in the alpha-helix domain and one in the beta layer one, and in its internal part there are few polar residues [16-19]. 2. Spectroscopic techniques
As far as the employed technique is concerned, that is infrared spectroscopy, it is a powerful tool to investigate the structural and dynamical properties of material systems as well as their dependence on temperature. The technique is based on the analysis of the absorption spectra [20-23]. In this work, we collected vibrational spectra by means of the Vertex 70v spectrometer (Bruker) using a Platinum diamond ATR [24-28]. All spectra were collected by using an average of 96 scans with a resolution of 4 cm-1 in a spectral range of 400÷4000 cm-1, from a temperature of 25°C to a temperature of 60°C. The data were first processed through Bruker OPUS software and then by means of Matlab.
3. Spectral Distance
To characterize the temperature sensitivity of the investigated samples, the Spectral Distance approach has been employed; this latter is essentially based on the following equation:
𝑆𝐷 = √∑[𝐼(𝜔, 𝑇) − 𝐼(𝜔, 𝑇𝑖)]2∙ Δ𝜔 𝑣
Functional Materials for Cultural Heritage (Fun4Heritage)
IOP Conf. Series: Materials Science and Engineering 777 (2020) 012002
IOP Publishing doi:10.1088/1757-899X/777/1/012002
where 𝐼(𝜔) denotes the absorbance at the frequency 𝜔, 𝑇𝑖 is the lowest temperature, that in this case
is equal to 25°C and Δ𝜔 represents the frequency resolution of the instrument. 4. Discussion and Results
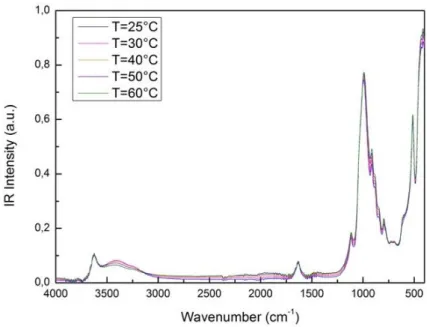
Figure 1 reports FTIR spectra of montmorillonite in the 400<< 4000cm-1 and in the temperature window from 25°C to 60°C.
Figure 1. IR absorption intensity as a function of wavevector of montmorillonite, in the 400<< 4000cm-1 from 25°C to 60°C. Figure 2 reports FTIR spectra of Lysozyme in the 400<< 4000cm-1 from 25°C to 60°C.
Functional Materials for Cultural Heritage (Fun4Heritage)
IOP Conf. Series: Materials Science and Engineering 777 (2020) 012002
IOP Publishing doi:10.1088/1757-899X/777/1/012002
4
Finally, in Figure 3, FTIR spectra of montmorillonite in the presence of Lysozyme in the spectral range of 400-4000cm-1 from 25°C to 60°C is reported.
Figure 3. IR absorption intensity as a function of wavevector of montmorillonite in presence of Lysozyme in the 400<< 4000cm-1 from 25°C to 60°C.
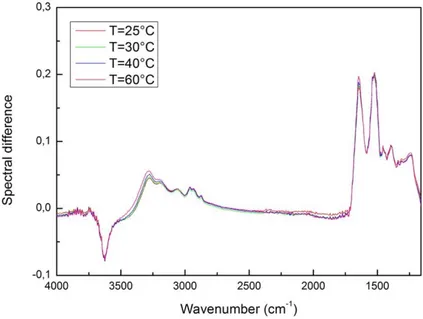
Concerning the spectra analysis, at first, a pre-processing data to eliminate the background has been performed. Then, in order to characterize the interaction mechanisms among montmorillonite and Lysozyme, the spectrum of montmorillonite has been subtracted from the spectrum of montmorillonite in presence of Lysozyme, so obtaining a new spectrum, i.e. the spectrum difference [29-33]. Such a procedure was performed for all the spectra at each investigated temperature. Figure 4 reports, as an example, the spectral difference for T=25°C, 30°C,40°C and 60°C.
Functional Materials for Cultural Heritage (Fun4Heritage)
IOP Conf. Series: Materials Science and Engineering 777 (2020) 012002
IOP Publishing doi:10.1088/1757-899X/777/1/012002
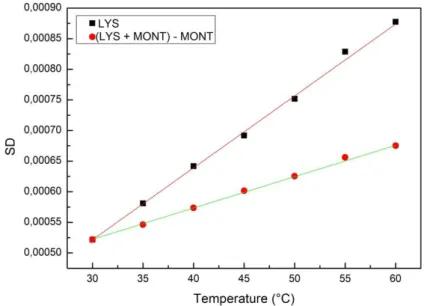
To compare spectra, the Spectral Distance (equation1) has been evaluated. In Figure 5, the plot of the SD versus temperature is reported both for the spectrum differences (red points) and for spectra of Lysozyme (black squares).
Figure 5. Spectral Distance (SD) versus temperature both for spectra difference (red points) and for spectra of Lysozyme (black squares).
As it can see, data arrange themselves along a linear behaviour, for both the investigated samples. To extract quantitative information, a linear fit has been performed:
𝑦 = 𝑚𝑥 + 𝑞 (2)
From this analysis, it emerges that the slope coefficient of the two systems is different; in particular, the slope value of Lysozyme in the presence of montmorillonite, 𝑚 = 5.12 ∙ 10−6, results smaller than the slope coefficient of Lysozyme, that is 𝑚 = 1.09 ∙ 10−5. Figure 5 also reports the linear fit of the two investigated systems. This result reveals that the Lysozyme in presence of montmorillonite has a smaller sensibility to temperature changes. Therefore, montmorillonite can be considered as an effective thermal bioprotector.
5. Conclusions
The present work has allowed to put into evidence the importance of clay systems as bioprotectors. A spectroscopic investigation was carried out by infrared spectroscopy on the interaction of montmorillonite with Lysozyme. It emerged that IR spectroscopy and the SD approach constitute a very effective approach for the characterization of the thermal properties of pure Lysozyme and of Lysozyme in the presence of montmorillonite. The results allowed us to see how Lysozyme in the presence of montmorillonite has a lower spectral sensitivity when the temperature changes and, hence, the role of montmorillonite as a bioprotector is thus justified.
Acknowledgments
Functional Materials for Cultural Heritage (Fun4Heritage)
IOP Conf. Series: Materials Science and Engineering 777 (2020) 012002
IOP Publishing doi:10.1088/1757-899X/777/1/012002
6
[2] Andronescu C, Alexandra Gârea S, Deleanu C, Nicolescu A and Iovu H 2013 Appl. Clay Sci. 86 99
[3] Chen Q, Zhu R, Ma L, Zhou Q and He H 2017 Appl. Clay Sci. 135 129
[4] Fan M, Yuan P, Zhu J, Chen T, Liu D 2009 Journal of Magnetism and Magnetic Materials 321 3515
[5] Tunç S and Duman O, 2010 Appl. Clay Sci. 48 414
[6] Hosseini M G, Jafari M and Najjar R 2011 Surf. Coat. Tech. 206 280
[7] Komatsu L G H, Oliani W L, Lugao A B and Parra D F 2014 Radiat. Phys. Chem. 97, 233 [8] Barreca D, Laganà G, Magazù S, Migliardo F, Gattuso G and Bellocco E 2014 Int. J. Biol.
Macromol. 63 225
[9] Öztürk N, Şenay R H, Avcıbaşı N, Akgöl S and Denizli A 2012 Process Biochem. 47 816 [10] Magazù S, Migliardo F, Barreca D, Bellocco E and Laganà G 2008 Physica B 403 2408 [11] Dembczynski R, Bialas W and Jankowski T 2010 Biochem. Eng. J. 51 24
[12] Fenimore P W, Frauenfelder H, Magazù S, McMahon B H, Mezei F, Migliardo F, Young R D and Stroe I 2013 Chem. Phys. 424 2
[13] Zhang Y, Wang Z, Zhang J, Chen C and Zhang X 2011 Carb. Polym., 85 554 [14] Magazù S, Migliardo F, Benedetto A and Vertessy B 2013 Chem. Phys. 424 26
[15] Yakup Arıca M, Yılmaz M, Yalçın E and Bayramoğlu G 2004 J. Chromatogr. B 805 315 [16] Magazù S, Migliardo F, Benedetto A, Mondelli C and Gonzalez M A 2011 J Non-Cryst. Solids
357 664
[17] Merlini G and Bellotti V 2005 Clin. Chim. Acta 357 168
[18] Ibáñez R, Almécija M C, Guadix A, Guadix E M 2007 Sep Purif Technol 57 314 [19] Caccamo M T and Magazù S 2019 AAPP S1A2
[20] Caccamo M T and Magazù S 2017 Appl. Spectr. 71 401 [21] Mäder K 2005 Adv. Drug Deliver Rev. 57 1083
[22] Caccamo M T and Magazù S 2017 Spectr. Letters, 50 130
[23] Pereira A C, Prioli L M, da Silva W J, de O. Neto G and Alvarado-Gil J J Plant Science 96 203 [24] Liu K, George S C, Lu X, Gong S and Gui L 2014 Org. Geochem. 72 34
[25] Gonzàlez-Jimènez J 1994 Chem.Biol. Inter. 91 65 [26] Casoli A and Fornaciari S 2014 Microchem. J. 116 24 [27] Bugay D E 2001 Adv. Drug Deliver Rev 48 43
[28] Arnosti C, Keith S C and Blough N 2000 Marine Chem. 71 321 [29] Migliardo F, Caccamo M T and Magazù S 2014 Food Biophys 9 99 [30] Caccamo M T and Magazù S 2016 Vib. Spectr. 85 222
[31] Caccamo M T and Magazù S 2017 Polym. Testing 62 311
[32] Caccamo M T, Zammuto V, Gugliandolo C, Madeleine-Perdrillat C, Spanò A and Magazù S 2018 Int. J. Biol. Macromol. 114 649