ALMA MATER STUDIORUM - UNIVERSITÀ DI BOLOGNA CAMPUS DI CESENA
DIPARTIMENTO DI
INGEGNERIA DELL’ENERGIA ELETTRICA E DELL’INFORMAZIONE “GUGLIELMO MARCONI”
CORSO DI LAUREA MAGISTRALE IN INGEGNERIA BIOMEDICA
TITOLO DELLA TESI
KNEE MONITOR: MOTION AND PHYSICAL ACTIVITY MONITORING IN DAILY LIFE USING A NOVEL DUAL SENSOR WEARABLE
Tesi in
BIOINGEGNERIA DELLA RIABILITAZIONE
Relatore Presentata da Ch.mo Prof. Lorenzo Chiari Daniele Testa
Matr. 0000852598
INDEX
1 Introducion ... 5
1.1 Risks and Assessment of knee health in clinic ... 5
1.2 Gait analysis ... 7
1.3 State of art ... 9
1.4 Inertial Measurements Unit ... 11
1.5 IMUs’ problems ... 13
1.6 Quaternion ... 15
1.7 Our project ... 15
2 Methods ... 24
2.1 Home-made sensors ... 24
2.2 Algorithm and Computer App ... 27
2.3 Adaptation phase ... 32 2.4 Validation ... 35 2.4.1 Plausability tests ... 35 2.4.2 Motion Tests ... 36 2.4.3 Position of sensors ... 40 2.4.4 Motion laboratory ... 41
2.5 Comparison and statistical analyses performed ... 41
2.6 Usability ... 41
3 Results ... 44
3.1 Results of plausibility test ... 44
3.2 Results of motion tests ... 46
3.2.1 Squatting and walking ... 47
3.2.2 Sit-to-stand-to-sit transitions ... 58
3.4 Results statistical analyses ... 67
3.5 Results usability test ... 69
4 Discussion ... 71
4.1 Plausibility test ... 71
4.2 Motion test ... 72
4.2.1 Qualitative features ... 72
4.2.2 Quantitative features ... 73
4.2.3 Inner calibration features ... 74
4.2.1 Statistical features ... 75
4.3 Limitations ... 75
4.4 Possible solutions to our problem and future works ... 78
4.5 Discussion about usability ... 81
5 Conclusions ... 83
6 Appendix ... 84
6.1 Quaternion theory ... 84
6.1 Results of other motion tests ... 88
INTRODUCTION
1.1 Risks and Assessment of knee health in clinic
It is well known in the scientific literature that a good level of movement has a positive impact on our overall health. Physical activity (PA) can be used as a parameter for the diagnosis, treatment or evaluation of the results of correct health care. Moreover, in orthopaedics, physical activity is a fundamental parameter in the analysis as the movement apparatus is directly affected [1]. A very important concept in human motion analysis is
that of functional mobility. Functional mobility means the ability to walk safely in a free-living environment. This translates into the ability to walk, run, climb, even when handling support devices such as walkers, crutches and sticks [2] [3] [4]. Unfortunately, a large number of illnesses and/or accidents can compromise an individual’s level of mobility and especially the gait function. In general, gait pathologies can be classified into four major categories: rehabilitation-related gait patterns, neurological gait disorders, psychiatric gait abnormalities, and gait degradation due to ageing. Of all these injuries, the musculoskeletal ones and chronic conditions are prevalent [5] [6] [7].
In this thesis elaboration, we will concentrate our discussion on a fundamental joint for human locomotion, the knee. The most frequent problems affecting this joint are:
• Osteoarthritis (OA), is a type of joint disease caused by a progressive deterioration of joint cartilage and underlying
bone. The most affected body areas are hands (at the ends of the fingers and thumbs), neck, lower back, knees, and hips as shown in Figure 1.1. Often occurs in subjects between 40 and 50 years of age. Bolik et al. [8] reported that the OA disables approximately 10% of persons over the age of 60 years. For end stage knee OA, total knee replacement (TKR) has developed into a successful treatment option and it is one of the most performed elective surgical procedures nowadays. However the high impact on quality life of the disease is well documented [9] [10];
• Knee injuries, like anterior cruciate ligament (ACL) and/or meniscus rupture [11] [12];
Figure 1.1 Osteoarthritis most often occurs in the hands (at the ends of the fingers and thumbs), neck, lower back, knees, and hips.
All these types of injury can have different levels of severity based on several factors like subject’s age, his/her clinical history, weight, etc. but all of them introduce, in the patient’s life, a certain grade of disability for a period of time. Vargas-Valencia et al. [4] reported that about 15% of the world’s population live with some disability condition, of which 2%–4% suffer significant functional problems [13]. In this scenario, clinicians and physiotherapists’ aim is to reduce the number of patients, or at least to improve their living conditions, through neuromuscular rehabilitation. An efficient rehabilitation program, in fact, can improve subjects’ mobility, especially after lower limbs surgery. In the first 2-3 weeks after the intervention, the patient has to regain the gait function and to restore the range of motion (RoM) of the articulation (i.e. differences between maximum knee angle and the minimum knee angle) at pre-surgery levels, in order to avoid mobility problems in the future [14]. Clinicians can determine the patient's level of autonomy and the optimal care he should receive based on assessments of functional activities, such as walking. [15]. ]. Therefore, it is essential to improve diagnosis, treatments and measure patient evolution, to understand and systematically characterize movement disorders [4]. For the diagnosis and management of knee health (e.g., following an acute knee injury during rehabilitation), it is now a standard procedure to use is a combination of physical exams and medical imaging, where imaging provides information limited for rehabilitation planning (e.g. duration of therapeutic interventions), the management of which is usually based on repeated physical examinations focused on subjective measures of pain, RoM, edema, and rattle during the execution of examination maneuvers (for example front drawer test, pivot test, etc.) [16]. More in general, in clinical practice there are some subjective tools like patient reported outcome measures (PROMs), clinician-administered scales (CAS), and also by performance tests such as the Timed Up-and-Go (TUG) [17], or the 6-Minute Walk test (6MWT) [18]. These tests have positive predictive values below 20% [19]. during the rehabilitation period, the medical team and the patient rely mainly on subjective analysis, on the symptoms reported by the patient and on the levels of functional activity of daily life, to best calibrate the treatment regimen to be adopted. These variations are unique and exclusive for each clinical case analysed. This necessitates the creation/adoption of a more sensitive and objective method to monitor the rehabilitation process after joint injuries [16] and, most in general, for knee monitoring. In response to this need to objectively judge patients' performance the motion analysis is extensively used for the quantitative and qualitative assessment of motor function in basic research as well as clinical and sport applications. The estimation of joint angular displacements is a fundamental part of human motion analysis and involves the detection of joint position and spatial orientation [20]. As reported by Vargas et al. in [4] :“The
relevance of these parameters is observed in many clinical scenarios such as gait training after surgery and rehabilitation in patients with stroke, Parkinson’s disease and cerebral palsy [21] [22] [23]”.
1.2 Gait analysis
The health status of a subject’s musculoskeletal apparatus can be evaluated by extracting from the gait some parameters that allow certifying the level of mobility and/or which a certain pathology affects the mobility of the subject. The gait is one of the most natural action for the human being but, at same time, one of the most complex one to analyze under the clinical/engineeristic aspects. During the gait many muscles, in different areas of the body and with specific aims, are involved: some muscles avoid the pure movement (for example the muscles of leg), meanwhile others promote the balance and the rhythmicity of the gait (for example the oscillatory movement of the arms). Since is not possible to quantify the contribute of the single muscle or body segment to the general gait, for the clinical and engineeristic analysis of the gait, the necessary information is extracted by global data (speed, moments, accelerations, displacements, etc). This data can be global or belonging to a specific body segment (i.e. a joint, upper limbs, lower limbs, etc). Each of these parameters, known as “gait measures”, describe a particular aspect of subject’s gait. There are a lot of gait measures and they do not necessarily all need to be used when doing gait analysis, it depends by on each case. In the article [7] a table with the most general parameters available in gait analyses in literature are reported.
Table 1. Quantifiable gait measures for clinical use [7]
Quantifiable Gait Measures Gait Disorders
Gait speed Slow walking
Step length Parkinson gait, small
steps, gait with little steps
Step frequency (cadence) Slow walking, gait
efficiency
Stride-stride variability Abnormal rhythm of
Step width Cerebellar gait (ataxic gait), wide base, extremely narrow base
Step height, in the sense of vertical displacement of the center of mass
Peripheral neuropathic gait, foot drop, high stepping gait
Transverse plane signal amplitude Hemiplegic gait, diplegic gait,
circumduction, scissor gait
Knee joint angle Crouch gait, drop foot,
equine gait, stiff knee
Ankle joint angle Equine gait, crouch gait
Number of steps during turning Difficulty with turning
Hip flexion Myopathic gait,
waddling gait, excessive hip sway, drop of pelvis Heel-strike amplitude, ground reaction
forces
Sensory gait, stomping, stamping
Motion signal distribution Tremor
Stance time Antalgic gait, hesitation
Swing time Difficulty in clearing off
at toe off, difficulty in swinging
Double support time Steadiness
Bilateral sensor comparison Gait asymmetry
Gait stability measure Wobbly gait, unstable
gait
Gait complexity measure Choreiform gait,
hyperkinetic gait, jerky gait
Gait regularity measure Reduced gait variability
Moment Weakness during toe off
Muscle force from EMG Muscle weakness,
abnormal muscle activity
1.3 State of art
Other parameters very used in the gait analysis are the maximal knee flection, the maximal knee extension and tibial acceleration. In the field of motion analysis the gold standard is represented by the three-dimensional (3D) optical motion capture systems, such as the VICON (Oxford Metrics Limited, Oxford, United Kingdom) shown in figure 1.2 [24].
Figure 1.2 A typical set-up for gait analyses with optical motion capture system [25]
With infrared cameras capturing body motion defined by the reflective markers, these systems track spatial information and human motion, and provide high-precision data at a sampling rate of 100–200 Hz. Although such systems can deliver highly accurate human movement analysis, they are relatively expensive and require expert operation [26]. It means that only some specialized centers and clinics have adopted this standard gait analysis tool. Usually, these systems are used in combination with force plates (like in Figure 1.2) and
electromyography (EMG) systems, that are two other quantitative gait analysis tools commonly used in those specialized centers. Force plates measure ground reaction forces (GRFs) during walking, and when synchronized with kinematic information recorded by optical motion capture systems, can provide kinetic information based on inverse dynamics.
Figure 1.3 Surface electrodes for EMG Figure 1.4 Force plates
EMG systems measures the electrical activity (i.e., whether the muscle is at rest or firing at a certain time) of a contracting muscle via either surface electrodes or fine wire electrodes. The surface electrodes are attached to the skin, though such a setup is subject to noise from the near by muscles. The more accurate and precise measurement approach is to insert fine wire electrodes into the muscle using a hypodermic needle, but it is highly invasive and can even be painful.
Either approach can only give information about whether and when the muscle is firing, but not quantitative information such as muscle forces or the amplitude of the muscle activity. However, with mathematical modelling, muscle forces can also be extracted from EMG signals [27]. EMG measurements can be critical to clinical gait assessment. Gage et al. [28] used EMG data to guide surgery for children with cerebral palsy, during which a muscle tendon may be transferred to a different location in order to correct the action of the muscle. For such surgery, EMG must be used in advance, so muscular contraction is corrected accordingly. EMG can also be used with neuroconduction studies to test peripheral neuropathy. During such tests, the EMG electrodes release an electric shock in order to stimulate the nerves of the subject, and the speed of the signals of the nerve response (i.e., nerve conduction speed) is measured. A significant delay and weakness in the response signals indicates peripheral neuropathy [29].
1.4 Inertial Measurements Unit
It is essential to replace the current gait analysis systems that provide kinematic information and EMGs, with easier to use, more economical, and portable platforms. For more than twenty years, scientific research in this field has moved towards the development and validation of a new class of wearable devices. The result was a new technology, well-known as Micro Electro
Mechanical Systems (MEMS), that in its most general form can be defined as miniaturized
mechanical and electro-mechanical elements (i.e., devices and structures) that are made using the techniques of microfabrication [30]. MEMS sensors are usually low-cost, small in size, and can be manufactured into a wrist watch size [31], which is suitable for the data collection of wearable devices. This technology was used to build, on the same integrated circuits a multi-axial combination of accelerometers, gyroscopes and eventually magnetometers that are widely available and used for orthopaedic outcome assessment [32]. This new class of wearable sensors are the Inertial Measurements Units (IMU), commonly referred to as IMUs or inertial sensors. In contrast to camera-based laboratory systems for measuring joint angles, wearable sensors present advantages of lower cost, higher flexibility, portability and adaptability [14], [33]. These sensors are which can be attached to different body segments to estimate joint kinematics. Using the inertial/magnetic measurement technique, several advantages can be achieved. The two main advantages are:
1. Missing of intrinsic latency (all delays are attributed to data transmission), making it the measurement technique suitable for real-time measurements
2. In contrast with electromagnetic, acoustic and optical devices, that require a source of emissions to be able to trace objects, IMUs can be used on the object/subject without any kind of self-emission source [34] [35] .
Considering their usability in indoor and outdoor environments, in addition to a reduced dressing time, these sensors represent a technology, becoming an alternative to high-cost optical systems [4] [36] [37] [38] [39] [40] .
Among the quantifiable gait measures above mentioned in Table I, one of the most important is the knee joint angle. The RoM of this joint is a functional parameter related to the outcome along the rehabilitation path and the level of mobility of both a patient undergoing surgery and a healthy subject. In fact, restricted RoM of the lower limb joints hinders the performance of activities of daily living (ADL) [41] such as walking, standing up, and climbing stairs. [42], [43], [44] Patients may also have difficulty with activities such as dressing, using the toilet, bathing, picking up objects, crouching, tying shoelaces, and clipping toenails. [42], [43], [45],
[46]. Other important parameters, linked to RoM, are max knee extension and max knee flexion. In literature, there are many different approaches to calculating this parameter that differ to use accelerometers, gyros and magnetometers individually or combined. We have provided some interesting examples below that could, shortly, be used in clinical evaluations:
1. The “DynaPort Knee Test” (DPKT) produces mobility parameters during predetermined activities using accelerometers (e.g. walking, sit-stand), which are correlated with knee function, and evaluates execution quality based on an ordinal scale [47].
2. Eric Allseits et al. [48] have developed a novel gyroscope only (GO) algorithm which calculates knee angle from integration of a gyroscope derived knee angular velocity (KAV) signal. As explained in [49], the main characteristics of this algorithm is “To eliminate drift in the integral of angular velocity, a zero-angle update (ZAU) derived from a characteristic point in the knee angular velocity is applied to every stride. This point is identified using gait phase knowledge provided by a previously published noise-zero crossing (NZC) gait phase algorithm”.
3. The system KINEMATICWEAR – developed by M. Schulze et al. [50] in close collaboration of computer scientists and physicians performing knee arthroplasty - consists of two sensor nodes with combined tri-axial accelerometer, gyroscope and magnetometer to be worn under normal trousers.
In many applications described in the literature, 3 or more sensors are used that are not necessarily IMU but are often miniature accelerometers or gyroscopes made using MEMS technology. Even when the IMUs are used, however, the information is extracted from one of the devices and the data of the other two are used for corrections or for obtaining outline information. Using only the accelerometer or gyroscope has the advantage of easily understanding the output data, but also the following disadvantages: the accelerometers data are sensitive to placement variability and can contain significant amounts of Gaussian noise and gait cycle-dependent noise from vibratory modes, while with gyroscopes data are affected by drift problem and by gimbal lock problem. The gimbal lock problem can be described as the loss of information by one plane of gyroscope. This happens when, during movement, two rotating axes align towards the same direction and the gyroscope lose one degree of freedom. Magnetometers are often used to derive the orientation respect to the Earth's magnetic field and therefore allow to establish the position in a global three-dimensional reference system if there is not the presence of electromagnetic source that can alter the measurements. This topic has
evolved into a wide and solid field of research, but clinical applications involving the use of IMUs are still largely unexplored in the literature, despite many research groups have spent resources and efforts to introduce, over the years, a lot of different approaches and algorithms based on the use of IMUs. Although there are a few commercial offerings such as GaitUp (Renens, Switzerland), Dynaport (Den Haag, Netherlands), Xsens (Enschede, Netherlands), Delsys (Natick, MA) and Shimmer (Dublin, Ireland) also offer proprietary software algorithms for motion analysis or activity monitoring the most published studies in orthopedic have used self-developed algorithms.
1.5 IMUs’ problems
Recently, a systematic review [51] was done to compare the performance of 17 algorithms present in scientific literature based on influence of sensor position, analysed variable and computational approach in gait timing estimation. The authors’ conclusions at the end of this review was that no proposed algorithm can be, generally, preferred over the others.
The lack of supremacy by an algorithm, type of sensor or approach has two reasons:
1. Only a few manufacturing companies produce sensitive units for data collection (for example Bosch, Invensene, STM). This means that few manufacturers supply almost all manufacturers of hardware devices for IMUs. The consequence of this market condition is the low variability between features of a lot of different devices, like for example basic sensor resolutions, ranges and accuracies. Generally, they differentiate themselves in:
• design (shape, size, weight influencing patient compliance, skin movement artefact
• functionality (for example control switches and LED, battery life, charging, configuration options, data output format)
• connectivity (cable, wireless)
• data pre-processing which can produce derived parameters or use sensor fusion in combination with e.g. Kalman filters to increase accuracy [52].
2. No standardized guidelines both for placing sensors on body segments and defining joint coordinate systems (JCS) are defined. Also, there are some studies that questioned the accuracy of these systems [53] [54] [55] [56] [57]. The conclusions were that the
calibration stages of the individual sensors (i.e., accelerometer, gyroscope, and magnetometer), biases, sensibilities and different noise types, in addition to sensor fusion algorithm issues, influence significantly the accuracy of the orientation estimation.
Against this background, a fundamental problem of the IMU-based gait analysis is to how define an appropriate measurement protocol and to draw up a common protocol for the placing of the sensors on the body segments [58]. Different research teams have presented in the literature different methods to determine the sensor frame’s orientation, after they have been applied to the human body [29-31] [59]. However, those approaches suffer from some limitations linked to which sensor is mostly used. For example, with algorithms based only on data from accelerometers and gyroscopes [27] [29] [60] [61] the difficulty is to measure 3D angles directly and, to solve this problem, a second global reference axis is necessary. This second global reference system is usually along with the gravity vector. Another important problem within systems that involve only accelerometers and gyroscopes is the heading drift. The approaches presented in literature to overcome this issue and to correctly define the axis of joint motion are:
• the performing of predefined movements by the subject [27]
• use supplementary devices such as cameras [41], anatomical landmark pointers [28] or exoskeleton harnesses [29]
• performing complex movements while keeping some specific postures [29, 30, 39] • maintaining the same orientation or joint angle between two postures [11, 41]
However, these approaches are not optimal because they need additional tools, experienced personnel and they increase the experiment duration, without considering that may not be applicable to subjects with motor disabilities. Some solutions to easily align the sensors to the body segments are proposed [62] [63] but none are incorporated into a standardized clinical procedure.
A possible solution to the problems of alignment and positioning into a 3D space seems to be the use of quaternions in the analysis of movement.
1.6 Quaternion
The quaternion is a mathematical entity discovered by William Rowan Hamilton in 1843. Recently it has become widely used in fields like 3D graphics, virtual reality, robotics, theorical physic and human motion because they particularly indicated for the calculate or the simulation of movements.
A more complete discussion, with all mathematical definitions and proprieties about this topic, is reported in the Appendices.
The quaternion is a complex number and it can describe the orientation and the rotation of a body in 3D space. Every rotation, in 3D space, can be defined as a combination of an axis and a rotation angle. The quaternion is a simpler way to represent it than rotation matrix but is less intuitive for the user.
In the article [64] , Lee JK and Jung WK presented a new quaternion-based local frame alignment method has been proposed, where the equations of angular velocity transformation are used to determine the frame alignment orientation in the form of quaternion. Although the IMU sensor was not attached to the body above a plastic ruler of the right triangle, the
alignment was almost perfect (an error less than 3° degrees), showing that with the use of this mathematical tool it is possible to overcome the alignment problem
1.7 Our project
Almost all the articles and papers in the literature aim to make parameter calculation methods more precise, trying to obtain the same results as the state-of-the-art tools but with wearable and less expensive technologies. All validation tests are performed in well-controlled environments that do not mimic the real conditions of daily human activities well, without considering the well-known fact that supervised patients in a laboratory environment strive to walk particularly well, thus presenting themselves with artificial gait patterns. To assess the real status of knee health, it would be necessary to matching motion laboratory measurements with continuous knee monitoring in real life. To our knowledge, several projects, in the scientific literature and the commercial field, has been developed to monitor the knee function outside the environment of motion laboratory, such for example [49] [64] [65] [65]. Although all these projects have achieved promising results (like a high correlation with motion capture system) and have interesting aspects (sensor placement, extraction of gait features,
applications to daily life), they use commercial sensors (some projects are commercial solutions covered by copyright) and algorithms based on gyroscope and accelerometer, incurring in the above-mentioned problems.
In order to overcome all the limitations linked to the acquisitions in a well-controlled
environmental, cover the clinical needs of biomechanical monitoring of knee motions in daily life and to provide simple solution for knee monitoring in real life conditions, a team research of the Luxembourg Institute of Health (LIH) is carrying on a project to develop, validate and apply a knee monitoring solution based on such wearable sensors. The candidate was
involved in the initial phase of this project and, in this master thesis work, the selected methodologies and the results obtained will be describe.
It is the aim of this phase of the project to:
1) make a low-cost (few tens of euros), self-assembled IMU/Arduino system operational to be used as a developmental dual-IMU activity monitoring platform (by e.g. software for connection, communication, configuration, etc.).
2) Write, adapt and develop further a pre-existing algorithm to calculate knee angles, primarily flexion angles based on the quaternion outputs.
3) Test and take steps towards validating the output of the sensor/algorithm set-up against a gold standard (3-D motion capture) for several activities relevant for patients with knee pathologies and outcomes.
References
[1] v. L. S. S. R. H. I. G. B. Lipperts M., «Clinical validation of a body-fixed 3D
accelerometer and algorithm for activity monitoring in orthopaedic patients,» Journal of
Orthopaedic transltion, vol. 29, pp. 11-19, 2017.
[2] B. . Belgen, M. Beninato, P. Sullivan e K. Narielwalla, « The association of balance capacity and falls self-efficacy with history of falling in community-dwelling people with chronic stroke.,» Arch. Phys. Med. Rehabil., vol. 87, n. 1, p. 554–561, 2006. [3] N. Chrysagis, E. Skordilis, G. Tsiganos e D. Koutsouki, «Validity evidence of the Lateral Step Up (LSU) test for adolescents with spastic cerebral palsy.,» Disabil.
Rehabil, vol. 35, n. 2, p. 875–880, 2013.
[4] E. A. R. E. B.-F. T. F. A. Vargas-Valencia LS, «An IMU-to-Body Alignment Method Applied to Human Gait Analysis.,» Sensors, vol. 12, p. 16, 2016.
[5] A. K. Woolf AD, «Understanding the burden of musculoskeletal conditions.,» BMJ, vol. 322, n. 3, p. 1079–1080, 2001.
[6] P. B. Woolf AD, «Burden of major musculoskeletal conditions,» Bull World Health
Organ, vol. 81, n. 4, p. 646–656, 2003.
[7] J. L. B. L. G.-Z. Y. Shanshan Chen, «Toward Pervasive Gait Analysis with Wearable Sensors: A Systematic Review,» IEEE JOURNAL OF BIOMEDICAL AND HEALTH
INFORMATICS, vol. 20, n. 5, p. 1521, 2016.
[8] S. Bolink e L. M. H. I. G. B. van Laarhoven SN, «Inertial sensor motion analysis of gait, sit-stand transfers and step-up transfers: differentiating knee patients from healthy controls.,» Physiological Measurement, vol. 33, n. 11, pp. 1947-58, 2012.
[9] S. M. v. d. A.-S. I. Z. W. a. G. J. W. Wagenmakers R, « Predictive value of the Western Ontario and McMaster universities osteoarthritis Index for the amount of physical activity after total hip arthroplasty,» Phys. Ther., vol. 88, n. 6., pp. 211-218, 2008.
[10] S. M. L. a. D. M. R. Stevens-Lapsley J E, «Comparison of self-reported knee injury and osteoarthritis outcome score to performance measures in patients after total knee
arthroplasty,» PM R, vol. 3, n. 7, pp. 541-549, 2011.
[11] G. D. M. [. a. C. E. Q. Timothy E. Hewett, «Mechanisms, Prediction, and Prevention of ACL Injuries: Cut Risk with Three Sharpened and Validated Tools.,» J Orthop Res., vol. 34(11), n. 8, pp. 1843-1855, 2016.
[12] W. F. B. A. W. R. R. S. Fox AJ, «The human meniscus: a review of anatomy, function, injury, and advances in treatment.,» Clin Anat., vol. 28(2), n. 9, pp. 269-287, 20154. [13] W. H. O. &. W. B. W. R. o. Disability.. [Online]. Available: http://www.who.
int/disabilities/world_report/2011/report/en). .
[14] G. Carter, «Rehabilitation Management in Neuromuscular Disease,» J. Neuro. Rehab., vol. 11, n. 2, pp. 69-80, 1997.
[15] K. Hashimoto, K. Higuchi, Y. Nakayama e M. Abo, «Ability for basic movement as an early predictor of functioning related to activities of daily living in stroke patients,»
Neurorehabil. Neural Repair, vol. 21, n. 12, pp. 353-357, 2007.
[16] W. D. T. C. H. S. P. M. M.-S. M. K. G. S. M. Inan OT, «Wearable knee health system employing novel physiological biomarkers.,» Journal of applied physiology, vol. 124, n. 3, pp. 537-547, 2018.
[17] d. e. o. A. A. K. r. greene Br, «Frailty status can be accurately assessed using inertial sensors and the TUG test,» Age Ageing, vol. 43, n. 13, pp. 406-411, 2014.
[18] h. r. h. m. t. C. r. e. B. K. dobson f, «Measurement properties of performance-based measures to assess physical function in hip and knee osteoarthritis: a systematic review,» Osteoarthritis Cartilage , vol. 20, n. 14, pp. 1548-1562, 2012.
[19] O. P. K. K. Jackson JL, «Evaluation of acute knee pain in primary care.,» Ann Intern
Med, vol. 139, n. 13, pp. 575-588, 2003.
[20] A. Muro-de-la-Herran, B. García-Zapirain e A. Méndez-Zorrilla, «Gait analysis methods: An overview of wearable and non-wearable systems, highlighting clinical applications.,» Sensors, vol. 14, n. 14, pp. 3362-3394, 2014.
[21] F. Casamassima, A. Ferrari, B. Milosevic, P. Ginis, E. Farella e L. Rocchi, «A wearable system for gait training in subjects with Parkinson’s disease,» Sensors, vol. 14, n. 15, pp. 6229-6246, 2014.
[22] N. Byl, W. Zhang, S. Coo e M. Tomizuka, «Clinical impact of gait training enhanced with visual kinematic biofeedback: Patients with Parkinson’s disease and patients stable post stroke,» Neuropsychologia, vol. 79, n. 16, pp. 332-343, 2015.
[23] J. Van den Noort, A. Ferrari, A. Cutti, J. Becher e J. Harlaar, «Gait analysis in children with cerebral palsy via inertial and magnetic sensors.,» Med. Biol. Eng. Comput., vol. 51, n. 17, pp. 377-386, 2013.
[24] D. H. Sutherland, «The evolution of clinical gait analysis part III— Kinetics and energy assessment,,» Gait Posture, vol. 21, n. 18, pp. 447-461, 2005.
[25] J. Z. W. S. Z. C. H. G. D. M. Qipeng Song, «Long-term Tai Chi exercise increases body stability of the elderly during stair ascent under high and low illumination,» Sports
Biomechanics, vol. 17, n. 3, pp. 1-12, 2017.
[26] S.R.Simon, «Quantification of human motion: Gait analysis-benefits and limitations to its application to clinical problems,» J. Biomech, vol. 37, n. 19, pp. 1869-1880, 2004. [27] J. P. R. R. H. S. K. a. J. R. W. J. R. Gage, «Rectus femoris transfer to improve knee
function of children with cerebral palsy,,» Develop. Med. Child Neurol., vol. 29, n. 20, pp. 159-166, 1987.
[28] A. a. H. A.Moghtaderi, «ValidationofMichigan neuropathy screening instrument for diabetic peripheral neuropathy,» Clin. Neurol. Neurosurg., vol. 108, n. 21, pp. 477-481, 2006.
[29] R. L. W. a. S. Mulroy, «The energy expenditure of normal and pathologic gait,» Gait
Posture, vol. 9, n. 22, pp. 207-231, 1999.
[30] BUSINESS WIRE, «BUSINESS WIRE,» BUSINESS WIRE, 26 August 2016. [Online]. Available:
https://www.businesswire.com/news/home/20160826005021/en/Global-Micro-Electro-Mechanical-Systems-Market-grow-CAGR-Close-12.
[31] X. Yun e E. Bachmann, «Design, Implementation, and Experimental Results of a Quaternion-Based Kalman Filter for Human Body Motion Tracking,» IEEE Trans.
Robot, vol. 22, n. 23, pp. 1216-1227, 2006.
[32] I. Pasciuto, G. Ligorio, E. Bergamini, G. Vannozzi, A. Sabatini e A. Cappozzo, «How angular velocity features and different gyroscope noise types interact and determine orientation estimation accuracy.,» Sensors, vol. 15, n. 24, p. 23983–24001, 2015. [33] W. Tao, T. Liu, R. Zheng e H. Feng, «Gait analysis using wearable sensors,» Sensors,
vol. 12, n. 25, pp. 2255-2283, 2012.
[34] X. W. Zhang X, «A Fuzzy Tuned and Second Estimator of the Optimal Quaternion Complementary Filter for Human Motion Measurement with Inertial and Magnetic Sensors.,» Sensors, vol. 18, n. 10, p. 3517, 2018.
[35] H. Fourati, N. Manamanni, L. Afilal e Y. Handrich, « Complementary Observer for Body Segments Motion Capturing by Inertial and Magnetic Sensors.,» IEEE/ASME
Trans. Mechatron., vol. 19, pp. 149-157, 2014.
[36] H. Luinge, P. Veltink e C. Baten, «Ambulatory measurement of arm orientation,» J.
Biomech., vol. 40, pp. 78-85, 2007.
[37] P. Picerno, A. Cereatti e A. Cappozzo, «Joint kinematics estimate using wearable inertial and magnetic sensing modules,» Gait Posture, vol. 28, pp. 588-595, 2008. [38] J. Favre, R. Aissaoui, B. Jolles, J. De Guise e K. Aminian, «Functional calibration
procedure for 3D knee joint angle description using inertial sensors.,» J. Biomech., vol. 42, pp. 2330-2335, 2009.
[39] A. Cutti, A. Ferrari, P. Garofalo, M. Raggi, A. Cappello e A. Ferrari, «“Outwalk”: A protocol for clinical gait analysis based on inertial and magnetic sensors.,» Med. Biol.
Eng. Comput., vol. 48, n. 30, p. 17–25., 2010.
[40] E. Palermo, S. Rossi, F. Marini, F. Patanè e P. Cappa, « Experimental evaluation of accuracy and repeatability of a novel body-to-sensor calibration procedure for inertial sensor-based gait analysis.,» Meas. J. Int. Meas. Confed., vol. 52, pp. 145-155, 2014. [41] R. E., «Preventive aspects of mobility and functional disability.,» Scand J Rheumatol
[42] G.-M. J. G. P. M. R. O. A. Alarcon T., «Activities of daily living after hip fracture: profile and rate of recovery during 2 years of follow up.,» Osteoporos Int., vol. 22, p. 1609–1613., 2011.
[43] B. I. N. R. Dechartres A., «Evolution of disability in adults with hip arthroplasty: a national longitudinal study.,» Arthritis Rheum., vol. 57, p. 364–371, 2007.
[44] F. A. S. A. H. W. McGrory B.J., «Correlation of measured range of hip motion
following total hip arthroplasty and responses to a questionnaire.,» J Arthroplasty., vol. 11, p. 565–571, 1996.
[45] H. M. D. G. Curry L.C., «Functional status in older women following hip fracture,» J
Adv Nurs, vol. 42, p. 347–354, 2003.
[46] B. H. S. S. M. S. W. U. Hemmerich A., «Hip, knee, and ankle kinematics of high range of motion activities of daily living.,» J Orthop Res, vol. 24, n. 4, p. 770–781, 2006. [47] O. G. M. R. M. A. V. d. S. R. C. V. L. J. H. V. D. B. P. R. J. B. P. I. J. M. W. N. Van
den Dikkenberg, «Measuring functional abilities of patients with knee problems: rationale and construction of the DynaPort knee test,» Knee Surg Sports Traumatol
Arthrosc, vol. 10, n. 4, pp. 204-212, 2002.
[48] K. J. K. ,. C. B. R. G. I. G. a. V. A. Eric Allseits, «A Novel Method for Estimating Knee Angle Using Two Leg-Mounted Gyroscopes for Continuous Monitoring with Mobile Health Devices,» Sensors, vol. 18, p. 2759, 2018.
[49] E. Allseits, J. Lucˇarevic´, R. Gailey, V. Agrawal, I. Gaunaurd e C. Bennett, « The Development and Concurrent Validity of a Real-time Algorithm for Temporal Gait Analysis using Inertial Measurement Units.,» J. Biomech., vol. 55, pp. 27-33, 2017. [50] T. C. M. G. K. W. T. L. F. S. R. B. H. W. a. M. M. M. Schulze, «Development and
clinical validation of an unobtrusive ambulatory knee function monitoring system with inertial 9DoF sensors,» 34th Annual International IEEE EMBS Conference, 2012. [51] e. a. G.Pacini Panebianco, «Analysis of the performance of 17 algorithms from
asystematic review: Influence of sensor position, analysed variable and computational approach in gait timing estimation from IMU measurements,» Gait & Posture, vol. 66, pp. 76-82, 2018.
[52] B. S. Grimm B, «Evaluating physical function and activity in the elderly patient using wearable motion sensors.,» EFORT, vol. 1, n. 5, pp. 112-120, 2017.
[53] P. Picerno, A. Cereatti e A. Cappozzo, «A spot check for assessing static orientation consistency of inertial and magnetic sensing units,» Gait Posture, vol. 33, pp. 373-378, 2011.
[54] E. Bergamini, G. Ligorio, A. Summa, G. Vannozzi e A. S. A. Cappozzo, «Estimating orientation using magnetic and inertial sensors and different sensor fusion approaches: Accuracy assessment in manual and locomotion tasks,» Sensors, vol. 14, n. 34, pp. 18625-18649, 2014.
[55] I. Pasciuto, G. Ligorio, E. Bergamini, G. Vannozzi, A. Sabatini e A. Cappozzo, «How angular velocity features and different gyroscope noise types interact and determine orientation estimation accuracy.,» Sensors, vol. 15, p. 23983–24001. , 2015.
[56] K. Lebel, P. Boissy, M. Hamel e C. Duval, «Inertial measures of motion for clinical biomechanics: Comparative assessment of accuracy under controlled conditions—Effect of velocity.,» PLoS ONE, vol. 8, p. e79945, 2013.
[57] A. Brennan, J. Zhang, K. Deluzio e Q. Li, «Quantification of inertial sensor-based 3D joint angle measurement accuracy using an instrumented gimbal,» Gait Posture, vol. 34, n. 37, pp. 320-323, 2011.
[58] T. Seel, J. Raisch e T. Schauer, « IMU-Based joint angle measurement for gait analysis,» Sensors, vol. 14, p. 6891–6909, 2014.
[59] K. O’Donovan, R. Kamnik, D. O’Keeffe e G. Lyons, « An inertial and magnetic sensor based technique for joint angle measurement.,» J. Biomech, vol. 40, pp. 2604-2611, 2007.
[60] J. Kavanagh, S. Morrison, D. James e R. Barrett, « Reliability of segmental
accelerations measured using a new wireless gait analysis system,» J. Biomech., vol. 39, p. 2863–2872., 2006.
[61] S. Tadano, R. Takeda e H. Miyagawa, «Three dimensional gait analysis using wearable acceleration and gyro sensors based on quaternion calculations.,» Sensors, vol. 13, pp. 9321-9343, 2013.
[62] A. E. E. R. B.-F. a. A. F. LauraSusana Vargas-Valencia, «An IMU-to-Body Alignment Method Applied to Human Gait Analysis,» Sensors, vol. 16, n. 44, p. 2090, 2016. [63] M.-A. B. T. S. a. T. S. Philipp Muller, «Alignment-Free, Self-Calibrating Elbow Angles
Measurement using Inertial Sensors,» IEEE Journal of Biomedical and Health
Informatics, vol. 21, n. 45, pp. 312-319, 2017.
[64] J. W. Lee JK, «Quaternion-Based Local Frame Alignment between an Inertial
Measurement Unit and a Motion Capture System,» Sensor, vol. 18, n. 11, p. 4003, 2018. [65] S. B. V. L. M. L. I. H. B. G. a. R. S. L Verlaan, «Accelerometer-based Physical Activity
Monitoring in Patients with Knee Osteoarthritis: Objective and Ambulatory Assessment of Actual Physical Activity During Daily Life Circumstances,» The Open Biomedical
Engineering Journal, vol. 9, pp. 157-163, 2015.
[66] Claris Healthcare Inc, «Claris Reflex,» Claris Healthcare Inc, [Online]. Available: https://clarisreflex.com/.
[67] «TracPatch – Wearable Device for Post-op Total Joint Patients,» TracPatch, [Online]. Available: https://www.tracpatch.com/.
2. METHODS
From the fusion and adaptation of two previous solutions for the calculation of the knee angle, the project described in this thesis work was created. One solution consists of two sensors, built with Arduino components, and a Computer App, all developed by Professor Lukasz Lapaj (Department of General Orthopaedics, Musculoskeletal Oncology and Trauma Surgery, Poznan University of Medical Sciences, Poland). The other one consists of two commercial sensors and an algorithm, based on the use of quaternions, developed by professor Matthijs Lipperts (AHORSE, Department of Orthopaedics, Zuyderland Medical Centre, The Netherlands). Since we want to create a new, low expensive, user friendly and simple solution, we take, from these two solutions, the most interesting aspects.
In the first and second sections of this chapter, we make a detailed explanation of all the elements that compose our project. Then we explain what we did in development phase of our solution.
2.1 Home-made sensors
Each one of these sensors is made by:
Knee
Motion
Project
Home-made
sensors
Computer
App
Algorithm
based on
quaternion
1) 1 WeMos TTGO T-Base esp8266 Wi-Fi wireless module 4mb flash I2c for Arduino, for the connection with other devices
2) 1 Adafruit bno055 absolute orientation sensor as IMU
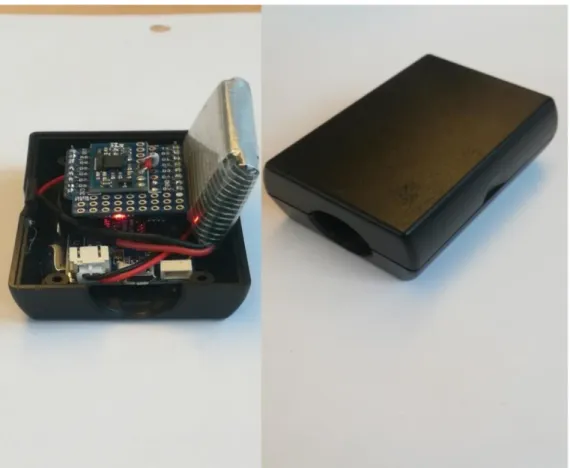
3) 2 black plastic boxes with dimensions 6,5 cmx4,5 cmx3,0 cm (2,56”x1,77”x1,18”), for the protection against falls, shocks and atmospheric agents
4) 1 FB75254 OHP battery (500 mAh and 3.7V) as electric surgent All the materials above mentioned are shown in the Figure 2.1.
Figure 2.1 All elements of Professor Lapaj's sensor. From left to right: a black plastic box
empty (down), a black plastic box with esp8622 Wi-Fi board glued inside (up), FB75254 OHP battery and Adafruit bno055 absolute orientation sensor.
All the commands that the board must do are included in a sketch, created with software Arduino IDE. When the sketch is upload on the board, via USB input, the code is compiled by esp8266 mini processor. A schematic diagram, with all the actions performed by these sensors,
is shown below. The functioning of the sensor can be assimilated to a switch: when the battery is plugged in, the sensors are connected to a Wi-Fi network and are sending data, independently if the app on the computer or the computer itself are ready to receive them. When there is no source to power the boards, they are completely switched off. Once loaded the sketch, the user does not have the possibility to modify the features as for example sample rate, Wi-Fi network or speed of transmission. The only way to modify the functioning is by uploading a new sketch, with different instructions, on the board. From a general point of view, we can distinguish, in all sensors, a sensitive part composed by an accelerometer, gyroscope and/or magnetometer and a processing part where all libraries are included, and all operations are performed. As specified in the chapter “Introduction”, the sensitive part of most part of sensor have comparable performance (the sensitive part in black sensors is made with Bosh components), so we assumed that the accuracy of raw data are comparable with other commercial solution. What make a difference is the different approaches implemented in processing part. In our experimental solution all algorithm of sensor fusion are unknow because implemented directly by the use of Arduino libraries.
In Figure 2.2 shows how the sensor looks like with and without all protection, respectively.
Figure 2.2 Professor’s Lapaj sensors assembled (on the left) and with all protection (on the
2.2 Algorithm and Computer App
The app was created with the integrated development environmental Microsoft Visual Studio 2017 version 3.9 with which the user can select the type of internet connection, manage the streaming of data, (when it begins and ends), check if all sensors are connected and save the date received.
All these actions can be done thanks to the user-interface, shown in Figure2.3. The correct use of the app consists of 5 steps:
1) To select the type of network with the drop-down list under “Network”. After that, the IP address and IP broadcast will appear besides “IP” and “bcast”, respectively. During all tests performed in this project, we used a smartphone as hotspot, so the option “Wireless Network Connection” was chosen (Figure 2.4). However, the names on the list depend on the laptop where the app is used, it means that the same type of connection could have different names on different laptops.
2) To find connected devices. A necessary condition of this experimental set-up is that all sensors must be connected to the same Wi-Fi network. The app on the computer detects all the devices connected to the selected network, except the computer itself, and shows their IP addresses into the window “Console”. If one of the sensors was missed, the user can repeat research with the button “Search”. When all devices are connected, the app is ready for the data streaming.
3) To start data streaming with button “Start”. These raw data, coming from all sensors, were displayed in different parts of the interface, especially in the window under “Incoming data counter”. This version of the app was programmed to receive from the sensors the following output:
• Eulerian angle respect X-axis (X) • Eulerian angle respect Y-axis (Y) • Eulerian angle respect Z-axis (Z) • Calibration of the gyroscope (gyr) • Calibration of the accelerometer (acc) • Calibration of the magnetometer (mag)
Figure 2.3 Initial version of user interface professor Lapaj’s computer app
As reported by the official website of Adafruit (Adafruit, s.d.) [1]. “The BNO055 includes internal algorithms to constantly calibrate the gyroscope, accelerometer and magnetometer inside the device. The exact nature of the calibration process is a black box and not fully documented, but you can read the calibration status of each sensor using the “.getCalibration” function in the
Adafruit_BNO055 library. The four calibration registers -- an overall system calibration status, as well individual gyroscope, magnetometer and accelerometer values -- will return a value between '0' (uncalibrated data) and '3' (fully calibrated). The higher the number the better the data will be”. In other words, the library allows having a scale of values, from 0 to 3, that shows to the user the inner level of calibration of each sensor and the user can check, in each sample, the status of accelerometer, gyroscope and magnetometer.
Figure 2.4 An example of connections available on a computer
The Euler angles, such as quaternions, are provided directly from the sensors thanks to Arduino library “utility/imumaths”. They are calculated by an inner sensor-fusion algorithm that uses data from the gyroscope, accelerometer and magnetometer. Similar to the calibration procedure, this process is a not well-documented.
4) To end the acquisition with button “Stop”.
5) To save the data in the window under “Incoming data counter” by pressing the button “SAVE TXT FILE”. The name of the file can be changed by the user or it is automatically changed by the app to avoid the risk to overwrite the files. Professor Matthijs Lipperts shared with us his self-made algorithm created to analyse the results coming from commercial sensors GCDC Human Activity Monitor (HAM) that are a compact self-recording data logger available with several sensor variants. Data from the digital sensors are time-stamped using a real-time clock and stored to a microSD card in simple text format. When connected via the USB to a personal computer, the HAM appears as a standard mass storage device containing the comma-delimited data files and the user setup file. The HAM includes an internal 250mAh lithium-polymer rechargeable battery, which recharge using USB power. The sensors and their general features are shown below
Figure 2.5 GCDC Human Activity Monitor (HAM) IMU sensors
General Features of HAM-IMU
• Compact size (2.21” L 1.55” W 0.60” H, 0.9 oz) • User selectable sample rates of 50, 100 and 200 Hz
• Accurate time stamped data using Real Time Clock (RTC) • Data recorder to internal 8 GB flash memory
• Easily readable comma separated text data files
• Internal hardwired rechargeable Lithium-Polymer battery, charges via USB
• Data transfer compatible with Windows/Linus/mac via USB interface (no special software required)
• 3-axis accelerometer, gyroscope, magnetometer
• Quaternion orientation based on accelerometer and gyroscope data
The code of the algorithm is developed in the programming language MATLAB, version 9.4. The algorithm allows the extraction of the raw data in CSV format and, before the post-processing operations, as for example filtering and operations with quaternions, is performed on a preliminary stage for the synchronization between the sensors and the calibration on the subject. For each sample the outcome parameters given by GCDC HAM are tri-axial accelerations, tri-axial angular speed, tri-axial values of magnetic field and its quaternion, calculated by an inner algorithm based on the sensor fusion. The core of the elaboration is the
product between every quaternion and the first one, in order to obtain a new quaternion. As explained in the chapter “Introduction”, this new quaternion represents the new position of the sensor in 3D space. Then is executed a conversion from quaternion to Euler angle is executed for each quaternion calculate in this way. This operation is done on both sensors. At the end of this part of the algorithm, the positions occupied by both sensors, in the subject’s leg reference system, during all the duration of motion test are calculated and it is easily possible to add them or subtract them to calculate the subject’s knee angle (the choice to add or to subtract the angles depends on the orientation of the sensor, in particular by the orientation of Z-axis. If the Z-axis of sensors have the same direction and, the angles will be subtracted, in the other case they will be added). An illustration about how the algorithm calculate knee angle is show in figure alongside.
2.3 Adaptation phase
We tried to combine these two different approaches in a unique solution to create a new experimental set up to achieve our purposes. We made changes in the Arduino Sketch, in the computer app and in the algorithm. A detailed list of all our changes, with their respective motivations, is reported in table below.
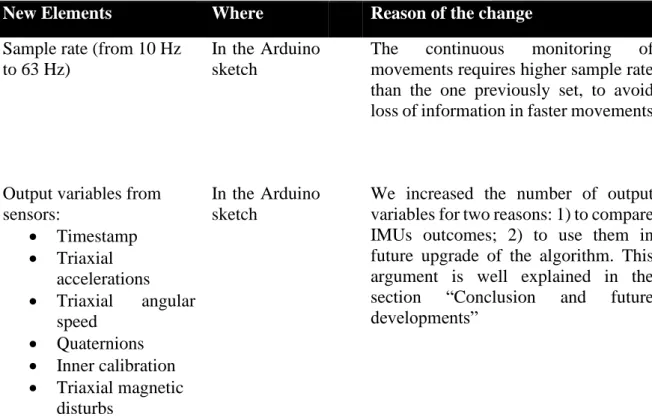
Table 2.1. List of all changes made in Professor Lipperts and Professor Lipaj’s solutions.
New Elements Where Reason of the change
Sample rate (from 10 Hz to 63 Hz)
In the Arduino sketch
The continuous monitoring of movements requires higher sample rate than the one previously set, to avoid loss of information in faster movements
Output variables from sensors: • Timestamp • Triaxial accelerations • Triaxial angular speed • Quaternions • Inner calibration • Triaxial magnetic disturbs In the Arduino sketch
We increased the number of output variables for two reasons: 1) to compare IMUs outcomes; 2) to use them in future upgrade of the algorithm. This argument is well explained in the section “Conclusion and future developments”
User Interface In the Computer app
To make it more intuitive and easier to use for the user. The new version of the app can be seen in Figure 2.7
Saving data in CSV format In the Computer app
The CSV format is easier to use not only with MATLAB but also with other programming language, as for example RStudio
Cleaning of previous acquisitions
In the
Computer app
To the user is given the choice to hold the old data from previous acquisitions or to delete them to have a clean sheet with button “CLEAR ALL “
Adding of title In the
Computer app
In this way the user can immediately understand the meaning of the numbers that appear on the interface
Calibration on subject In the algorithm
In professor Lipperts’s algorithm there is a part dedicated to subject’s specific calibration. A well-controlled movement, performed before any type of motion test, is used as reference, (in professor Lipperts’s it is a slow squat performed in front of a wall).
This part is missing in our set-up.
Offset elimination In the
algorithm
Because of their nature, quaternions take the initial position as system of reference, so the knee angle calculate with the algorithm always starts from 0°. To consider the real subject’ knee angle in the erect position, it was calculated the offset between two signals, and it was removed.
Selection of data In the
algorithm
Since quaternions that IMU sent to computer app are the result of an inner combination of accelerometer, gyroscope and magnetometer data, if one of these tools is not well calibrated,
the quaternion of that moment could be erroneous. For this reason, we established selection criteria for the samples: the value of inner calibration of accelerometer, gyroscope and magnetometer must be at least 2, in order to work only with quaternions coming from calibrated data.
Synchronization between sensors
In the
algorithm
In professor Lipperts’s algorithm, there is a part dedicated to synchronization between sensors. The user must perform a well-defined event, like a double tap on the sensors or a jump, before to start the motion test in order to easily identify it in the signal. In our set-up this part is completely automatic. Thanks to Arduino library “TimeClient”, we synchronize inner clock of the sensors with Internet and then the algorithm finds the closest samples from two sensors.
Figure2.7. New version of professor Lapaj’s app used in our project.
As can be seen on the above illustrated table, we adapted and changed the pre-processing part of Professor Lippert’s algorithm because it was strictly linked to GCDC HAM-IMU, whereas we did not modify post-processing analyses. In order to clarify the functioning of the sensors in our project a little diagram with all steps performed, is reported below.
Figure 2.8 Diagram about functioning of home-made sensors (after adaptation)
At the end of this adaptation process and fusion of different approaches, we developed our knee monitoring systems based on two IMUs, consisting of a hardware part (two sensors made with Arduino component by Professor Lapaj) and an adapted version from Matthijs’ algorithm part. From now on in this thesis work, we will refer to our experimental set-up (algorithm + sensors) as black sensors (because of the colour of their protection) in order to make notation lighter.
2.4 Validation
2.4.1 Plausibility test
In order to assess the goodness and the quality of the outcome coming from our solution, we made a preliminary test to control the plausibility of our results. We attached our sensor at the endings of a plastic goniometer. We attached the goniometer at the wall in vertical position, so
1° Step
• Writing of instruction on the Arduino sketch • Upload sketch on the
board via USB
2°Step
The micro-processor eps 8266 reads the list of instructions
3° Step
The micro-processor establish a Wi-Fi connection with Wi-Fi network indicated in sketch
4° Step
The micro-processor actives IMU in on the shield and sets the sample rate at value written in sketch
5°Step
The library " Adafruit_BNO055 " for the calcute of inner calibration and the orientation is enable
6° Step
The library "TimeClient" to set the inner clock to current time is enable
7° Step
The IMU, from the values of 3-axis accelerometer,
gyroscope and magnetometer, calculate the orientation of the board in 3D space
8° Step
The IMU sends the values sampled and the quaternions, that describes the orientation, to laptop
that between the sensors there was an angle of 180°, i.e. 0° in clinical system of reference. Then we moved the sensor attached at the upper ending of goniometer toward the other sensor, from 0° to 90° and from 90° to 0° in all human anatomical planes (frontal, sagittal, transverse) , in order to assess sensibility of our system and to simulate, only for the movement in sagittal plane, the physiological RoM of a human knee. In figure 2.7 are shown different moments of this test.
Figure 2.9. The position of sensors and goniometer while simulating stand up position (left),
sit-down position (right)
2.4.2 Motion Tests
To assess the performance of our monitoring system, a series of very common daily movements were chosen. The movements selected are walking, squatting, sit-to-stand transitions, stair
climbing, going downstairs and running. With these movements we planned the following motion tests:
1. 5 squat and then 30 seconds walking
2. 1-minute sit-to-stand transitions with 3 seconds of rest after every change of position 3. 1-minute squatting changing every 3 squats the speed and intensity of movement 4. Stair climbing 4 steps, placing one foot on one step and the other foot on the next step 5. Stair climbing 4 steps, placing both feet on same step before to proceed to the next one 6. Going downstairs 4 steps, placing one foot on one step and the other foot on the next
step
7. Going downstairs 4 steps, placing both feet on same step before to proceed to the next one
8. 1 minutes running at 10km/h speed
From now these tests will be called Motion Test 1 (MT1), Motion Test 2 (MT2), Motion Test 3 (MT3), Motion Test 4 (MT4), Motion Test 5 (MT5), Motion Test 6 (MT6) Motion Test 7 (MT7), Motion Test 8 (MT8), respectively. In all motion tests we assessed the sensibility of our solution, some of these tests were performed more than one time because we were also interested in the reliability of measurements. How many times each test was performed is shown in Table 2.
Table 2.2. Little resume of all motion tests executed
MOTION TEST REPETITIONS
MT1 5 MT2 1 MT3 1 MT4 3 MT5 1 MT6 3 MT7 1 MT8 2
Figure 2.10 Global view of sensor position Figure 2.11 Specific length of each segment
It is important to specify that in the first repetition of MT8, the subject started the run on a treadmill from a standing position. After one minute, this repetition ended, and we started a new acquisition without stopping subject running. So, the second acquisition started while the subject was still running.
2.4.3 Position of sensors
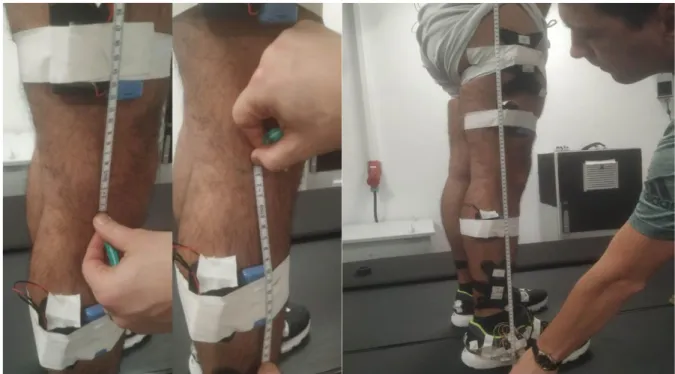
We decided to attach the sensor on the right leg because is subject’ dominant leg. We measured the length of the leg (80 cm), from the hip to the sole of foot, with a meter, as shown in Figure 2.8. We considered the total leg divided in two segments, upper (from the hip to the knee) and lower one (from knee to the foot). We measured the length of both, taking, respectively, as anatomic reference the distance lateral femoral epicondyle-anterior iliac spines, lateral femoral epicondyle-lateral malleolus (Figure 2.9). The black sensors were fixed at the same position on the segments, i.e. at 50% of length of single segment during all motion tests that corresponds at 20 cm from the lateral femoral epicondyle for upper segments and at 20 cm from the lateral femoral epicondyle for the lower one.
2.4.4 Motion Laboratory
The above-mentioned motion tests were performed in the human motion laboratory of Luxembourg Institute of Health (LIH) with a high-speed (200 Hz) motion analysis system consisting of four CX1 3D scanner units (CODAmotion, Charnwood Dynamics, UK) placed on all four sides of the treadmill. It was used to track knee and ankle joints as well as shoe/ground angles during the tests. The subject wore shoes that were pre-equipped with two markers on the calcaneus area and on the top of the shoe (base of shoelace). Two more markers were placed on the shoes on palpable anatomical locations at the 1st and 5th metatarsophalangeal joints. Ten markers (5 per leg were placed on the following anatomical landmarks: tibial and fibula malleoli, femoral condyles and greater trochanters. Finally, four rigid clusters equipped with four markers each were placed on the shanks and the thigh. A static calibration record was done using the full set of 34 markers with participant standing in a neutral pose. During all tests, only the clusters and the markers placed at the shoes (n=24) were tracked at 200 Hz. Kinematic data were analysed using Visual3D (V.5.02.19, C-Motion, USA). Joint angles were normalised with respect to the standing trial [2]. The knee flexion in sagittal, frontal and transvers plane was calculated.
2.5 Comparison and statistical analyses performed
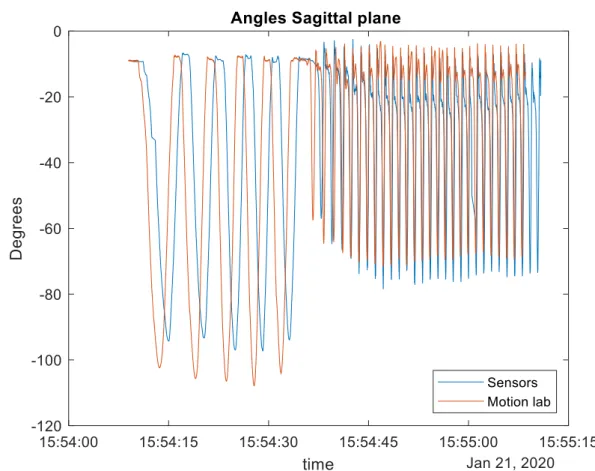
Black sensors and motion laboratory estimated separately the knee angle. From these two signals, max knee flection and max knee extension were extracted for each single movement (i.e. a squat, a step, a gait cycle, etc.), in order to estimate the RoM. For each motion test, the values and time of these two parameters are compared. In the next chapter of this master thesis will be presented only the results about MT1, MT2 and MT8, in order to describe the quality of our monitoring system in three different condition of speed, (respectively: middle, low, high). Furthermore, a Bland-Altman plot is performed on the results of MT1 because is the motion test performed several times, in order to visualise the difference between our solution and the gold standard.
2.6 Usability
Another important parameter that was investigate in this project was the usability of the black
sensors. We were interested about the usability of both hardware and software. In the scientific
literature, there are a lot of questionnaires for the assessment of usability but, because of very low number of participants (n=2 for the app and n=1 for sensors) and lack of time, it was not deemed necessary submit one of them. We just limited to report the impressions and the
experience of the participant. To assess the usability of the app we took inspiration from Questionnaire for User Interaction Satisfaction (QUIS), developed in 1989 at the Human Computer Interaction Laboratory (HCIL), in the College Park of Maryland University by Kent Norman e Ben Schneiderman and the criteria selected by this questionnaire were:
• Screen design and layout • Learnability
• Overall reaction to the software
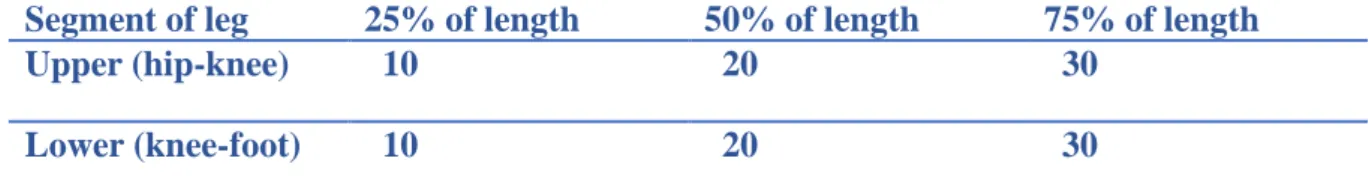
To assess the usability of the sensors, we placed one sensor at 25%, 50% and 75% of the distance hip-knee and the other sensor 25%, 50% and 75% of the distance knee-foot. The measurements are illustrated in the following table
Table 2.3. Distance, in cm, at which the sensors were positioned during the usability tests
Segment of leg 25% of length 50% of length 75% of length
Upper (hip-knee) 10 20 30
Lower (knee-foot) 10 20 30
The sensors were worn by the subject for at least 4 hours in each position and he valued the comfort/discomfort during daily life activities. During the acquisition of experimental data, the placement of black sensors did not change, and we did not assess if sensor placement influence outcomes.
References
[1] Adafruit. (n.d.). Retrieved from https://learn.adafruit.com/adafruit-bno055-absolute-orientation-sensor/device-calibration
[2]Laurent Malisoux, P. G. (2017). Adaptation of running pattern to the drop of standard cushioned shoes: A randomised controlled trial with a 6-month follow-up. Journal of
3 RESULTS
3.1 Results of plausibility test
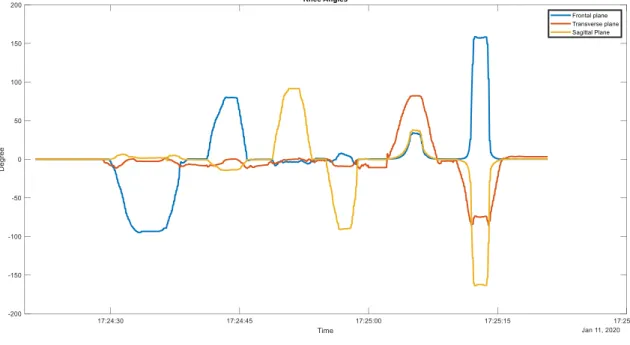
When performing six distinct movements (ca. 90deg turns by hand in 3 orthogonal planes and in both directions) in sequence using the black sensor set-up mounted to a plastic goniometer, the output for the relative angle between both sensor units followed qualitatively and quantitatively the expected signal. In this stage of calibration, we were not interested to assess if our system was able to detect physiological movements, in fact only one movement could be considered physiological (from 0° to – 90° and go back), but rather its sensibility.
Figure 3.1 Black sensor’s knee angle output for various distinct movements as an initial
plausibility test (no gold standard).
As can be seen in Figure 3.1, black sensors outcomes followed the expected patterns, except for movements in transversal plane (they simulated the intra/extra rotations of knee). It is visible that, during the movements, in sagittal and frontal planes, there were large angular changes in values only in the expected plane.
A table with all range of motions (expected and calculated) is reported below.
Table 3.1. Successive movements of the black sensors on a goniometer to compare output to
the theoretically expected plausible value
Type of Movement Expected range in Range in frontal Expected range in Range in sagittal plane Expected range in Range in transverse Plane
frontal plane (degrees) plane (degrees) sagittal plane (degrees) (degrees) transverse plane (degrees) (degrees) 0°to -90° in frontal plane [-90,0] [-94.75-0] 0 [0-6.37] 0 [-11.4,0] -90° to 0° in frontal plane [-90,0] [-93.38-0] 0 [1.7-5.2] 0 [-6.6,2.3] 0°to 90° in frontal plane [0,90] [0, 80.32] 0 [-13.8, 0.72] 0 [-9.8,1.3] 90° to 0° in frontal plane [0,90] [0, 80.32] 0 [-13.7, -0.9] 0 [-1.2, -11.7] 0°to 90° in sagittal plane 0 [-8.13, -0.13] [0,90] [-0.6,91.3] 0 [-5.4,-0.55] 90° to 0° in sagittal plane 0 [-3, -1.82] [0,90] [0.11,91.3] 0 [-3.2, -0.7] 0°to -90° in sagittal plane 0 [-0.5, 6.7] [-90,0] [0.11, -90.63] 0 [-0.7, -8.4] -90° to 0° in sagittal plane 0 [3.1, -0.7] [-90,0] [-89.34,0.21] 0 [12.14, -8.7] 0°to 90° in transverse plane 0 [0.73, 34.09] 0 [0.57, 38] [0,90] [-10.56,81.8] 90°to 0° in transverse plane 0 [0.39,34] 0 [-0.57,36.8] [0,90] [-2.2, 82] 0°to -90° in transverse plane 0 [0.93, 158.6] 0 [-163.8, -0.29] [-90,0] [-2.2, -84]
![Figure 1.2 A typical set-up for gait analyses with optical motion capture system [25]](https://thumb-eu.123doks.com/thumbv2/123dokorg/7390940.97163/9.892.110.746.373.726/figure-typical-set-gait-analyses-optical-motion-capture.webp)