Università degli Studi di Ferrara
DOTTORATO DI RICERCA IN
"SCIENZE DELLA TERRA"
CICLOXXIVCOORDINATORE Prof. BECCALUVA Luigi
Lattice relaxation in solid solutions:
long-range vs. short-range structure
around Cr
3+and Co
2+in oxides and silicates
Settore Scientifico Disciplinare GEO/06
Dottorando Tutore
Dott. ARDIT Matteo Prof. CRUCIANI Giuseppe
_____________________________
(firma) (firma)
Co-tutore Dott. DONDI Michele
____
(firma)
Contents
Abstract / Riassunto v
1. Introduction
11.1. Solid solutions 1
► Substitutional solid solutions 3
► Interstitial solid solutions 4
► Omissional solid solutions 5
1.2. From the additivity law of Vegard
to the phenomenological theory of Urusov 5
1.3. The concept of structural relaxation 6
1.4. Structural relaxation from electronic absorption spectroscopy 8
1.5. Technological perspective 9
2. Experimental methods
11 2.1. Synthesis procedures 11 ► Solid-state reaction 12 ► Sol-gel combustion 13 2.2. X-ray diffraction (XRD) 14► X-ray powder diffraction (XRPD) 15
► Whole Powder Profile Fitting (WPPF) - the Rietveld method 17
2.3. X-ray powder diffraction (data collection) at ambient condition 19
► Rietveld refinement strategies for data collected at ambient condition 20
2.4. X-ray powder diffraction (data collection)
and Rietveld refinement strategies at non ambient condition 22
► High pressure synchrotron data collection 22
● Notes on Rietveld refinement strategies (HP) 23
► High temperature data collection 24
● Notes on Rietveld refinement strategies (HT) 25
2.5. Coordination polyhedron variations
► Quadratic elongation (λ) 26
► Bond angle variance (σ2) 26
► Bond length distortion (BLD) 27
► Edge length distortion (ELD) 27
► Effective coordination number (ECoN) 27
2.6. Spectroscopic methods 28
► Electronic absorption spectroscopy (EAS) 29
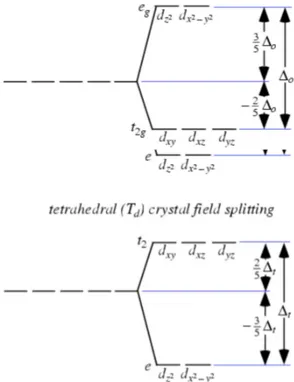
► Crystal field theory (CFT) 30
● One-electron systems 31
● Crystal field splitting 32
● Multi-electron systems 33
● Tanabe-Sugano diagrams 34
2.7. UV-visible-NIR spectroscopy 35
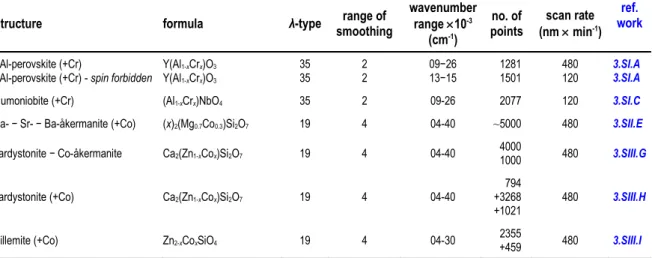
► Quantitative spectra analysis 36
● Cr3+ 36
● Co2+ 37
2.8. Technological tests to ceramic pigments 38
3. Results and Discussion
41Premise 41
3. Section I. − Structural relaxation around six-fold coordinated Cr3+:
the cases of the YAlO3–YCrO3 perovskite
and of the AlNbO4–CrNbO4 solid solutions 43
► Perovskite 43
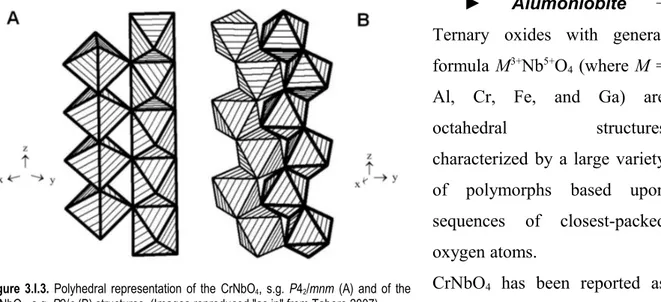
► Alumoniobite 44
3. Section I. A. ♦ Structural relaxation around Cr3+
in YAlO3–YCrO3 perovskites from electronic absorption spectra 47
Abstract 47
► Introduction 48
► Experimental 49
► Results and discussion 49
● Crystal structure 49
● Optical properties 52
● Structural relaxation 54
► Conclusion 57
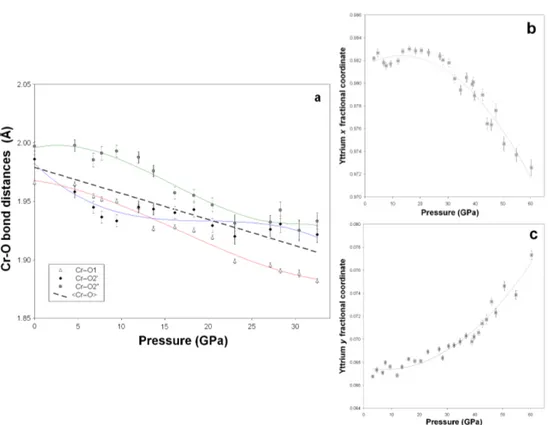
3. Section I. B. ♦ Elastic properties of YCrO3 up to 60 GPa 59
Abstract 59
● Pressure dependence of cell distortion 66
► Concluding remarks 67
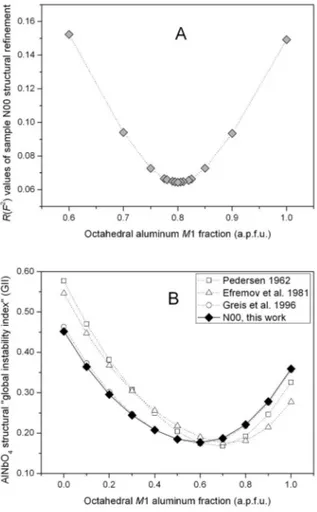
3. Section I. C. ♦ Structural stability, cation ordering,
and local relaxation along the join AlNbO4–Al0.5Cr0.5O4 69
Abstract 69
► Introduction 69
► Experimental 71
► Discussion of results 72
● XRD - Properties of the Al1-xCrxO4 join 72
● XRD - Unit cell parameters 72
● XRD - Cation ordering model 73
● XRD - M1 and M2 octahedra as a function of Cr Al substitution 76
● Optical spectroscopy 78
● Structural relaxation around Cr3+ ions 82
3. Section II. − Structural relaxation around four-fold coordinated Co2+:
the case of the Sr2MgSi2O7–Ba2MgSi2O7 melilite solid solution 85
► Melilite-type 85
► Melilite-related 86
3. Section II. D. ♦ Melilite-type and melilite-related compounds: structural variations along the join Sr2-xBaxMgSi2O7, (0 ≤ x ≤ 2)
and high-pressure behaviour of the two end-members 89
Abstract 89
► Introduction 90
► Experimental procedures 90
► Results and discussion 92
► Conclusion 101
3. Section II. E. ♦ Local structural investigation along the
Ca–Sr–Ba-åkermanite solid solution doped with a fixed amount
of tetrahedrally coordinated Co2+ 103
► Introduction 103
► Experimental 104
► Results and discussion 104
● Phase composition 104
● Crystal structure of melilite 106
● Optical spectroscopy 109
● Structural relaxation 113
3. Section II. F. ♦ The inverse high temperature/high pressure relationship
in the monoclinic Ba2MgSi2O7 melilite-related structure 115
Abstract 115
► Introduction 115
► Experimental 116
3. Section III. − Structural relaxation around four-fold coordinated Cr2+:
the case of the Ca2ZnSi2O7–Ca2CoSi2O7 melilite solid solution 123
3. Section III. G. ♦ Structural relaxation in tetrahedrally-coordinated Co2+
along the hardystonite–Co-åkermanite melilite solid solution 123
► Introduction 123
► Experimental 124
► Results and discussion 126
● Crystal structure 126
● Optical properties 129
● Structural relaxation 130
3. Section III. H. ♦ Co-doped hardystonite, Ca2(Zn,Co)Si2O7,
a new blue ceramic pigment 133
Abstract 133
► Introduction 133
► Experimental 136
► Results and discussion 137
► Conclusion 140
3. Section III. I. ♦ Co-doped willemite ceramic pigments:
technological behaviour, crystal structure and optical properties 143
Abstract 143
► Introduction 143
► Experimental procedure 144
► Results and discussion 146
● Crystal structure 146
● Optical properties 149
● Technological behaviour of willemite pigments 152
● Pigment-coating interactions 153
► Conclusions 157
4. Conclusion
(On the structural relaxation around octahedrally coordinated Cr3+) 159
4.1. Packing efficiency and symmetry lowering 159
4.2. Structural relaxation coefficient
as a function of the structural features 162
Abstract
This dissertation reports the results derived from the 3-year doctoral thesis project aimed at exploring some oxide and silicate structures as promising ceramic pigments with enhanced colorimetric properties with respect to the traditional colorants. Solid solutions of perovskite, alumoniobite, and melilite compounds were obtained by doping octahedral and tetrahedral coordination sites with transition metal ions (e.g. Cr3+, Co2+, and Zn2) through a solid-state
synthesis performed by means of an industrial-like process. The analytical techniques adopted to investigate the synthesized compounds allowed the determination of the "averaged" crystal structure, or the so termed long-range properties, and the short-range properties (i.e. the local structure around the substituting ions) through X-ray powder diffraction and electron absorption spectroscopy (EAS), respectively. As stated by Geiger (2001) "an understanding of the microscopic, mesoscopic and macroscopic properties and of the behaviour of solid solutions under different conditions is a challenge for all disciplines concerned with the solid state". As a matter of fact, the precise determination of a structure around impurities results fundamental to provide detailed information on their incorporation and on physical properties. For instance, in the case of the solid solutions here reported, the lattice incorporation of transition metal ions as impurities is the cause of their gradual coloration. Most of the times, such a coloration is more intense as greater is the impurity amount.
The final goal of this work, was attained by calculating the structural relaxation coefficient for each studied solid solution by combining the mean with the local bond distances achieved by XRPD and EAS, respectively.
Riassunto
In questa tesi sono riportati i risultati ottenuti durante il progetto triennale di dottorato volto ad esplorare strutture di ossidi e di silicati considerati dei promettenti pigmenti ceramici dalle proprietà colorimetriche migliorate rispetto ai coloranti tradizionali. Soluzioni solide di composti di perovskite, alumoniobite e melilite sono state ottenute dopando siti a coordinazione ottaedrica e tetraedrica con metalli di transizione (ad esempio Cr3+, Co2+ e Zn2+)
attraverso una sintesi allo stato solido condotta seguendo il processo industriale per la realizzazione di pigmenti ceramici. Le tecniche di analisi adottate per studiare i composti sintetizzati hanno permesso sia la determinazione della struttura cristallina "media", o delle così dette proprietà a lungo raggio, mediante la diffrazione di polveri ai raggi-X (XRPD), che delle proprietà a corto raggio (cioè della struttura locale nell'intorno degli ioni sostituenti) attraverso la spettroscopia di assorbimento elettronico (EAS). Come affermato da Geiger (2001) "la comprensione delle proprietà microscopiche, mesoscopiche e macroscopiche e del comportamento di soluzioni solide in condizioni diverse è una sfida per tutte le discipline coinvolte nello studio dello stato solido". La precisa determinazione di una struttura nell'intorno di "impurità" risulta perciò fondamentale al fine di fornire informazioni dettagliate sulla loro incorporazione e sulle loro proprietà fisiche. Ad esempio, nel caso delle soluzioni solide riportate in questa tesi, l'incorporazione strutturale di ioni di metalli di transizione come impurità è la causa della loro graduale colorazione. Il più delle volte tale colorazione è tanto più intensa quanto maggiore è la quantità di impurità.
L'obiettivo finale di questo lavoro, è stato raggiunto mediante il calcolo del coefficiente strutturale di rilassamento di ogni soluzione solida studiata, combinando le distanze di legame medie, ottenute tramite XRPD, con quelle locali, derivate dalla spettroscopia EAS.
1.
INTRODUCTION
1.1. Solid solutions
The composition of a mineral or a synthetic compound is an internal variable, a characteristic intrinsic to each crystal (Hazen and Finger 1984). Most minerals exhibit a considerable range in chemical composition. Such variation mainly derives from ionic substitutions or solid solutions. A solid solution, therefore, can be defined as the result of the replacement of one ion or ionic group by another in a particular structure, and its importance ranges over a wide variety of cases. To give an example, studies on solid solutions allow the achievement of reliable phase diagrams for many types of materials, and family of minerals. Furthermore, the structural doping through the process of ion replacement can improve the electric, magnetic, or mechanical performances of a compound by modifying the physical and chemical properties of the pure "undoped" phase. It follows that the accommodation process and, therefore, the investigation of the structural environment around substitutional elements in solids is one of the key topics in several scientific fields such as metallurgy, chemistry, physics, material science, and the Earth science disciplines (Geiger 2001).
The formation of a solid solution can be explained by simple rules regarding atomic size, crystal structure, valence, and electronegativity factors. These rules were formulated by Victor Moritz Goldschmidt (1937), a mineralogist considered to be the founder of modern geochemistry and crystal chemistry. An important objective of Goldschmidt's work was to discover the laws of distribution of the chemical elements. Goldschmidt as well as Pauling (1927) pointed out that the internal structure of crystals could be understood in terms of the size and charge of the ions, and that an ion of one element can replace an ion of another if it is similar in size and charge. These considerations are summarized by a set of generalizations known as Goldschmidt's rules of substitution (Faure 1998).
(i) The ions of one element can extensively replace those of another in ionic crystals if their radii differ by less than about 15%.
(ii) Ions whose charges differ by one unit substitute readily for one another provided electrical neutrality of the crystal is maintained. If the charges of the ions differ by more than one unit, substitution is generally slight.
(iii) When two different ions can occupy a particular position in a crystal lattice, the ion with the higher ionic potential (the ratio of nominal valence to the radius of an ion) forms a stronger bond with the anions surrounding the site.
(iv) Substitution may be limited, even when the size and charge criteria are satisfied, when the
competing ions have different
electronegativities (the measure of the ability of an atom in a molecule to attract electrons to itself) and form bond of different ionic character.
The latter rule was formulated by Ringwood (1955) to explain the discrepancies that arose
from the first three rules previously proposed by Goldschmidt. For example, according to Goldschmidt's rules, isovalent substitutions between Na+ and Cu+, or Ca2+ and Cd2+, should be
allowed. Hence, Cu+ should replace Na+ in sodium minerals such as albite (NaAlSi
3O8) or
halite (NaCl), but in reality this substitution does not occur. The reason of such impediment derives from the different nature of the bonds that copper and sodium usually adopt in a crystal structure in compliance with their electronegativities, i.e. copper forms more covalent bonds than sodium (Faure 1998).
Other factors, as the "external" variables temperature and pressure, can play a significant role in determining the extent of a ionic substitution (e.g. the temperature at which crystals grow). The higher the temperature, the more extensive is the thermal allowance in the crystal structure and the less strict are the spatial requirements for the ion replacement. As a result, ionic substitutions that could not have occurred in crystals grown at low temperatures may be Figure 1.1. Schematic representation of the electronegativity values along the periodic table of elements.
its low-temperature counterpart (see Table 1.1). On the other hand, a pressure increasing can also affect the size of both the crystallographic sites and (to a lesser degree) of the ions, thus resulting that different substitutions might take place at higher pressure.
Typically, solid solutions are classified as substitutional, interstitial and omissional.
► Substitutional solid solutions − This is the most widespread ionic substitution. It can imply an isovalent exchange of atoms, meaning that ions of equal charge and nearly equal size substitute for one another (i.e. the so-called simple solid solutions, as the example reported in Figure 1.2), or involve a coupled substitution if an ion of different charge is substituted. In this case, a multiple substitution is need in order to maintain the charge balance (see the Table1 for some examples).
Figure 1.3. Sub-classification of a simple substitutional solid solution based on the arrangement of the atoms. From left to right: random, clustered and ordered distribution of the atomic species.
Furthermore, substitutional solid solutions can be complete or partial, if the ions replacement occur over the complete range of possible compositions or the compositional range of substitution is limited, respectively. Some very common examples of substitutional solid solutions occurring in minerals are reported in Table 1.1.
Figure 1.2. Example of a substitutional solid solution occurring in brass, a copper-zinc alloy.
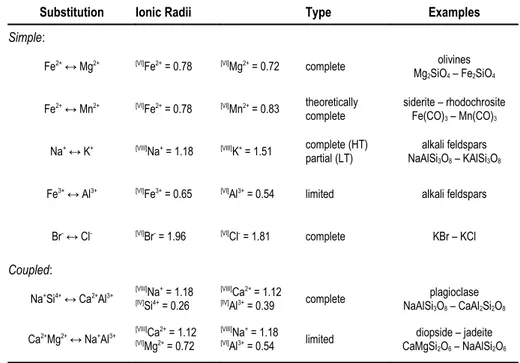
Table 1.1. Common examples of substitutional solid solutions in Earth science.
Substitution Ionic Radii Type Examples
Simple:
Fe2+ ↔ Mg2+ [VI]Fe2+ = 0.78 [VI]Mg2+ = 0.72 complete olivines
Mg2SiO4 – Fe2SiO4
Fe2+ ↔ Mn2+ [VI]Fe2+ = 0.78 [VI]Mn2+ = 0.83 theoretically
complete siderite – rhodochrositeFe(CO)3 – Mn(CO)3
Na+ ↔ K+ [VIII]Na+ = 1.18 [VIII]K+ = 1.51 complete (HT)
partial (LT) NaAlSialkali feldspars3O8 – KAlSi3O8
Fe3+ ↔ Al3+ [VI]Fe3+ = 0.65 [VI]Al3+ = 0.54 limited alkali feldspars
Br- ↔ Cl- [VI]Br- = 1.96 [VI]Cl- = 1.81 complete KBr – KCl Coupled:
Na+Si4+ ↔ Ca2+Al3+ [VIII]Na+ = 1.18 [IV]Si4+ = 0.26
[VIII]Ca2+ = 1.12
[IV]Al3+ = 0.39 complete NaAlSiplagioclase 3O8 – CaAl2Si2O8
Ca2+Mg2+ ↔ Na+Al3+ [VIII]Ca2+ = 1.12 [VI]Mg2+ = 0.72
[VIII]Na+ = 1.18
[VI]Al3+ = 0.54 limited CaMgSidiopside – jadeite 2O6 – NaAlSi2O6
Among the coupled solid solutions there is a particular one that involves the filling of a site that is normally vacant. For example, in order to achieve the charge neutrality in the amphibole mineral tremolite, Ca2Mg5Si8O22(OH)2, when one Al3+ replaces for one of the Si4+
ions, then also Na+ is usually hosted into the site that is normally vacant (). The resulting
mineral is the so-called sodic amphibole, NaCa2Mg5AlSi7O22(OH)2.
► Interstitial solid solutions − Ionic substitutions of this type take place when atoms, ions, or molecules fill the interstices (voids that are not structural) found between the atoms, ions, or ionic groups of a crystal structure (Figure 1.4). The interstices may take the form of channel-like cavities in certain crystals, such as in the cyclosilicate beryl Be3Al2(SiO3)6. In this case,
potassium, rubidium, cesium, and water, as well as helium, are some of the large ions and gases
Figure 1.4. Carbon steel is an example of interstitial solid solution, where carbon fills the non-structural voids between
► Omissional solid solutions − Another less common way in which minerals or compounds can vary their composition is by omission solid solution, characterized by having structural vacancies that are not occupied by atoms. Examples are exhibited by the minerals wüstite Fe1-xO and pyrrhotite (Fe1-xS), both referred to have a defective structure. In pyrrhotite
for instance, cation vacancies result in a range of compositions from FeS and Fe7S8, the
overall charge balance in the structure being maintained by converting some of the Fe2+ ions
to Fe3+ (Putnis 1992).
1.2. From the additivity law of Vegard to the phenomenological
theory of Urusov
In an early application of X-ray diffraction to the analysis of crystal structure, Vegard (1921) observed that in many cubic ionic salts the lattice constant linearly scaled with the composition. This consideration found further confirms when Vegard and Dale (1928) proposed a same relationship for isomorphous compounds, which differ only in ionic substitution on a specific site. Since the begin of 1920's this empirical rule, now known as "Vegard's law", has become accepted by many as of general validity, and consequently employed in several scientific fields of mineralogy, metallurgy and materials science to extrapolate structural values in ideal binary solid solutions. At the same time, numerous deviations from this law are witnessed (e.g. Zen 1956; Denton and Ashcroft 1991; Urusov 1992). Vegard's law works well for many end-member compounds of isomorphous series, but intermediate compositions within a solid solution series often display more complex behaviour and deviations from this law usually become as bigger as higher is the structural complexity of the examined systems.
Studies on solid solutions increased as much as the importance of solid solutions grew, and both theoretician and experimentalist scientists started formulating a number of different theoretical approaches to describe and calculate structural relaxation, energetic and mixing properties of solid solutions, such as mixing energy, mixing volume, configurational and vibrational entropies, excess free energy and stability, i.e. solubility limits as a function of temperature and pressure (Urusov 2001). These theories are classified as:
● Semi-empirical phenomenological models; ● Semi-classical atomistic approaches; ● First principle (ab initio) calculations.
One of the widespread model used to calculate the structural relaxation occurring around a substituting ion along a solid solution is that based on the phenomenological theory formulated by Urusov (1992).
1.3. The concept of structural relaxation
In the last decades, several experimental studies have demonstrated that the stability of isostructural solid solutions, at the atomic scale, is affected by a structural relaxation around substituting cations (for example, Galoisy 1996; Langer 2001; Langer et al. 2004; Taran et al. 2004; Andrut et al. 2004; Gaudry et al. 2006; Juhin et al. 2007, 2008; Cruciani et al. 2009; Hålenius et al. 2010; Urusov and Taran 2011). As mentioned above, the formation of a solid solution, its compositional extent and its thermodynamic properties depend on the properties of the substituting ions, and on the intrinsic characteristics of the host structure in allowing atomic substitution at one or more structural sites (e.g. the way as the coordination polyhedra are connected to each other). Along a binary join, the information obtained by the "averaging" diffraction methods (i.e. the long-range properties) does not give any indication on the local distances between the central ion and its surrounding oxygen-based polyhedron (i.e. the short-range properties). The lack of such an information may be overcome by the use of spectroscopic methods. The spectroscopic technique used can concern the environment of a single atom as well as its first or second coordination shell or correlate lengths over hundreds of angstroms (Oberti 2001).
As a matter of fact, structural data achieved through diffraction methods along a solid solution usually obeys Vegard's rule, and both the lattice parameters and the average bond lengths might be found from the same addivity rule. For the hypothetic case of a AO–BO solid solution, with mean bond lengths A–O and B–O for the A and B end-members,
A1-xBx–O = (1-x) A–O + x B–O
= B–O - (1-x) (B–O - A–O)
= A–O + x (B–O - A–O) (1.1)
where x is the amount of the replacing cation.
As proposed by Urusov (1992), the deviation from Vegard's rule can be quantified, on a geometrical basis, through the relaxation coefficient (ε), as:
ε = (B–Ox - A–O) (B–O - A–O)-1 (1.2)
where the mean polyhedral distances A–O and B–O are measured by diffraction methods (e.g. single crystal X-ray diffraction, SC-XRD, or X-ray powder diffraction, XRPD), and B– Ox is the local mean distance for the sample A1-xBxO, with x→0 estimated by spectroscopy
(e.g. electronic absorption spectroscopy, EAS, or extended X-ray absorption fine structure spectroscopy, EXAFS).
Looking at both the equations 1.1 and 1.2, it appears obvious that the behaviour of exchanging cations in a solid solution falls between two extreme cases (see Figure 1.5). The assumption that all of the individual bond lengths in the mixed crystal are equal to their average values implies that the relaxation is completely absent (ε = 0). This case corresponds to the so-called virtual crystal approximation (VCA), and it means that B–Ox = A–O. Under another assumption, all the atoms in the solid solution preserve their initial size. This case
of full relaxation, instead, implies the hard sphere (HS) model (ε = 1) meaning that the Figure 1.5. Dependence of the individual bond lengths in a binary solid solution A1-xBxO according to different approaches. See text for
explanation. Real changes of the individual local bond length, B– Ox, is visualized by the black straight line between the VCA (ε = 0)
interatomic B–Ox distance will not change with composition: B–Ox = B–O. Therefore, the individual bond lengths are equal to the bond lengths found in the doped end-member (Urusov 1992, 2001; Wildner et al. 2004; Andrut et al. 2004).
1.4. Structural relaxation from electronic absorption spectroscopy
As already pointed out in the preface, the studies that will be presented and discussed in the third section of this dissertation are fundamentally based on the combined approach X-ray powder diffraction/electronic absorption spectroscopy with the purpose to calculate the structural relaxation coefficient along several kinds of solid solution. For this reason, in this paragraph is described the procedure to achieve the structural relaxation coefficient used in every solid solution reported afterward.
The most popular method to achieve the local metal–oxygen distances in a solid solution investigated through electronic absorption spectroscopy is by means of the crystal field parameter 10Dq, a measure of the length of a metal–oxygen bond related to the shift of the main optical bands of a transition metal ion (TMI) as a function of the amount of the TMI itself along a solid solution (e.g. Langer 2001; Langer et al. 2004; Taran et al. 2004; Cruciani et al. 2009; Hålenius et al. 2010). According to the crystal field theory (Dunn 1965, Burns 1993), for the previously adopted hypothetical AO–BO solid solution, the 10Dq value depends on the mean metal–oxygen bond distances by a relationship, that in the point charge approximation is close to the inverse fifth power of the mean distance B–O:
10Dq = 5/3 Q r4 B–O-5 (1.3)
where both the effective charge on the ligands Q and the average radius of d orbitals r can be considered constant for the same metal ion in the same ligand environment (Dunn 1965; Marfunin 1979; Burns 1993; Langer 2001). The latter equation 1.3 can therefore be simplified as:
The local ions–oxygen distance (i.e. B–Ox) achieved by optical spectroscopy can be determined by means of previous equations as:
B–Ox = B–Ox = 1 [(10DqB)x = 1 / (10DqB)x]1/5 (1.5)
Concluding, the so obtained latter value will lead to a easy calculation of the relaxation coefficient (ε) along the AO–BO solid solution by means of the equation 1.2. To remember, the relaxation coefficient ε is usually calculated as infinite dilution (i.e. ε, with x→0) of the metal ion in the solid solution (Langer 2001).
1.5. Technological perspective
Physical formalisms are able to explain in general colour of minerals and synthetic analogues, but some chromatic features are not fully understood in detail. An in-depth insight into the dependence of optical properties on the local structural environment of a given ion is essential to go beyond the current knowledge.
The industry of inorganic pigments is very static and, especially in the ceramic sector, a new viewpoint is needed to comprehend the behaviour of current pigments and to develop novel colorants.
For these reasons in the third section of the "Results and discussion" chapter two of the three works that are going to be presented are exclusively devoted to give the technological viewpoint of this dissertation.
2.
EXPERIMENTAL METHODS
2.1. Synthesis procedures
Materials under any kind of investigation can pertain to two categories: natural and synthetic. The samples, object of the studies that are going to be presented in the following chapter, have been obtained through synthetic routes; no natural samples (i.e. minerals) were employed. The almost totality of the obtained compounds were synthesized via solid-state reaction, the conventional synthesis of ceramic powders. Just in one case a different synthesis procedure was adopted (i.e. the sol-gel combustion synthesis in order to obtain the YAlO3−YCrO3 perovskite solid solution). The reason of such choices stems from the
following considerations:
(i) natural samples not always exist (for instance YCrO3 perovskite, AlNbO4 alumoniobite,
and Ba2MgSi2O7 melilite are exclusively synthetic compounds), and if available, they not
always provide a complete solid solution and/or the samples have a very heterogeneous chemistry (i.e. most of the constituent ions are partially replaced by isomorphs);
(ii) a synthetic route provides samples almost or fully monophasic, and guarantees a well defined stoichiometry, meaning that each consideration made over the chemical variation along a solid solution is more reliable;
(iii) the conventional solid-state reaction procedure is fast and, in most cases, good enough in terms of purity of the realized compounds and chemistry reliability. Furthermore, the choice of such a synthesis was made on the hypothesis of a direct industrial reproducibility, meaning that every sample previously "created" in laboratory could be successfully developed at industrial scale with no substantial loss of the product quality.
► Solid-state reaction − As already stated, the solid-state reaction between oxide and/or carbonate precursors is the conventional synthesis for multicomponent ceramic powders (Segal, 1997). The process of synthesis followed to prepare the samples, object of the studies reported in the next chapter, was performed through:
● wet mixing and homogenization by ball milling in acetone of high purity raw materials;
● drying in oven at 100 °C (Figure 2.1a); ● pulverization in agate mortar;
● pelletizing by using a piston cylinder press till ~80 MPa (Figure 2.1b);
● calcination in alumina crucible using an electric kiln in static air (Figure 2.1c) at maximum temperature of typically 1200 °C for several hours and with a heating rate of 3 °C/min, and natural cooling to room temperature.
Structure-type, stoichiometry, concentration of the substituting cations, number of sample(s) synthesized, temperature of calcination, and time of permanence at the maximum temperature in
the electric kiln of the compounds here studied are listed in Table 2.1.
Reiterated cycles of milling and calcination were sometimes necessary to improve the reaction yield and to minimize any possible occurrence of undesired phases (i.e. secondary or accessory phases) in order to achieve a unique, nearly monophasic, compound. In fact, a Figure 2.1. Main devices used during the synthesis process. (a) airing force oven (Nannetti); (b) piston cylinder press (Nannini); and (c) electric kiln (Naber).
oxides are introduced in small amounts during the synthesis of electroceramics (Segal, 1997). On the other hand, the ready availability of oxides as precursors and the low cost for powder production on the laboratory- and industrial-scale preparations, make the solid-state reaction one of the most used synthesis procedure.
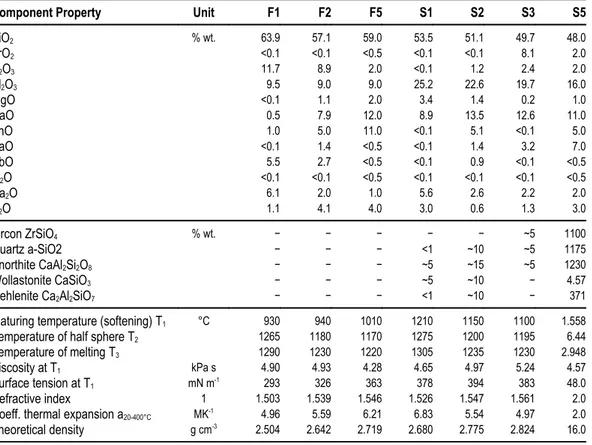
Table 2.1. Structure-type, stoichiometry, concentration of the substituting cations, number of sample(s), temperature of calcination, and hours of permanence at the maximum temperature in electric kiln of the compounds here studied and synthesized via solid-state reaction. In the last column (reference to work) is indicated the number of the corresponding work described in the next chapter.
Synthesized structure stoichiometry x (apfu) sample(s)no. of calcinationT (°C) permanencehours of workref.
YCr-perovskite YCrO3 − 1 1300 8 3.SI.A
alumoniobite (+Cr) (Al1-xCrx)NbO4 0, 0.06, 0.125, 0.25,0.375, 0.5 6 1200 8 3.SI.C
Sr-åkermanite − Ba-åkermanite (Sr2-xBax)MgSi2O7 0, 1, 1.5, 1.6, 1.75, 2 6 1200 6 3.SII.D
Ca- − Sr- − Ba-åkermanite (+Co) (x)2(Mg0.7Co0.3)Si2O7 Ca, CaSr, Sr, SrBa,
Sr0.5Ba1.5, Sr0.25Ba1.75 6 1200 6 3.SII.E
hardystonite − Co-åkermanite Ca2(Zn1-xCox)Si2O7 0, 0.25, 0.5, 0.75, 1 5 1300 24 3.SIII.G
hardystonite (+Co) Ca2(Zn1-xCox)Si2O7 0.05, 0.1, 0.2, 0.3, 0.4 5 1200 4 3.SIII.H
willemite (+Co) Zn2-xCoxSiO4 0, 0.05, 0.1, 0.2, 0.3 5 1300 3 3.SIII.I
► Sol-gel combustion − Samples belonging to the YAlO3−YCrO3 join [see the
first work in the first section of the following chapter, 3.SI.A] were prepared by sol-gel combustion, a technique combining the polymeric gel action with the fast combustion reaction, which is suitable to synthesize multicomponent systems in which the stoichiometry must be strictly maintained (Montanari et al. 2005). Seven samples were synthesized with an
increasing chromium content, in order to cover the YAlO3−YCrO3 join till the chromium
content of 0.75 apfu. The YCrO3 end member was differently achieved by means of a
solid-state reaction synthesis (see the former paragraph). Al(NO)3·9H2O, Y(NO)3·6H2O,
Cr(NO)3·9H2O, NH4NO3, anhydrous citric acid, NH4OH were used as precursors. The two
steps involved in this technique, xerogel formation and combustion, are described in details by Blosi and co-workers (2009). The combusted precursor, a black fluffy powder, was ball milled in ethanol for 24 h, sieved under 75 µm and calcined in electric kiln at 1300 °C in static air (200 °C/h heating rate, 4 h soaking time, natural cooling) in unsealed alumina crucible.
Figure 2.2. Effect on gel stability of the citrate-metal cations ratio. Stoichiometric ratio (a), stable and transparent gel achieved with an excess of citrate (b), and pictures of powders combusted at different temperatures: 300 °C (c) and 500 °C (d).
2.2. X-ray diffraction (XRD)
The use of the X-rays for crystallographic analysis is based on few basic principles:
(i) There are many types of secondary effects that occur when X-rays interact with matter (e.g. photoelectric and Compton effects), but the dominant effect is scattering (i.e. the fraction of the outcoming radiation that deviates from the incident direction without change in wavelength). In this process, an electron in the path of the X-ray beam vibrates with the frequency of the incoming radiation thus becomes a secondary point source of X-rays of the same energy as the incident X-X-rays.
(ii) In crystalline materials (i.e. single crystal or polycrystalline), some X-rays are scattered "in-phase", meaning that the amplitude scattered from a crystal is non-zero only in specific directions and at discrete sets of points spanning the reciprocal space. The phenomenon described by this "in-phase" scattered X-rays is called diffraction. The directions of possible diffractions depend only on the size and shape of the unit cell. Certain classes of diffraction are systematically extinct due to the occurrence of translational operations in the space-group (lattice centring, screws, and glides).
(iii) Size of periodic unit cell and atom arrangement in the crystal structure (i.e. bond distances and angles) can be established by measuring the angular relationships between the incident and diffracted X-rays, and by collecting the intensities of diffracted X-rays. Hence, the intensities of the diffracted waves depend on the kind and arrangement of atoms in the crystal structure.
In order to obtain essential information on the crystal structure of a material, the wavelength of the incident X-rays should be roughly similar to the interatomic spacing of the analyzed sample.
► X-ray powder diffraction (XRPD) − The expression "powder diffraction" denotes the phenomenon of diffraction of a specimen that is in the form of a polycrystalline powder. The X-ray powder diffraction method was developed by P. Debye and P. Scherrer (1916), and, marginally later, by A. Hull (1917) just four years after the discovery of the phenomenon of single-crystal diffraction made in 1912 by W. Friedrich, P. Knipping and M. von Laue and developed from 1912 by W. H. Bragg and his son W. L. Bragg (Paszkowicz 2006).
Despite its large potentialities, powder diffraction has been used for nearly half a century almost exclusively for quantitative or semi-quantitative phase analyses. After the Second World War, rapid progresses were made in terms of data speed collection and quality of results in response to the fast development of technology and instrumentation (e.g. automated diffractometers, goniometers, X-ray generator tubes, detectors...), and powder diffraction started to increase its popularity. However, the global view on the powder diffraction and its applications was revolutionized when, at the end of the 1960s, H. Rietveld devised a method to extract information on the crystal structure from neutron powder diffraction (NPD) data by refining a model against the whole diffraction profile (Rietveld 1967 and 1969). The Rietveld's idea arose at early days of the era of digitised data, and led to a computational method which yields information on the crystal structure of materials which cannot be prepared in the form of single crystals (Paszkowicz 2006). The method uses a least squares approach to refine a theoretical line profile until the measured profile is matched, and gives the exclusive possibility to extract structural information on the components of mono- or poly-phase materials. A decade later its appearance, the Rietveld method was re-designed and extended for X-ray studies [a more detailed description of the Rietveld method will be given in the next paragraph]. Nowadays, the most widespread use of powder diffraction include:
● the traditional application for phase identification of single- or multiple-phase materials, minerals, chemical compounds, ceramics or other engineered materials. A diffraction pattern is typically in the form of a graph of diffraction angle (or interplanar spacing)
against diffracted line intensity. The pattern is thus made up of a series of superimposed diffractograms, one for each unique phase in the specimen. Each of these unique patterns can act as an empirical "fingerprint" for the identification of the various phases, using pattern recognition techniques based on a file of standard single-phase patterns (Jenkins 2000);
● ab initio crystal structure determinations; ● Rietveld crystal structure refinements;
● the accurate quantitative phase analysis (QPA) by line intensity or the Rietveld method; ● quantitative determinations of microstructural properties such as lattice strain and residual
stress measurements;
● recognition of amorphous materials in partially crystalline mixtures; ● domain size and disorder;
● the analysis of textured samples;
● the kinetic and structural analyses of materials and reaction processes in situ at non-ambient conditions (i.e. high-temperature or high-pressure) also performed in real time, etc.
Many of these investigations are routinely performed in several academic or industrial laboratories, while the most cutting-edge applications still require the use of non-conventional radiation sources.
Laboratory X-ray diffraction suffers from limitations connected with restricted wavelength selection and slow data collection. On the hand, large scale facilities provide ultrahigh beam intensity, high coherence, high collimation, and infinitesimal pulse duration. Synchrotron laboratories significantly contribute to the physics and chemistry of condensed matter, to materials science, medicine, geology, etc. Diffraction techniques available at some specialised beam lines permit the investigation of samples of extremely small sizes for single crystals (studies of submicrometer-size crystals can be found in literature) and down to about five micrometers for powder samples. The latter opportunity is used, in particular, for diffraction at the highest accessible pressures (up to 300−400 GPa - i.e. at the conditions existing at any depth in the interior of the Earth (Paszkowicz 2006, and literature therein).
► Whole Powder Profile Fitting (WPPF) - the Rietveld method − The Rietveld method is based on the approach of the Whole Powder Profile Fitting (WPPF), i.e. all categories of observables (line position, line intensity, line profile, and background) are considered together in order to build a model which is then used to generate a full powder diffraction pattern. The (initial) calculated pattern is then compared to the observed pattern and modified by least square in order to minimize the differences between observed and calculated. This refinement procedure (hence, Rietveld refinement) is conceptually very close to the single-crystal structure refinement with a fundamental difference: instead of comparing the calculated and observed intensities of individual Bragg reflections (i.e. F2hkl,calc vs. F2hkl,obs),
in the Rietveld method the intensity of each ith point (yi,obs) at a given 2θi step in a powder
profile is modelled (i.e. yi,calc vs. yi,obs). The other important difference in powder data refinement, with respect to single crystal, is that the model must account for line position and profile broadening, and for the background. The function, which is minimized by least squares, can be expressed as:
N i ci oi i y w y y S 1 2 2.1where: yoi and yci is the observed and calculated intensity of the ith step, respectively; wi is the
weight according to the Poisson statistics (i.e. wi = 1/σoi2 = 1/yoi). The summation is over the N
measured datapoints in the 2θ region included in the refinement.
In the case of polycrystalline samples formed by a single phase, the calculated intensity at the ith step, y
ci, is obtained according to the formula:
HKL l k h hkl hkl hkl hkl B i hkl ci ci b S K O AE y 1 1 1 2 2 2.2 where:bci = background intensity calculated at the ith step;
S = scale factor = Ke Ks, in which:
- Ks = "sample" constant;
Khkl = can be defined as a structural constant of diffraction line (hkl) and depends on: - unit-cell volume,
- the structure factor of diffraction line corrected by the Debye-Waller factor and for anomalous scattering,
- multiplicity factor of diffraction line, - Lorentz-polarization factor;
Φ(2θi - 2θB)hkl = profile shape function which itself dependent on FWHM, peak asymmetry
and shape parameter(s);
Ahkl = absorption factor; Ehkl = primary extinction factor; Ohkl = preferred orientation factor. The summation to achieve the yci is calculated over all the HKL diffraction lines which may
contribute to the ith intensity step, according to the profile shape function.
In the case of a polycrystalline sample made of a multiphase mixture, the previous equation is modified to account for different phases; the calculated intensity at the ith step, y
ci, is expressed as:
phases HKL l k h hkl hkl hkl hkl B i hkl ci ci b S K O A E y # 1 111 ) ( ) ( ) ( ) ( 2 2 2.3where the definitions are very similar to those given for the previous formula, with the difference that most terms are also specific for each different phase present in the mixture, in particular the scale factor (Sα). The latter summation is extended to all the phases whose diffraction lines contribute to the intensity of the ith step.
Under the assumptions that the mixture is made of crystalline phases only (i.e. ∑jwj = 1), and being all phases considered in the refinement, the weight fraction of each phase is readily obtained from the refined scale factors (Sα), i.e.
j j j S S w 2.4The Rietveld quantitative phase analysis based on the latter equation is a truly standardless analysis and allows to overcome the limitations which are encountered with the quantitative phase analysis methods based on line intensities.
2.3. X-ray powder diffraction (data collection) at ambient condition
X-ray powder diffraction data were collected at room temperature using a Bruker D8 Advanced diffractometer (Figure 2.3, on the left) equipped with a Sol-X Si(Li) solid state detector set to discriminate CuKα1,2 radiation (Figure 2.3, on the right). Data collection
parameters for each series of compounds here studied is reported in Table 2.2, including: 2θ measuring range, step width, and counting time per step.
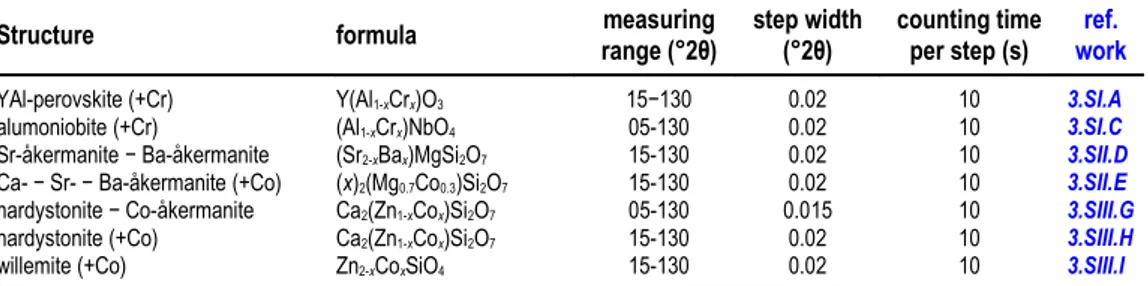
Table 2.2. Data collection parameters i.e. (2θ measuring range, step width, and counting time per step) for each series of compounds here studied. In the last column (reference to work) is indicated the number of the corresponding work described in the next chapter.
Structure formula range (°2θ)measuring step width(°2θ) counting timeper step (s) workref.
YAl-perovskite (+Cr) Y(Al1-xCrx)O3 15−130 0.02 10 3.SI.A
alumoniobite (+Cr) (Al1-xCrx)NbO4 05-130 0.02 10 3.SI.C
Sr-åkermanite − Ba-åkermanite (Sr2-xBax)MgSi2O7 15-130 0.02 10 3.SII.D
Ca- − Sr- − Ba-åkermanite (+Co) (x)2(Mg0.7Co0.3)Si2O7 15-130 0.02 10 3.SII.E
hardystonite − Co-åkermanite Ca2(Zn1-xCox)Si2O7 05-130 0.015 10 3.SIII.G
hardystonite (+Co) Ca2(Zn1-xCox)Si2O7 15-130 0.02 10 3.SIII.H
Figure 2.3. On the left, panoramic (top) and detailed (bottom) views of the Bruker D8 Advance diffractometer with a θ:θ Bragg-Brentano geometry settles at the department of mineralogy, petrology and geophysics of the university of Ferrara. On the right, detail of the Bruker Sol-XE energy dispersive X-ray Si-solid state detector (top) and external box of the X-ray tube (bottom).
► Rietveld refinement strategies for data collected at ambient condition − The structural refinements were accomplished by the Rietveld method (Young 1995) using the GSAS-EXPGUI software package (Larson and Von Dreele 1988; Toby 2001). The presence of impurity phases (if any) was accounted for by carrying out multiphase refinements in which only the scale factors and the cell parameters were varied for the minor
isotropic atomic displacement parameters, a shifted Chebyshev polynomial to reproduce the background (the number of the coefficients varied from 15 to 18), zero-point, a scale factor (or phase fraction, in the case of samples with presence of impurity phases). The diffraction peak profiles were modeled by a pseudo-Voigt function. The refined profile parameters included:
● the (θ)-independent Gaussian term (GW);
● (cosθ-1)- and (tanθ)-dependent Lorentzian terms (LX and LY, respectively);
● an asymmetry contribution due to axial divergence (asym).
The only exception is represented by the parameters used to fit the peak profiles of the samples belonging to the YAlO3−YCrO3 perovskite solid solution. Besides those previously
listed, further refined parameters were:
● (tan2θ)- and (tanθ)-dependent Gaussian terms (GU and GV, respectively);
● two terms to account for profile asymmetry due to axial divergence [S/L (S: sample size; L: distance between sample and detector) and H/L (H: detector height; L: distance between sample and detector)] instead of the unique term "asym";
● six additive terms for the anisotropic peak broadening (L11, L22, L33, L12, L13, and L23).
Table 2.3. Starting atomic model and their space group for the studied structure and their space group. In the last column (reference to work) is indicated the number corresponding to the work described in the next chapter.
Solid solution starting atomic model, space group (work reference) ref. work
Y(Al1-xCrx)O3 YAlO3, Pnma (Cruciani et al. 2009) 3.SI.A
(Al1-xCrx)NbO4 AlNbO4, C2/m (Greis et al. 1996) 3.SI.C
CrNbO4, P42/mnm (Petersen and Müller-Buschbaum 1992)
(x)2MgSi2O7 Ca2MgSi2O7, P-421m (Kimata and Ii 1981) 3.SII.D and 3.SII.E
Sr2MgSi2O7, P-421m (Kimata 1983a)
Ba2MgSi2O7, C2/c (Aitasalo et al. 1996)
Ca2(Zn1-xCox)Si2O7 Ca2ZnSi2O7, P-421m (Bindi et al. 2001) 3.SIII.G and 3.SIII.H
2.4. X-ray powder diffraction (data collection)
and Rietveld
refinement strategies at non ambient condition
► High pressure synchrotron data
collection − High-pressure X-ray powder
diffraction data of YCrO3 perovskite [see the
second work in the first section of the following chapter, 3.SI.B], and Sr2MgSi2O7 melilite-type
and Ba2MgSi2O7 melilite-related compounds [see
the second work in the second section of the following chapter, 3.SII.E] were collected in situ at the ID27 beam line (ESRF, Grenoble). Both the sample and the ruby grain for pressure calibration were loaded into a membrane-type diamond anvil cell (see Figure 2.4), with the gasket filled with helium and with a 4 : 1 methanol-ethanol mixture (for the perovskite and the melilite samples, respectively) as pressure-transmitting medium in order to achieve quasi-hydrostatic pressure conditions (Mezouar et al. 2005).
Diffraction patterns were collected using monochromatic X-rays (λ = 0.3738 Å) at room temperature, and both the sample-to-detector distance and detector tilt were calibrated using silicon. The pressure cell was allowed to relax for several minutes at each pressure. All patterns, collected on a Mar245 CCD detector (see Figure 2.5) till a maximum pressure of 60.4 and 11.2 GPa (for the perovskites and the melilite samples, respectively), were subsequently integrated over the full rings using the Fit2D program (Hammersley et al. 1996), masking all the Figure 2.4. Picture of a stylized diamond anvil cell (DAC).
(www.esrf.eu/AboutUs/Upgrade/science/extremeconditions).
Figure 2.5. Detail of a MAR-type CCD detector (in the image the model no. 225).
angle patterns. The intensity variation along each diffraction ring was used to estimate the statistical error of step counts. As mentioned above, the pressure was measured using the ruby fluorescence method (Forman et al. 1972), with estimated precision of ±0.05 GPa for the measured pressures.
● Notes on Rietveld refinement strategies (HP) − Refinement software, space groups and starting atomic parameters used to refine the structures at high pressure conditions were the same as those used for the refinements of the samples collected at ambient conditions (see Table 2.3). In the case of YCrO3 orthorhombic perovskite, the diffraction peak
profile was modeled by a pseudo-Voigt function with one Gaussian and one Lorentzian broadening coefficients. Besides the 15 shifted Chebyshev polynomial coefficients to reproduce the background, the refinement included a scale factor, the cell parameters, and the atomic coordinates.
In the case of Sr2MgSi2O7 and Ba2MgSi2O7 compounds, instead, the refinements included the
unit cell parameters and 20 Chebyshev polynomial coefficients to calculate the background function. The diffraction peak profiles were modeled by a pseudo-Voigt function with one Gaussian and two Lorentzian broadening coefficients plus a shift contribution.
► High temperature data collection − High temperature X-ray powder diffraction data of the monoclinic Ba2MgSi2O7 melilite-related
compound [see the third work in the second section of the following chapter, 3.SII.F] were performed in situ at the ISTEC-CNR laboratory of diffraction (Faenza). Data collection was carried out using a Bruker D8 Advanced equipped with a 1-dimensional LynxEye (Figure 2.6), and a hot chamber (MRI BASIC, see Figure 2.7) with a Type-S thermocouple (Pt/Pt10Rh). A small amount of the sample, previously mixed
with a 15% in weight of CeO2 (National Bureau
of Standards, Gaithersburg, Maryland, USA), was mounted on a Pt20Rh stage-heating element. Cerium oxide was selected as internal standard for temperature calibration because no peaks of its cubic lattice overlap with those of our sample, and because CeO2 is an extensively studied
material at high-temperature conditions, and the volumetric and lattice parameter thermal expansion are determined with extreme accuracy (e.g. Körner et al. 1989; Shuk and Greenblatt 1999; Sameshima et al. 1999; Mathews et al. 2000; Chavan et al. 2003; Chavan et al. 2004; and many others). The XRD patterns were recorded every 100 °C from ambient temperature to 1000 °C in air with a heating rate of 0.17 °C·s-1 in the
Figure 2.6. (on the top) Bruker D8 Advance diffractometer equipped with a 1-dimensional LynxEye detector; (on the bottom) Detail of the LynxEye detector based on a silicon strip technology (BRUKER Spec Sheet XRD 27).
● Notes on Rietveld refinement strategies (HT) − While the line positions in the powder patterns were accurately determined with the above experimental set-up, the measured line intensities were not accurate enough to allow a series of full structure refinements due to the "infinitively-thick sample" condition not being met. Therefore, the structural model refined for monoclinic Ba2MgSi2O7 at ambient conditions was used and kept
fixed for all the temperature steps of the high-temperature measurements. Besides the unit cell parameters, all Rietveld refinements included one Gaussian and two Lorentzian broadening coefficients of the pseudo-Voigt function to model the peak profiles, a sample-shift contribution to account for its changing height with respect to the focussing circle, and 20 Chebyshev polynomial coefficients to reproduce the background.
2.5. Coordination polyhedron variations under different conditions
(X, T, P): the distortion indices
A detailed description of a crystal structure must provide several pieces of information, the most significant are:
● space group (s.g.);
● unit-cell parameters (lattice, l, and volume, V); ● atomic coordinates (x, y, z);
● atomic displacement parameters (U, or B).
On the other hand, a stand-alone description of a crystal structure through the above listed parameters is often unfruitful; to consider a set of data in absolute terms is, most of the times, meaningless. Hence, in order to better describe and understand how a structure evolves with the variation of internal (i.e. chemical composition) or external (i.e. temperature and pressure) conditions, or how it could be related with structures having common features, a comparative analysis of data is done. The most widely reported continuous structural variation with composition, temperature and pressure are those associated with the unit-cell parameters (Hazen and Finger 1984). However, the most challenging comparisons are those related to the variations occurring in the coordination polyhedra (e.g. starting with bond lengths, M−O, and bond angle, M−O−M and O−M−O, variations) which, on the other hand, affect directly the optical properties (see paragraphs 2.6 and 2.7).
In order to help the comparison and, consequently, the description of such polyhedra variations, several indices of distortion and deviation from the geometrically regular starting form adopted from the literature. Those most used in this dissertation are illustrated below (other, less common or specific for a particular compound, are described in the proper sections).
► Quadratic elongation (λ) − this polyhedral distortion index is based of values of bond distances. λ is defined for tetrahedra, octahedra, cubes, dodecahedra, and icosahedra as:
n i i l l n 1 2 0 1 2.5where l0 is the centre-to-vertex distance of a regular polyhedron of the same volume, n is the
coordination number of the central atom, and li is the distance from the central atom to the ith
coordinating atom. Hence, a regular polyhedron will have λ = 1, whereas a distorted one will have λ values greater than 1 (Robinson et al. 1971; Hazen and Finger 1984).
► Bond angle variance (σ2) − calculated for the same kind of polyhedra as for the
previous index, the bond angle variance is defined as:
m i i m 1 2 0 2 1 1 2.6where m is (number of faces in the polyhedron) × 3/2 (i.e. number of bond angles), θ0 is the
ideal bond angle for a regular polyhedron (e.g. 90° for an octahedron or 109.47° for a tetrahedron), and θi is the ith adjacent bond angle. Hence, a regular polyhedron will have 2 =
0, whereas a distorted one will have values greater than 0 (Robinson et al. 1971; Momma and Izumi 2008).
In order to achieved a more detailed characterization of the internal distortion of a polyhedron other distortion indices can be adopted.
► Bond length distortion (BLD) − distortions occurring to the bond distances can be detected through the bond length distortion parameter (Baur 1974; Griffen and Ribbe 1979), defined as:
n i i O M O M O M n BLD 1 100 2.7where n is the coordination number of the central atom, (Mi−O) is the ith bond distance, and
M−O is the mean bond length.
► Edge length distortion (ELD) − similarly to the previous parameter the distortion related to the edge of a polyhedra is defined as:
n i i O O O O O O n ELD 1 100 2.8where n is the edges number of the polyhedron (e.g. in the case of an octahedron n = 12), (O−O)i is the ith edge length, and O−O is the mean edge length (Griffen and Ribbe 1979).
► Effective coordination number (ECoN) − The effective coordination number (Hoppe 1979; Hoppe et al. 1989) is defined as:
i i w ECoN 2.9where the quantity
6 1 exp av i i l l w 2.10
is called the "bond weight" of the ith bond. The variable lav represents a weighted average bond length defined as
i i i i i av l l l l l l 6 min 6 min 1 exp 1 exp 2.11where lmin is the smallest bond length in the coordination polyhedron, and li is the ith bond
distance.
2.6. Spectroscopic methods
levels (Putnis 1992). A wide range of phenomena (i.e. nuclear spin resonance, electron spin resonance, molecular rotations and vibrations, valence electron transitions, core electron transitions, and nuclear transitions) contribute to the energy of a material at temperatures above absolute zero, and it is usual to describe these individual phenomena as if they possessed distinct reservoirs of energy. Each phenomenon is then associated with a range of energy that varies from the ground state (i.e. zero energy) to the excited states (i.e. at higher energy). The energy range is expressed in terms of frequency or wavelength, related by the equation
E = h = hc/λ 2.12
where h is the Planck's constant (6.6 10-34 Js), c is the velocity of light (3 108 ms-1), is the
frequency (Hz or cycles/s) and λ is the wavelength (cms). E is the energy in joules.
The energy difference between ground and excited states cover the entire range of the
electromagnetic spectrum from radiofrequency (~106 Hz) to X-ray and γ-ray frequencies (up
to ~1020 Hz) (Putnis 1992).
► Electronic absorption spectroscopy (EAS) − Optical spectroscopy is concerned with qualitative and quantitative measurements of the absorption, reflection, and emission of light on matter in the spectral range from near infra-red, through visible, to ultra-violet. In the studies reported in the next chapter the measurement of the absorption spectra was performed by diffuse reflectance (R) then converted to absorbance (K/S) by the
Kubelka-Munk equation (Marfunin 1979; see Figure 2.9 caption). Among the many processes which contribute to the absorption spectra of investigated materials (e.g. ligand–metal and metal–ligand charge transfer, metal–metal charge transfer, color centers, band gap transitions and others), crystal field d–d transitions process plays a decisive role. The physical nature of this process is related to the transitions within the d (or f) states localized at cations and split by the crystal field due to surrounding ligands. The formalism developed to describe the latter process is termed crystal field theory (CFT).
Figure 2.9. Optical spectra of octahedrally coordinated Cr3+ in YCrO
3 perovskite structure. In the x-axis the wavenumber
(mathematically related to the energy, the wavelength, and the frequency), whereas in the b-axis the absorbance treated with the Kubelka-MunK function. Generally used for the analysis of diffuse reflectance spectra obtained from weakly absorbing samples, such polycrystalline samples, the Kubelka-Munk theory provides a correlation between reflectance and concentration of an absorbing species by:
K/S=(1-R)2(2R)-1
where, K = the absorption coefficient (i.e. the limiting fraction of absorption of light energy per unit thickness, as thickness becomes very small); S = the scattering coefficient (i.e. the limiting fraction of light energy scattered backwards per unit thickness as thickness tends to zero); R = reflectance.
► Crystal field theory (CFT) − Pioneered by Bethe (1929) and van Vleck (1932), the CFT is a model of chemical bonding applicable to transition metal and lanthanide ions, and it describes the origin and consequences of interactions between the d (or f) orbitals with the electrostatic fields originating from negatively charged anions or dipolar groups coordinating the central ion (Wildner et al. 2004, and literature therein). The most important problems solved by application of crystal field theory in geosciences include:
● concepts of colour and pleochroism;
● evaluation of thermodynamic properties of minerals influenced by CFSE (e.g. electronic entropy or enthalpy of mixing);
● mantle geochemistry of transition elements (e.g. polyhedral bulk moduli from high-pressure spectra, and phase transition);
● detection of structural details (e.g. cation ordering, and dynamic or static Jahn-Teller distortions).
The description of the interaction of the d (or f) electrons of a transition ion with the crystal field generated by the surrounding ligands requires background knowledge of quantum mechanics (QM). Basic idea on QM is shortly given in the following paragraph aimed to clarify some of the rule that govern electron systems.
● One-electron systems – Time-independent one-electron Schrödinger equation to describe the energy of a localized d electron is
HΨ = EΨ 2.13
where H is the Hamiltonian (i.e. the operator of the total energy of the system), and E is the total energy corresponding to the state Ψ under consideration. In the case of a d electronic configuration in a transition metal ion, the motion of the d electron referred to a spherical coordinate system (r, θ, φ) can be described by
,,
,,
2 2 2 r E r r eV m 2.14where the first term in the square brackets is the Hamiltonian in Eq. 2.13 and it represents the kinetic energy of the electron, where = h/2π is the Planck's number, m is the electron mass, and 2 is the Laplacian operator. The second term represents the potential energy of the d
electron due to the nucleus and all other electrons in the ion. In a spherical approximation and for a one-electron system (i.e. hydrogen atom) the former wavefunction can be solved as it follows (see an example in Figure 2.10):