FACOLTÀ DI SCIENZE MATEMATICHE FISICHE E NATURALI
BIOPHYSICS AND NANOSCIENCE CENTRE (CNISM)
CORSO DI DOTTORATO DI RICERCA SCIENZE AMBIENTALI – XXIII Ciclo
ADVANCED BIOPHYSICAL APPROACHES TO NANO-BIO-SENSING: POTENTIAL ENVIRONMENTAL AND BIOMEDICAL APPLICATIONS
BASED ON P53-AZURIN INTERACTION
(FIS/07)
Coordinatore:
Prof. Maurizio Petruccioli
Tutors:
Prof. Salvatore Cannistraro
Prof.ssa Anna Rita Bizzarri
Dottorando: Fabio Domenici
“What goes up must come down” Isaac Newton”
Riassunto
I recenti progressi nanoscientifici e tecnologici permettono oggi l’impiego di metodologie biofisiche avanzate ad elevato potenziale analitico in campo ambientale e biomedico. Infatti i peculiari fenomeni fisici che operano su scala nanometrica (per questo detti a campo vicino) possono essere rilevati e controllati per aumentare sensibilità e accuratezza diagnostica molecolare e di conseguenza il livello d’informazione utile nella prevenzione e cura di patologie umane e ambientali.
Particolare attenzione rivestono le metodologie ottiche di amplificazione di segnale basate sull’impiego dei plasmoni di superficie. La risonanza plasmonica superficiale (SPR) è una oscillazione della densità di carica indotta da una radiazione elettromagnetica che può aver luogo su superfici metalliche a contatto con un dielettrico costituito ad esempio da molecole organiche e proteine. La capacità di assemblare nanostrutture metalliche e molecole ha permesso di utilizzare le intense bande di diffusione e assorbimento, prodotte dai plasmoni di superficie sotto opportune condizioni di irraggiamento elettromagnetico, per trasformare tradizionali tecniche strumentali, quali la spettrofotometria Raman e di assorbimento UV-Visibile, in metodologie ultrasensibili note con il nome di Surface-Enhanced Raman Scattering (SERS) e Surface Plasmon Resonance (SPR).
La metodologia SERS sfrutta l’enorme incremento della sezione d’urto Raman (che può raggiungere un fattore 1010) subito da un analita quando sottoposto al forte campo elettromagnetico e al trasferimento di carica indotti dalla adiacente presenza di opportune nanostrutture metalliche irraggiate, quali nanoparticelle d’oro e argento.
La tecnologia SPR sfrutta invece l’eccitazione ottica dei plasmoni di superficie prodotta in opportune strutture planari, la cui energia di risonanza risulta altamente sensibile solo nell’intorno dielettrico a distanze nanometriche dalla superficie di eccitazione. Questo ha permesso di sviluppare una nuova tecnologia che consente di monitorare in tempo reale e quindi di acquisire accurate informazioni cinetiche e di equilibrio su complessi biologici con rilevanza biomedica e ambientale.
Recenti lavori hanno messo in luce la possibilità di coniugare i vantaggi di queste metodologie nanoscientifiche con quelli dei metodi bioanalitici basati sul riconoscimento molecolare specifico e selettivo, quali il tradizionale metodo ELISA, al fine di ottenere nuovi e più efficaci approcci bioanalitici.
A tale scopo, abbiamo considerato l’interazione fisica e funzionale tra la proteina umana p53 e la proteina batterica a trasferimento elettronico Azzurrina.
p53, descritto come “il guardiano del genoma”, rappresenta uno dei fattori di trascrizione più studiati con attività di repressore tumorale. In condizioni cellulari normali, la sua concentrazione e attività tumorale sono inibite principalmente mediante un meccanismo di regolazione mediato dall’interazione di p53 con l’ubiquitina ligasi Mdm2. In presenza di danni del DNA indotti da fattori chimico-fisici ambientali e biologici, p53 viene stabilizzato e attivato inibendo l’interazione con Mdm2, permettendo così l’espressione dei suoi geni target preposti alla riparazione del danno o all’apoptosi. p53 è direttamente coinvolto nella catena dei processi biochimici scaturiti da un danno al DNA e riveste quindi un ruolo importante come potenziale bioindicatore in grado di discriminare la presenza di alcuni agenti genotossici e patologie tumorali. p53 riveste anche un ruolo centrale nella realizzazione di nuovi farmaci in grado di stimolare la sua attività antitumorale.
Riguardo quest’ultimo aspetto è stato recentemente dimostrato che Azzurrina, membro della famiglia delle “blue copper protein”, può essere internalizzata preferenzialmente in cellule tumorali, dove induce apoptosi con efficacia verificata in vitro e in vivo. L’azione apoptotica di Azzurrina (Az) è concomitante alla formazione di un complesso con p53, che porta alla stabilizzazione di quest’ultimo, agendo quindi in apparente opposizione rispetto all’azione di down-regolazione indotta dal legame Mdm2-p53. Studi molecolari hanno evidenziato che l’interazione tra Az e p53 è stabile ma fino ad oggi le caratteristiche stereochimiche e cinetiche di tale interazione non sono state completamente chiarite, pur essendo importanti per la comprensione del meccanismo anticancro di Azzurrina.
Partendo da questi concetti, in questo lavoro abbiamo sfruttato le potenzialità analitiche di questa interazione per la rilevazione ultrasensibile di p53 mediante un nuovo metodo nano-bio-sensoriale basato sul fenomeno SERS e supportato anche dalla spettrofotometria UV-Visibile e dai metodi a scansione di forza quali la Microscopia a Forza Atomica (AFM). In particolare abbiamo analizzato l’intenso segnale SERS prodotto dalla coniugazione covalente di p53 e nanoparticelle d’oro (Np) utilizzando come linker il marcatore Raman para-amminotiofenolo (4-ATP), già impiegato con successo nella realizzazione di “substrati SERS”. Abbiamo quindi realizzato un substrato di cattura, utilizzando Azzurrina come proteina partner, sul quale abbiamo incubato il sistema p53-(4-ATP-Np) in condizioni fisiologiche. Seguendo le bande SERS caratteristiche del sistema p53-(4-ATP-Np), legato all’Azzurina, abbiamo rilevato p53 inizialmente presente a concentrazioni
subpicomolari, mettendo in evidenza che la metodologia utilizzata è ultrasensibile, rapida e di ampio respiro in ambito diagnostico.
Utilizzando la tecnologia SPR abbiamo studiato l’interazione Az-p53, rilevando i corrispondenti parametri cinetici e di affinità. Inoltre, allo scopo di fornire nuove informazioni riguardo al meccanismo di stabilizzazione di p53 in cellule tumorali, abbiamo valutato l’effetto della presenza di Azzurrina sull’interazione funzionale Mdm2-p53, utilizzando strutture proteiche intere nel loro corretto folding nativo. A tale scopo, abbiamo estratto le costanti di velocità di reazione dei complessi Mdm2-p53 e Az-p53, e li abbiamo comparati con quelle ottenute dall'interazione tra Azzurrina ed il preformato complesso Mdm2-p53, e tra Mdm2 ed il preformato complesso Az-p53. L’analisi ha rivelato che Azzurrina può legare p53 in maniera specifica e stabile senza subire variazioni cinetiche e di affinità significative anche in presenza di Mdm2, suggerendo quindi che Azzurrina ed Mdm2 non interagiscono con la stessa regione di p53. Questo risultato è stato confermato anche mediante studi competitivi eseguiti a livello di singola molecola utilizzando la Spettroscopia a Forza Atomica (AFS). Nonostante il sito di legame per p53 non sia lo stesso, quando Azzurrina lega p53 l'interazione tra Mdm2 e p53 viene significativamente influenzata poiché la costante di velocità di associazione tra le due proteine viene ridotta di più di 4 volte. Questo significa che Azzurrina può esercitare un’azione d’inibizione parziale del legame Mdm2-p53 attraverso un meccanismo a distanza che implica la formazione di un legame Az-p53 che può essere localizzato o sul dominio N-terminale di p53 ma in posizione distinta da quella preposta per l’interazione con Mdm2, oppure sul suo “DNA-binding domain” (DBD), come predetto da recenti lavori computazionali.
Inoltre sono state eseguite misure di dicroismo circolare allo scopo di verificare eventuali modificazioni strutturali indotte da Azzurrina sulla struttura di p53. Quest’indagine ha infatti evidenziato che p53 in presenza di Az è soggetta ad un aumento del 10% del folding secondario nativo. Ciò fa pensare che il meccanismo d’inibizione possa essere di tipo allosterico e suggerisce interessanti prospettive per la progettazione di farmaci in grado di riattivare le funzioni di repressore tumorale di p53, ad esempio nei tumori che sovraesprimendo Mdm2 mantengono inibita l’attività di p53.
Alla luce dei risultati ottenuti in questo lavoro, che hanno una rilevanza sia in campo diagnostico che terapeutico, crediamo che l’approccio nanoscientifico per la ricerca di analiti a bassissime concentrazioni possa realmente costituire uno strumento a tutela della salute umana.
Abstract
The availability of advanced methodologies, especially suited for sensitive and reliable screening of indicators of both environmental and human pathologies, is a crucial element for an effective early detection. For this reason, nanoscience and nanotechnology research combines efforts to improve environmental and biomedical diagnostic, often resorting to advanced biophysical approaches which have the potential to overcome detection limits of traditional methods. In particular, signal amplification methods, such as Surface-Enhanced Raman Scattering (SERS) and Surface Plasmon Resonance (SPR), are now entrenching in modern environmental and biomedical fields. By taking advantage of the peculiar optical properties of metal structures at the nanoscale, in fact, they offer the possibility of developing ultrasensitive nano-bio affinity assays.
Given the importance of health and safety in human society, considerable resources have been and are being expended in efforts to identify and classify human carcinogens, in order to reduce the risk of cancer. As the tumour suppressor protein p53 is directly involved in the chain of biochemical events that follow genotoxic damage, some researchers have tried to incorporate this information into testing protocols, evidencing a close correlation between the DNA damaging mechanism and the p53 induction pattern of a given chemical. Hence, p53 has a huge potential as a biological indicator of environmental conditions which threaten human health, and the novel biophysical approaches offer the adequate features to turn such p53 potential into novel, more accurate, quick and efficient methods to early screen substances for carcinogenicity.
In this connection, we have explored the analytical potential of advanced biophysical methods in an attempt to more deeply understand the improvement they can provide to traditional bio-affinity assays; successively, by means of these approaches, we have tried to reduce the detection threshold of the tumour marker p53.
To probe the presence of p53, we have used the blue copper protein Azurin (Az), whose physical interaction with the tumour suppressor has been recently proposed in connection with its demonstrated anticancer activity. By SPR, we have analysed the Az-p53 binding kinetics and ascertained the strong stability of their specific interaction even in presence of the protein Mdm2, which is one of the main regulators of p53; then we have exploited the specific interaction between Az and p53 to realize a novel SERS-based immunoassay detection method, made up by the synergic combination of SERS methodology and
bioaffinity assays. In this way it has been possible to strongly reduce the current detection limit for p53 down to levels which are appealing also for screening in human serum. The importance of investigating the Az-p53 interaction is not limited to analytical detection aspects. Indeed our SPR measurements performed on the proteins p53, Mdm2 and Az indicate that these three proteins are likely engaged in a ternary structure where the interaction of Az with p53 modulates the Mdm2-p53 binding kinetics. Since the tumour repression activity of p53 is mainly down-regulated by Mdm2, the latter result could provide an useful insight into the possibility of designing new anticancer drugs.
This thesis is structured as follows:
- A general introduction dedicated to the general aspects of plasmonics-based signal amplification methods for improving molecular detection of conventional biosensing techniques, with particular emphasis on the experimental strategies developed and optimized to study the Az-p53 complex and its actual application in environmental and biomedical fields.
- Materials, methods and experimental techniques chapter.
- Results and discussion concerning the use of localized plasmonic on the ultrasensitive detection of wild type p53, performed using a micro-Raman equipment, and supported by absorbance spectroscopy and atomic force microscopy measurements.
- Results and discussion concerning the use of surface plasmons waves for binding kinetics investigations of Az-p53 interaction, also in presence of Mdm2, by using the SPR equipment.
- General conclusions of the research activity and perspectives.
- An appendix concerning the Surface plasmons: physical principles and applications.
- An appendix dedicated to the principles and applications of atomic force microscopy.
Chapter 1: General introduction
1.1 Nanoscience and bio-sensing 1
1.1.1 Plasmonic based methodologies 3
1.1.2 Molecular recognition 5
1.2 Environmental and biomedical relevance of the proteins p53 and Az 8
1.3 Aim of the research 11
Chapter 2: Materials, methods and experimental thecniques
2.1 Proteins expression and purification 13
2.1.1 Proteins secondary folding by CD spectroscopy 14
2.1.2 Immunoprecipitation of p53 16
2.2 SERS-based plasmonic nano-bio-sensing of p53 17
2.2.1 Self-assembling of gold Nps with the Raman reporter 4-ATP 18
2.2.2 p53/4-ATP-Np conjugation 19
2.2.3 Glass functionalization 20
2.2.4 Protein sensing experiments 22
2.3 SPR detection of specific complexes made up of Az, p53 and Mdm2 22
2.3.1 p53-covered substrate preparation 22
2.3.2 SPR binding experiment 24
2.3.3 Kinetic analysis of the SPR sensorgrams 24
2.3.4 CD measurements of the Az-p53 complex 27
2.4 Instrumental description 27 2.4.1 MicroRaman spectroscope 27 2.4.2 UV-Vis spectroscope 29 2.4.3 AFM apparatus 30 2.4.4 SPR apparatus 31 2.4.5 CD spectroscope 32
Chapter 3: SERS based nano-bio-sensing for ultrasensitive detection of the
tumour suppressor p53
3.2 Experimental setup optimization 36
3.3 Results and discussion 37
3.3.1 Optical characterization of the p53-(4-ATP-Np) system 38
3.3.2 Az-assisted capture of p53 as revealed by SERS 41
3.3.3 Selective Az-p53 recognition in a human serum-like environment 44
3.4 Conclusions 47
Chapter 4: SPR detection of specific complexes made up of Az, p53 and
Mdm2
4.1 Introduction 48
4.2 Results and discussion 50
4.2.1 Binding kinetics of the Mdm2-p53 complex 50
4.2.2 Binding kinetics and secondary folding of the Az-p53 complex 52
4.2.3 Binding kinetics of the Az-p53-Mdm2 complex 54
4.3 Conclusions 58
Conclusions and perspectives
59
Appendix A: Physics of surface plasmons
A.1 SPR and metal surfaces 61
A.1.1 Surface plasmon dispersion equations 61
A.1.2 Excitation and surface plasmons 63
A.1.3 Surface Plasmon properties 65
A.1.4 Choice of experimental parameters 67
A.1.5 Enhancement of fluorescence and absorbance 69
A.2 SPR and metal nanoparticles 69
A.2.1 Raman and SERS spectroscopy 70
A.2.2 Detection based on SERS 73
A.2.3 LSPR Absorbance 75
A.3 Conclusions 76
B.2 Probe-sample interactions 79
B.2.1 Van der Waals forces 79
B.2.2 Electrostatic forces 80
B.2.3 Capillary and adhesive forces 81
B.2.4 The cantilever-tip probe 81
B.3 Imaging modes 81
B.3.1 Contact mode 82
B.3.2 Vibrating modes 82
B.4 AFM resolution and sensitivity 83
B.5 Combined AFM-SPR 84
B.6 Atomic force spectroscopy 84
References
86Acknowledgments
99List of publications
100CHAPTER 1
General introduction
1.1 Nanoscience and bio-sensing
A great deal of the biophysics efforts, aimed at improving analytical detection limits in environmental and biomedical fields, is addressed toward the development of novel signal-based amplification methodologies leading to high sensitive and information-rich diagnostic assays (Giljohann and Mirkin, 2009; Nel et al., 2009; Wang et al., 2010). It is known that the human exposure to environmental stress factors, such as physical-chemical pollutants, is one of the main causes of pathological effects, whose gravity can be directly correlated to the intensity and the duration of their promoting causes (Moore and Simpson, 1992). Therefore, the availability of advanced methodologies, especially suited to the detection of indicators of both environmental and human pathologies, at very low concentrations, is a crucial element for the diagnosis of a disease when it is not yet significantly advanced.
Beside more traditional spectrophotometric, chromatographic and electrochemical analyses, which have a quantitative threshold sensitivity of 10-6 M with 1% margin of error, in the last years new analytical methods have been developed, aimed at decreasing such a threshold sensitivity. The approaches used to reach this goal take advantage of either instrumental sensitivity improvement or biologically-based analytical detection methods (Van Emon et al., 1998). Since 1980s, biologically-based analytical techniques, employing the high molecular affinity and specificity of antibody-antigen interaction to identify and separate compounds, have gained favour in environmental detection (Van Emon et al., 1998). Consequently, the development of immunoassay methods has revolutionized many laboratories and fields of analysis (Van Emon et al., 1998; Soper et al., 2006). The most common immunoassay format in environmental analysis is the ELISA (Enzyme-Linked ImmunoSorbent Assay). Quantitation by ELISA usually overcomes the sensitivity, selectivity, and reduces costs of previously used methods (Van Emon et al., 1998; Soper et al., 2006). To date, it permits detection of environmental analytes down to 10-10 M concentration, allowing the screening and quantitative analysis of pesticides, including: alachlor, aldrin, atrazine, benomyl, chlordane and 2,4,5-T. However, the conventional bioaffinity-based methods, which can be used to reveal also many biological
indicators of human exposure to such pollutants or other toxic and carcinogenic agents, require multiple steps, sample pretreatments and long incubation periods, providing only a semi-quantitative assay (Kenny and Dunsmoor, 1983; Yang et al., 1998; Guihong et al., 2004).
Today, thanks to nanoscientific and technological progresses, we dispose of novel signal-based amplification methods by which it may be possible to further increase the molecular detection sensitivity (Giljohann and Mirkin, 2009). Nano-approaches take advantage of the physical phenomena that are prevalent in the matter interaction at the nanoscale, to promote, control and distinguish recognition events (Giljohann and Mirkin, 2009; Nel et al., 2009). In particular, the ability to engineer metal surfaces (especially nanostructures) and biological molecules has led to the rapid development of innovative biosensing strategies based on the peculiar optical properties of metal structures at the nanoscale, called ‘plasmonics’ (Polman, 2008).
Surface plasmons are optically induced oscillations of the free electrons at the surface of suitable metal substrates and metal nanostructures, in which the plasmonics can be excited, directed and manipulated in function of the metal composition, shape and dielectric environment (Polman, 2008). The attractiveness of plasmonics is that they can effectively confine the optical excitation in a nanoscale volume and thus mediate strong optical interactions within this volume (see also Appendix A). In particular, the Localized Surface Plasmon Resonance (LSPR) of noble nanoparticles exhibits strong absorption bands and scattering properties that are not present in the bulk metal. Thus, such phenomenon has opened the possibility of developing protein-modified sensors with detection limits that are many order of magnitude lower than those of techniques like ELISA (Aslan, 2005; Klein, 2007; Nel et al., 2009). With regard to this last point, the enormous benefits of combining both plasmonic and molecular recognition based methodologies has been explored by recent pioneeristic works, evidencing the strong impact they could provide within the field of environment and biomedicine.
At variance of applied plasmonics, other nanoscientific approaches such as near field force (Bizzarri and Cannistraro, 2010) and conductive scanning spectroscopies and microscopies (Choi et al., 2008), which allow to detect the presence and the interaction between single molecules, are not commonly considered as high-sensitivity methods (Giljohann and Mirkin, 2009) for environmental and biomedical screening. However, the methodologies based on Atomic Force Microscopy (AFM) (see Appendix B), when used in support of
plasmonic-based tools (Bizzarri and Cannistraro, 2009), may be useful to open new analytical strategies for improving both diagnostics and therapeutics.
1.1.1 Plasmonic based methodologies
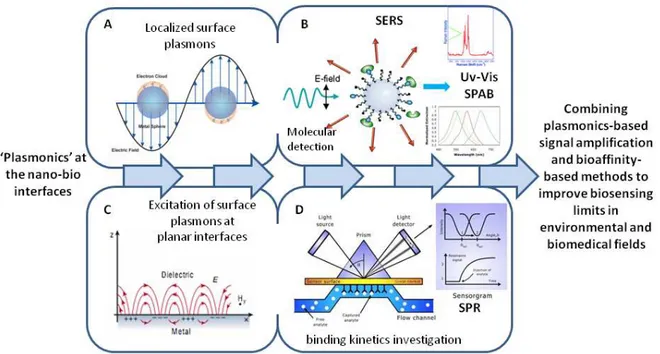
LSPR of noble nanoparticles exhibits strong absorption bands and scattering properties that are not present in the bulk metal. In particular, plasmon scattering cross section is responsible for the high increase of the Raman signal, achieved by Surface-Enhanced Raman Scattering (SERS) (Otto et al., 1992). In this phenomenon, which has been discovered quite recently, the optical properties of molecules placed in the vicinity of nanostructured metal surfaces are modified, causing an unusually large Raman cross section of analytes (see also paragraph A.2). It provides a strong increasing of conventional Raman detection sensitivity to an extent which depends on the chemical nature of the adsorbed molecules, the type of metal surface and its nature. The greatest enhancement occurs for molecules adsorbed on silver, gold or copper (Van Duyne et a., 1986). SERS allows circumventing many of the problems of conventional Raman vibrational spectroscopy (see paragraph A.2.1); indeed the sharp SERS signals obtained are molecularly specific, providing an easy way to discriminate from any broad background florescence, due to the non-adsorbed material, thus allowing in situ identification of specific analytes in a mixture (Fig. 1.1 panel A and B).
The large enhancements in Raman scattering can be substantially improved by coupling analytes to a metal so as to form systems able to give also a molecular resonance enhancement. With visible excitation, enhancements for SERS are often estimated as about 106 or slightly more, whereas enhancement for Surface Enhancement Resonance Raman Scattering (SERRS) as 1010-1011.
One of the major points in the application of SERS microspectroscopy for analytes detection is the preparation of metallic surfaces or media, called ‘SERS-active substrates’ or ‘SERS-active surfaces’, that have an easily controlled protrusion size and reproducible structures on the sub-micron scale.
Another peculiar point of this optical approach is the use of SERS labels, characterized by strong Raman bands, which are suitable to identify analytes at very low concentration. Analytical labelling procedures may reduce the accuracy of detection and limit the application fields of the SERS approach, but such drawbacks can be overcome by measuring the change of the plasmon oscillations at the metal surface due to the presence
Localized plasmon absorption cross section of gold nanoparticles is responsible for the appearance of intense and adsorbate-dependent Surface Plasmon Absorption Bands (SPAB) in the UV-Vis optical region (see Fig. 1.1 panel A and panel B) (Slistan-Grijalva et al., 2005) (theoretical details are reported in paragraph A.2.3). Due to their potential to detect the presence of adsorbed species when the surface coverage is one monolayer or less, plasmon absorption feature of nanoparticles has recently emerged as a useful tool for a variety of chemical and biological sensor relevant applications (Cooper, 2003; Homola, 2003).
Fig. 1.1. Surface Plasmon is a coherent electron oscillation that propagates along suitable metal
nanostructures (A) and planar substrates (C) together with an electromagnetic wave; derivatization of such metal surfaces with biomaterials provides nano-bio interfaces that improve molecular detection sensitivity and selectivity of conventional spectroscopies (B) and of bioaffinity-based assays (D).
Parallel to the studies of localized plasmonics in optical transmission and scattering geometries, Surface Plasmon Wavelength (SPW) propagation along noble metallic surfaces has been also recently employed by means of improved Surface Plasmon Resonance (SPR) equipments which are able to work in Attenuated Total Reflection (ATR) optical geometries (see Fig. 1.1 panel C and D). In such a configuration, SPR technology has gained a signal enhancement of up to about 40-times over the conventional absorption spectroscopies, becoming rapidly the most tremendous plasmon application in biochemical field (Wang et al., 2001; Cooper, 2002; Cooper, 2003). In a typical SPR experiment, a biomolecular recognition process can be followed in real time by registering
the time varying shift of the optical SPR angle which characterizes only the optical property of the region very close to the sensor surface, where the reaction occurs (see also paragraphs A.1.1 and A.1.3). Thus, SPR represents a strategic tool in protein-binding studies, especially suited for sensitive kinetic process investigations, in real time and without labeling procedures (Wang et al., 2001; Cooper, 2003).
1.1.2 Molecular recognition
A common event in living systems is the non-covalent binding of one or more molecules to a single macromolecule. A molecule bound to a macromolecule is called a ligand. In the cases usually studied, the ligand is a small molecule such as the substrate or a cofactor of an enzyme. The ligand may also be a macromolecule, as in the case of a regulatory molecule, such as a repressor protein binding to DNA. The study of ligand binding is important to understand the macromolecular mechanisms of action in regulatory systems which often require the knowledge of structural and kinetic features of the binding process, and it is also of special pharmacologic relevance to design novel clinical drugs.
There are many types of binding. For example, a molecule may have only a single or multiple binding sites. Experimentally the measurement of binding is straightforward, but in spite of this, interpretation of the data requires different modes of analysis that depend on various features of the binding process. However, if the binding of the ligand to one site does not affect the binding to the others, each single interaction can be treated as a simple one-to-one. If we consider this general and common case, the complex formation between two macromolecules P and A, at saturation one mole of P combines with one mole of A following the reaction:
PA A
P+ ↔ (1.1) The concentration of the different specimens at equilibrium provides information about the affinity of their interaction, as indicated by the law of mass action commonly expressed as follow:
[ ][ ]
[ ]
PA A P Kd = (1.2) Where Kd is known as the dissociation constant. In chemistry the equilibrium constant Ka=1/Kd is usually used whereas biochemists and molecular biologist prefer to use Kd as ameasure of the affinity level of the binding interaction.
complexes are in the range of 10-7-10-12 M, whereas those found for enzyme-substrate interactions are in the range of 10-1-10-6 M (Houk et al., 2003).
The equilibrium constants are related to the standard free energy (∆Go) of the reaction. If we consider the complex formation, the relation can be expressed as:
( )
a o K RT G =− ln ∆ (1.3) where R is the gas constant and T the absolute temperature. It means that more negative is the standard free energy, more favorable is the protein-protein association. The change in free energy is due to an interplay of entropic (S) and enthalpic (H) contributions, since:o o o S T H G =∆ − ∆ ∆ (1.4) Various factors play a role in defining these parameters for a given complex formation. Hydrogen bonding, electrostatic and van der Waals interactions complementarily at the binding interface give a contribute to the enthalpy, whereas burial of hydrophobic groups and conformational disorder affect the entropic term.
Additional insights are provided by the kinetic of a complex formation and rupture. Biological systems are not at equilibrium and, for this reason, it is particularly informative to know the rate of proteins binding and dissociation. The concentration of a complex depends on the velocities of its formation (von) and rupture (voff), as follows:
[ ]
[ ]
kon[ ][ ]
P A koff[ ]
PA von voff t d PA d − = − = (1.5)where kon and koff are the association and dissociation rate constants, respectively. They, in
fact, multiplied by the substrates concentration, give the velocities of the complex formation and dissociation. At equilibrium, these two velocities are equal, so that the concentration of the complex does not change (d[PA]/dt = 0). Under these conditions, by comparing equations (1.2) and (1.5), we can easily deduce that the rate constants are related to the dissociation constant by:
on off d k k K = (1.6) It implies that interactions may have similar affinity, while displaying different timescales. However, often the association rates do not vary very much among different kind of protein complexes, since they are mainly governed by unspecific factors. For reactants in solution, the association rate is especially influenced by their diffusion through the medium. Then, other elements, such as the relative orientation of the binding sites during the encounter and long-range forces, due to the charges on the reactants surface, can
contribute to define the association rates, most commonly found in the range of 104-108 M -1
·s-1 (Janin, 1995). Much effort has been exerted to measure association rates between receptors and ligands in solution (three-dimensional kon). More recently, different
techniques involving atomic-force microscopy, surface plasmon resonance and fluorescence measurements, have also yielded quantitative information on association rates between surface-bound molecules (two-dimensional kon). It is now well-recognized that
relating association rates measured in solution (i.e., three-dimensional conditions) to the behavior of membrane-bound receptors (i.e., two-dimensional reactions) is difficult.
To deal with this problem it has been recently suggested (Robert et al., 2009) that in addition to conventional kon it is possible to define the probability of bond formation
between a ligand and a receptor maintained at binding distance during a sufficiently short time interval of duration t, thus extracting the minimum contact time for bond formation. In this respect a single-bond formation in two-dimensional reactions could be modeled as a multi-kinetic trap resulting in different threshold contact times.
Nevertheless, for a correct binding data extrapolation in a two dimensional binding experiment both transport process of flow and diffusion should be taken into account to figure out the net analyte flux (Myszka et al., 1998). In particular, binding of analyte to the immobilized ligand is in principle a two step event. First, the analyte is transferred out of the bulk solution towards the ligand surface. Second, the binding of the analyte to the ligand takes place. The first step is also known as mass transfer (and is carried out by convection and diffusion). Both events have their own rate constants. The coefficient for mass transfer kt, which describes the first one, is the same in both binding and unbinding
directions of the reaction. A common operative model used for kinetic investigations is explained in paragraph 2.3.3.
By contrast, the rates of dissociation are stringently dependent on the properties of the interaction, like the shape and electrostatic complementarity of the binding interface, and the number and strength of the bonds holding the proteins together.
It means that the dissociation rate constants of protein complexes, falling within 103-10-7 s -1
(Janin, 1995), are the main responsible in defining the equilibrium dissociation constant, (and thus the affinity), and in turn the life-time (1/koff) of protein-protein interactions. This
is because protein dissociations need the overcoming of an energy barrier. The dissociation rate constant, in fact, depends on the activation energy ∆G* of the reaction, as follow:
−∆ = T k G A k B off * exp (1.7) where A is the Arrhenius prefactor, kB the Boltzmann constant and T the absolute
temperature. It indicates that higher is the energy barrier, slower is the complex dissociation.
As mentioned, many biological molecules have more than one binding site. In this latter case the binding sites are considered interactive when the occupation of one site influences, by a cooperative mechanism a second site. In particular, many cellular processes are mediated by allosteric protein interactions (Hilser, 2010). In this latter case, binding of the first ligand molecule A (often called effector) alters the shape of the protein P and this results in a change of the site where a further ligand B may interact. In other words, upon binding A, the protein P undergoes a binding affinity modulation of the further PB complex formation. Allosteric mechanisms can be figured out by two different theoretical approaches called symmetric (or concerted) model and sequential model. Both models follow the assumption that:
(1) each protein P exists in two forms, usually called (T) and (R), able to bind a ligand with low and high affinity, respectively;
(2) if a ligand molecule is firmly bound to a subunit of a protein P, that subunit must be in the (R) form.
In the concerted model it is assumed that:
(1) (T) and (R) forms of the P protein are in equilibrium, (2) significant binding only occurs to the (R) form,
(3) the binding between P and the effector ligand A shifts the equilibrium strongly in the (R) direction.
In contrast, the sequential model assumes that binding tends to occur first in the (T) state of P, thus inducing the conformational transition in the (R) state.
1.2 Environmental and biomedical relevance of the proteins p53 and Azurin
p53, “the guardian of the genome”, is probably the most extensively characterized transcription factor with a tumour-suppressor activity (Toledo and Wahl, 2006). It consists of four main domains which are responsible for its transcriptional activation, DNA-binding and tetramerization functions (Fig. 1.2) (Veprintsev et al., 2006).
Fig. 1.2. Functional domains of the protein p53. TA = trans-activation domain (residues1-50); PR =
proline-rich domain (residues 61-94); DB = DNA-binding domain (residues 97-300); T = tetramerization domain (residues 324-352); R = regulatory domain (residues 363-393).
Thanks to its tumour suppressor role, p53 has been intensely investigated to understand the network regulating cell proliferation, also with the intent of optimizing anti-cancer strategies. Indeed, mutations in TP53 that compromise p53 function occur in 50% of human cancers, and the alteration of regulators of p53 occurs in many of the remainder. For example, the MDM2 gene, which encodes a ubiquitin ligase, is amplified in at least 7% of all cancers without concomitant TP53 mutation (Toledo and Wahl, 2006).
When DNA damage is sensed by the cell, the p53 level rises and the protein binds to sequence-specific regulatory sites in the genome, thereby inducing the expression of genes that control the DNA repair and interrupting the cell growth until the damage is repaired; on the other hand, if the damage is too severe, p53 triggers the apoptotic cascade (Vogelstein et al., 2000; Lavin and Gueven, 2006). In other words, after the exposure of cells to DNA-damaging agents such as γ and UV irradiation, heat shock, genotoxic drugs and nutrition deprivation, the repair mechanism is induced by an increase in p53 level (see Fig. 1.4). For example, the presence of well note atmospheric carcinogen pollutants as polycyclic aromatic hydrocarbons or nitric oxide free radical (Hofseth et al., 2002), can lead to an increase in p53 levels in a number of animal or cell systems. More particularly, a close correlation between the DNA damaging mechanism and the p53 induction pattern of a given chemical has been shown (Yang et al., 1998), even evidencing the capability to discriminate between genotoxins and non-genotoxins, as both direct- and indirect-acting genotoxins of environmental interest.
The level of p53 is thought to be mainly down-regulated by post-translational modification mediated by the oncoprotein Mdm2, whose direct association with p53 promotes its ubiquitination and proteolysis (Freedman et al., 1999); although this, potent pollutants can exert a cancerogenic activity in human cells through the inhibition of p53 accumulation which is not associated with down-regulation mediated by Mdm2 (Mukherjee et al., 2006). Hence, p53 has a huge potential as a biological indicator of environmental conditions which threaten human health, although the main challenge for employing such a p53 potential consists in overcoming detection limits of traditional methods such as Western
Likewise, in biomedical field, the improvement of p53 detection sensitivity is of special interest to the early oncologic diagnosis, since its tissue and serum level estimation has been associated with the tumour invasiveness and prognosis on patients with various malignant diseases (Shurbaji et al., 1995; Zusman et al., 1996; Shimada et al., 2000; Malviya et al., 2004; Psyrri et al., 2007). Moreover the existence of wild-type p53 in a significant fraction of human tumours has stimulated the search for a new class of agents to selectively activate it. In this last context, recent in vivo and in vitro studies (Yamada et al., 2002; Yamada et al., 2004) have demonstrated that the blue copper protein Azurin (Az) (Fig. 1.3) is an exogenous vector with the capabilities to bind p53, and inhibit cancer cell proliferation, likely through a post-translational increasing of p53 level.
Fig. 1.3. Three-dimensional structure of azurin. The yellow ball represents the copper atom, while the
residues coordinating it are depicted as green balls and sticks. At the opposite side the balls and sticks represent Cys3-Cys26 involved in the disulphide bridge (S-S) of the protein.β1- β8 = β-strands, H = α-helix,
HP = hydrophobic patch.
The specificity and the stability of Az-p53 interaction has been demonstrated by Dynamical Force spectroscopy (DFS) and SPR analysis (Taranta et al., 2008a; Funari et al., 2010; Domenici et al., 2011).
These results suggest that Az can be chosen as a protein probe for bioaffinity-based p53 detection, with several advantages with respect to the use of p53 antibody. Indeed, Az structure exhibits high stability under a wide range of physico-chemical conditions (Adman, 1991), and it has resonance Raman fingerprint bands (Bizzarri et al., 2008) which allow to discriminate its presence (in the wild-type folding) in detection processes.
Fig. 1.4. Environmental and biomedical application based on the Az-p53 interaction: detection of p53 in
response to genotoxic environmental agents (panel A); investigation of the Az-p53 tumour repression activity (panel B).
1.3 Aim of the research
Signal improving methods based on plasmonics are now entrenching in modern environmental and biomedical fields (Wang et al., 2010), thus opening to the possibility of providing new anticancer strategies. For this reason, particular attention has been devoted to the monitoring and the exploration of the interesting physical and functional interaction between Az and p53 (See Fig. 1.4 panel A and B). Indeed p53 is a sensitive biological indicator of both tumour promoting environmental agents and human pathologies and can be recognized by Az even enhancing its tumor suppressor activity in cancer cells.
Thus, we have explored the analytical potential of both scattering and absorption optical properties of plasmonics, in an attempt to more fully understand the effective improvement they can provide to biosensing techniques that use optical radiation, such as Raman or absorption-based spectroscopies. We have used the SERS methodology also combined to AFM, providing an approach to improve the detection limit of the tumour marker p53 recognized by Az. This proof of concept study lays the foundations for the development of innovative experimental procedures for an ultrasensitive, easy and rapid screening of many different molecules of environmental and biomedical interest.
Moreover, by the innovative SPR technology, we have studied the binding kinetics of the Az-p53 interaction in the attempt to provide new insights about the anticancer action of Az (See Fig. 1.4 panel B), and have also investigated the Az potentiality to interfere with the binding of p53 to Mdm2, the latter playing a key role in lowering the intracellular stability of p53. Our results provide new details useful to design anticancer drugs for the treatment of those tumors in which p53 has retained its wild-type structure and function.
Moreover, the present study provides a further evidence that the nano-bio-sensing strategies may be widely applied in the future, for a more comprehensive risk assessment for the environment and human health.
Chapter 2
Materials, methods and experimental techniques
2.1 Proteins expression and purification
Az was purchased from Sigma-Aldrich (St. Louis, Mo), dissolved in PBS 50 mM buffer (pH 7.2) and used without further purification. A characteristic spectral absorption ratio of 0.48 at 630 nm and 280 nm was found for Az solution, indicating a good degree of purity of the protein corresponding to a stable oxidized form (Guzzi and Sportelli, 1992).
Glutathione S-transferase (GST) fusions of human Mdm2 (kindly provided by A.L. Haas, LSU Health Sciences Center, New Orleans, LA, USA) and human wild-type-p53 (kindly provided by G. D’orazi and S. Di Agostino, National Cancer Institute “Regina Elena”, Rome, Italy) were expressed in log phase Escherichia coli BL-21 that had been grown overnight at room temperature, diluted 1:20 in fresh Luria-Bertani medium containing 50
µg/ml ampicillin at 37°C with vigorous shaking. Isopropyl-1-thio-β-D-galactoside (IPTG) was added to a final concentration of 0.4 mM when the OD600 reached 0.4-0.8 value. Bacteria were harvested 3 hours after addition of IPTG by centrifugation at 5000 rpm for 10 min. Cell pellets were resuspended with NENT buffer (Tris 20 mM at pH 8.0, NaCl 100 mM, EDTA 1 mM and NP40 0.5%), proteases inhibitors, phenylmethylsulfonylfluoride (PMSF) 1 µM and lysozyme and lysed by sonication. The sonicate was clarified by centrifugation at 4°C for 15 min at 5000 rpm and stored at -80°C. Levels of expressed GST fusion proteins were estimated by incubating sonicates with glutathione-Sepharose (GS) beads (Sigma), washing, and quantification by SDS-PAGE followed by staining with Comassie Brilliant Blue R-250. Known amounts of bovine serum albumine (BSA) were used as standards. Cleavage of the GST portion was achieved by digestion with thrombin CleaveClean kit (Sigma) according to the manufacturer’s instructions. Yields of the GST-purified proteins were 0.3 mg of GST-p53 and 2.3 mg of GST-Mdm2 per 10 g wet culture. Additional p53 amount was obtained after thrombin cleavage of commercial p53-GST purchased from Millegen (Labège, France).
The GST- and thrombin-purified proteins were separated by SDS-PAGE and analyzed by densitometry (Fig. 2.1). All thrombin-cleaved preparations were of ≥ 95% homogeneity.
Fig. 2.1. Purity of p53 and Mdm2. Recombinant wild-type glutathione S-transferase (GST)-p53 and -MDM2
proteins (10 µg each) purified from lysates with glutathione beads (lane 1) and after purification with thrombin digestion (lane 2) were separated on 10% and 8% SDS-PAGE for p53 and MDM2, respectively, and stained with Comassie brilliant blue. The GST-proteins and the purified ones are highlighted by the arrows along molecular mass markers scale (kDa) in the gel pictures.
The correct conformation of the obtained proteins was assessed by Circular Dichroism (CD) and immunoprecipitation techniques (Funari et al., 2010).
2.1.1 Proteins secondary folding by CD spectroscopy
The folding of the proteins was checked by characterizing their secondary structure through CD studies. CD measurements on p53 and Mdm2 protein solutions were performed using a JASCO J-715 spectropolarimeter, equipped with a 0.1 cm path length and thermal controlled quartz cell. CD spectra were recorded at 25oC in TST buffer at pH 7.2 (50 mM Tris buffer with 150 mM NaCl and 0.1% Triton x 100) and at 0.50 µM proteins concentration obtained by quantitative dilution of the mother solution to prevent protein aggregation contributions.
All spectra were the average of ten repeats obtained by collecting data from 250 nm to 190 nm at 0.5 nm intervals, at a rate of 50 nm/min with a response time of 2 s for each point. p53 and Mdm2 CD profiles are shown in Figs. 2.2 and 2.3, respectively. The experimental patterns acquired in millidegrees of ellipticity θ, were corrected by solvent subtraction and converted to mean residue ellipticity [θ]MRW. The predicted content of secondary structure was calculated using the CD spectra deconvolution software CDSSTR (Whitmore and Wallace, 2004), with a normalized root mean square deviation value of 0.01. The best fit values of both proteins are summarized in Tab. 2.1.
190 195 200 205 210 215 220 225 230 235 240 245 250 -2,7 -1,8 -0,9 0,0 p53 0.5*10-6M [ θ ]MR W ( d eg c m 2 d m o l -1)* 1 0 5 wavelength (nm)
Tab. 2.1. Secondary folding of full-length p53 and Mdm2, extracted from CD spectra by CDSSTR software.
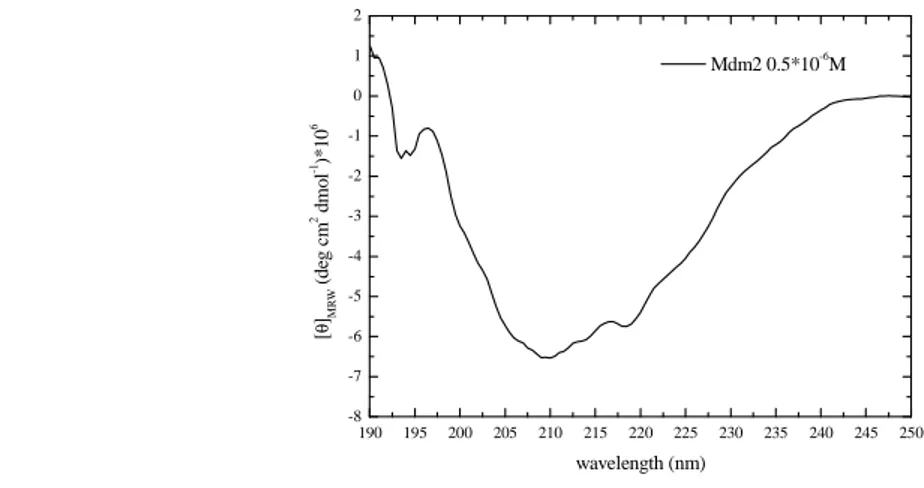
The high percentage values of unordered structure indicate the presence of large unfolded regions, as described in the literature for wild-type p53 and Mdm2 (Bothner et al., 2001; Bell et al., 2002; Dawson et al., 2003). p53 and Mdm2 are classified, in fact, as intrinsically unstructured proteins with a percentage greater than 45% of residues predicted to be unfolded (Iakoucheva et al., 2002).
Fig. 2.2. Far-UV CD spectrum of p53 protein (0.5 µM) in TST buffer, as measured by a Jasco J-715
spectropolarimeter. The spectrum was corrected for buffer contribution.
Fig. 2.3. Far-UV CD spectrum of Mdm2 protein (0.5 µM) in TST buffer, as measured by a Jasco J-715
spectropolarimeter. The spectrum was corrected for buffer contribution.
Secondary structure [%] p53 Mdm2 α-Helix 16 24 β-Sheet 30 20 Unordered 54 56 190 195 200 205 210 215 220 225 230 235 240 245 250 -8 -7 -6 -5 -4 -3 -2 -1 0 1 2 Mdm2 0.5*10-6M [ θ ]MR W ( d eg c m 2 d m o l -1)* 1 0 6 wavelength (nm)
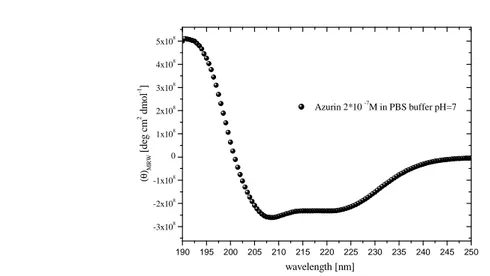
Fig. 2.4. Far-UV CD spectrum of Az protein (0.5 µM) in TST buffer, as measured by a Jasco J-715
spectropolarimeter. The spectrum was corrected for buffer contribution.
The CD spectrum of Az dissolved in PBS (pH 7.2) is shown in Fig. 2.4. According to the literature (Leckner et al., 1997), the data analysis (Alfa-helix = 36% Beta strand = 43% Random coil = 21%) confirms the wild type structure of Azurin.
2.1.2 Immunoprecipitation of p53
The conformation of p53, produced through the GST-method, was studied by immunoprecipitation technique, using two conformation-specific antibodies, as follows. GST-p53 (1 µg) was purified with thrombin cleavage (Sigma), diluted in immunoprecipitation buffer (10 mM Tris-HCl pH 7.6; 140 mM NaCl; 0.5% NP40; plus proteases and phosphatases inhibitors) and immunoprecipitated overnight at 4°C with the conformation-specific monoclonal antibodies PAb1620 (wild-type specific) or PAb240 (mutant specific) (Gannon et al., 1990; Legros et al., 1994), both from Calbiochem, preadsorbed to protein G-agarose (Pierce, IL, USA).
Fig.2.5. Immunoprecipitation of p53 with conformation-specific antibodies. Equal amount of thrombin
purified p53 (1 µg) was immunoprecipitated with PAb1620 (for folded, wild-type conformation) and PAb240 (for unfolded, mutant-conformation) and analyzed by Western immunoblotting with FL393 polyclonal anti-p53 antibody. The representative bands of at least two independent experiments are shown.
190 195 200 205 210 215 220 225 230 235 240 245 250 -3x10⁸ -2x10⁸ -1x10⁸ 0 1x10⁸ 2x10⁸ 3x10⁸ 4x10⁸ 5x10⁸ Azurin 2*10 -7M in PBS buffer pH=7 ( θ )MR W [ d eg c m 2 d m o l -1 ] wavelength [nm]
Immunocomplexes were collected by centrifugation, separated by 10% SDS-PAGE, and blotted onto PVDF membrane. Immunoblotting was performed with rabbit polyclonal anti-p53 (FL393, Santa Cruz Biotechnology) antibody and revealed by enhanced chemiluminescence system (ECL, Amersham, IL, USA) in accordance with the manufacturer’s instructions.
As expected, purified p53 was exclusively in wild-type conformation as shown by the reactivity with PAb1620 antibody (Fig. 2.5) and therefore suitable for wt-p53 activity, such as DNA binding.
2.2 SERS-based plasmonic nano-bio-sensing of p53
Gold nanoparticles (NPs) solutions, containing 4.5·1010 particles/ml of 50 nm diameter, were purchased from Ted-Pella (Reading CA). 4-aminothiophenol (4-ATP) was purchased from Sigma-Aldrich (St. Louis, MO). Water used for these experiments was purified by MilliQ Reagent water system (Millipore, Billerica, MA).
According to the green chemistry, protocols have been conceived by using greener solvent alternatives which not only minimize solvent waste but also improve laboratory safety. The steps followed in the preparation of the functionalized gold NPs are divided into two steps (1 and 2), briefly sketched in Fig. 2.6 in accordance with paragraphs 2.2.1 and 2.2.2, respectively.
Fig. 2.6. Principal chemical reactions in the preparation of functionalized gold NPs: 4-ATP-Np and
2.2.1 Self-assembling of gold Nps with the Raman reporter 4-ATP
Gold NPs coated with the bifunctional linker ATP were prepared by the dissolution of 4-ATP in absolute ethanol (0.5 mg/ml) (Jiao et al., 2005), and mixed in a equal volume of the gold NPs mother solution. The obtained solution was incubated at 20oC for 3 hours.
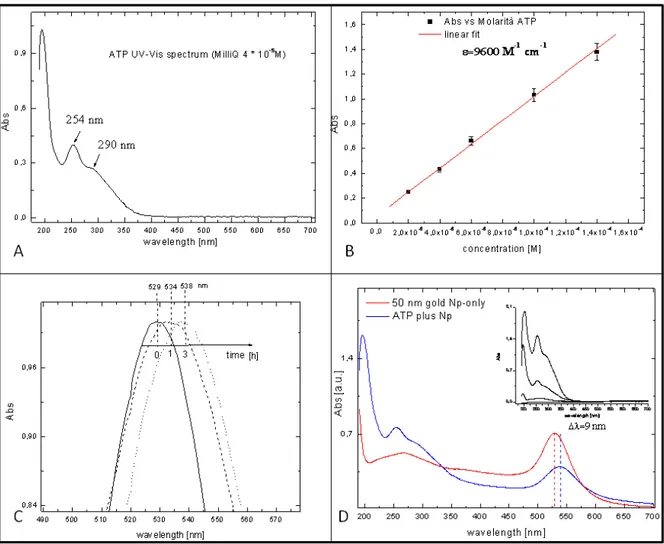
We have checked the quality of the samples and followed step by step the functionalization procedure by UV-Vis absorption and Raman spectroscopies (for details see Chapter 3). The UV-Vis spectra of the 4-ATP linker is shown in Fig. 2.7, panel A and B, whereas those of the gold nanoparticles alone and conjugated with 4-ATP are shown in Fig. 2.7, panel C and D.
Fig. 2.7. Sample checking by UV-Vis measurements has shown: for 4-ATP the characteristic UV profile
characterized by the pecks at 254 and 290 nm (panel A); while the extrapolated molar extinction coefficient of 4-ATP is reported in panel B; SPAB shift of 50 nm gold nanoparticles in function of time of 4-ATP incubation is shown in panel C; In panel D is reported the resulting UV-Vis spectrum of dialyzed water solution of 4-ATP-Np (blue profile) with respect to that of the gold nanoparticle alone (red profile); whereas in the insert of panel D shown is the absorbance decreasing of the excess of 4-ATP coming out during dialysis process.
The spectra are consistent with the previous reports on the quality and the success of the linking strategy.
The kinetic of 4-ATP-Np binding to Nps has been followed until no wavelength shift of the characteristic localized SPR absorption peak of NPs was observed (see Fig. 2.7, panel C). Moreover, in order to both remove the unbound 4-ATP and to promote the ethanol to milliQ water solvent exchange after incubation the solution was dialyzed by means of dialyzer membrane (purchased from SPECTRA/POR(R) irradiated dispdialyzer(R)), with Molecular Weigh Cut Off (MWCO) of 100 kD. The presence of 4-ATP in the fluid out-coming from the membrane has been monitored, as reported in the inset of Fig. 2.7 panel D. The influence of pH on the experimental protocol has been checked and the better yield has been obtained at pH 6.0.
2.2.2 p53/4-ATP-Np conjugation
We have employed the diazo coupling chemistry for the covalent linking proteins, such as p53, onto gold nanoparticles exposing the aromatic amino compound 4-ATP.
The process is based on the reaction called diazotization, discovered by Peter Griess in 1858, and widely applied as a valid biomolecular immobilization strategy since 1970 (Wu et al., 2006). Diazotization consist of forming diazonium compounds, i.e phenyldiazonium cation (Ph-N+≡N:), mainly through the treatment of aromatic amines (such as 4-ATP) with
sodium nitrite in the presence of a mineral acid such as HCl, as follows: Ph-NH2 + NaNO2 + 2HCl Ph-N+≡N: Cl- + 2NaCl + 2H2O.
In aqueous solution these salts are unstable at temperatures higher than 5°C; the -N+≡N
group tends to be lost as N2 nitrogen gas, in favour of a carbocationic arrangement (i.e. Sandmeyer reaction). In general, the diazonium salt behaves as an electrophile, but it is a weak electrophile and so the aromatic ring which it attacks must have attached to it an activating group such as -OH or -NH2. Therefore, according to the Pauly reaction, such a stable intermediate can induce the azo coupling with the solvent exposed hymidazolic ring of histidine and the phenol group of tyrosine residues of proteins (Phillips et al., 1965). The covalent coupling is assured by the formation of -N=N- chromophore, which provides a characteristic red azo-dye.
Although either strong or medium acidic environmental is required for the nitrosating agent formation (Ciapponi et al., 1987) the attempts performed at elevated acidity (pH 1.0) on 4-ATP-Nps have caused the complete dissolution of gold nanoparticles, whereas the
200µl of dialyzed 4-ATP-Nps solution were converted in diazonium-Nps by slow dropping of 200 µl of NaNO2 0.1 M, previously mixed with HCl until pH 3.0 was reached. The nitrosating agent was formed maintaining the solution in an ice box for 15 minutes. Before reacting with proteins, the solution was dialyzed in d.d. ice-water to remove the excess of electrolytes (see Fig. 2.8). The diazotization of the 4-ATP-Nps was checked by adding phenol molecules and waiting for the formation of a red-dye (Ciapponi et al., 1987).
After having neutralized the diazotated 4-ATP-Nps solution, a p53 solution ranging from 10-9 to 10-13 M was added to allow diazo-coupling reaction, and kept under
gentle stirring for 2 hours at 0-4oC. As described in the previous step the product was dialyzed to remove any unbound protein,
thus obtaining a solution containing only the protein-(4-ATP-Np) conjugated system in PBS buffer (pH 7.2) (see Fig. 2.6). The success of the reaction was witness by Raman and Absorbance spectroscopy (see Chapter 3).
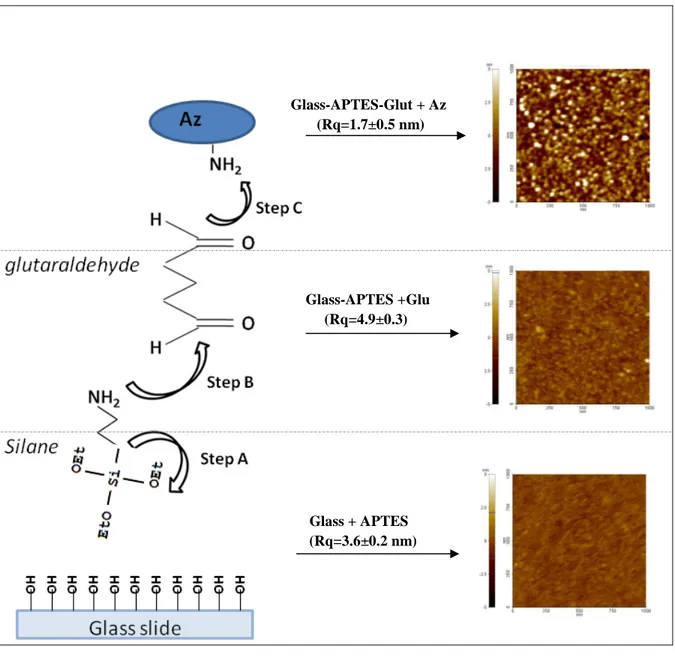
2.2.3 Glass functionalization
The steps followed in the capture substrates preparation are briefly sketched in the left side of Fig. 2.9.
Step A: Either UV or phirana solution (30% H2O2/70% H2SO4) treatments (Crass et al., 1999; Halliwell et al., 2001) were used to clean substrates and activate their hydroxyls groups. Subsequently, activated surface were incubated for 30 minutes at 20oC with 3-Amino-Propyl-TriEthoxy-Silane (APTES) dissolved in 2-propanol (only at 8% to avoid polymerization between free silanol groups prior to their condensation onto the glass slides) to obtain uniform coatings (Park et al., 1999; Li et al., 2001; Halliwell et al., 2001). After incubation, glass surfaces were thoroughly rinsed with 2-propanol, and beaked at 110oC for 10 minutes to induce the cross-linking of free silanols (see the left side of Fig. 2.9), thus increasing both stability and activity of APTES-modified surfaces (Park et al., 1999).
Step B: Subsequently, these APTES-modified glasses were reacted with a 2%
glutaraldehyde solution for 30 minutes at room temperature and washed thoroughly with MilliQ water.
Fig. 2.8. Diazotization and dialysis
of 4-ATP-Np solution occurring below 4oC
Step C: Substrates were than incubated with a 10-5 M Az solution (PBS buffer pH 7.2), over night at 4 oC.
The same protocol was followed also to adsorb p53 and p53 mixed with Human Serum Albumin (HSA) (from Sigma–Aldrich) onto the glass slides (see Chapter 3).
Glass-APTES-Glut + Az (Rq=1.7±0.5 nm) Glass-APTES +Glu (Rq=4.9±0.3) Glass + APTES (Rq=3.6±0.2 nm)
Fig. 2.9. Schematic sketch of the reaction steps of protein-modified glass substrate and the corresponding
AFM analysis in fluid condition are shown in the left and in the right side of the picture respectively.
Each step of the glass functionalization was checked by AFM measurements record in tapping-mode in water (cantilever force constant, k = 0.5 N/m) (see the right side of Fig. 2.9).
2.2.4 Protein sensing experiments
The protein-covered substrates were incubated for 3 hours at room temperature with the corresponding protein partner previously conjugated to (4-ATP-Np) in PBS buffer solution (pH 7.2), allowing the Az-p53 interaction. Then the substrates were washed with PBS buffer to remove the unbounded protein-(4-ATP-Np).
Tapping-mode AFM images in air (cantilever force constant, k = 0.5 N/m) were recorded by a Park XE-100 multimode scanning probe microscope by scanning several different areas of the sample. The typical scan rate was 1 Hz.
Raman and SERS spectra were recorded in air at 20oC by Labram confocal setup (Jobin-Yvon) equipped with a Peltier-cooled CCD detector and a single-grating spectrograph (1800 gr/mm) allowing a resolution of 5 cm-1 and a 16 bit dynamic range. The microscope objectives were 100x with a numerical aperture of 0.9 producing a laser spot size of about 1µm in diameter. The source was a He-Ne laser (Melles Griot) providing a 632.8 nm radiation with a power emerging from the objective of 6.5±0.5 mW. Preliminary investigation were performed also by using a similar LabRam setup equipped with a green (514 nm)laser source. The irradiation procedure was optimized in order to maximize the signal to noise ratio of the SERS measurements (see Chapter 3).
Optical absorbance and difference absorbance spectra were recorded at room temperature by a double beam Jasco V-550 UV/visible spectrophotometer by using 1-cm path length cuvettes and 0.5 nm bandwidth. The investigated spectral range was 190–800 nm.
Detailed information concerning the instrumental equipment employed are reported in paragraph 2.4.
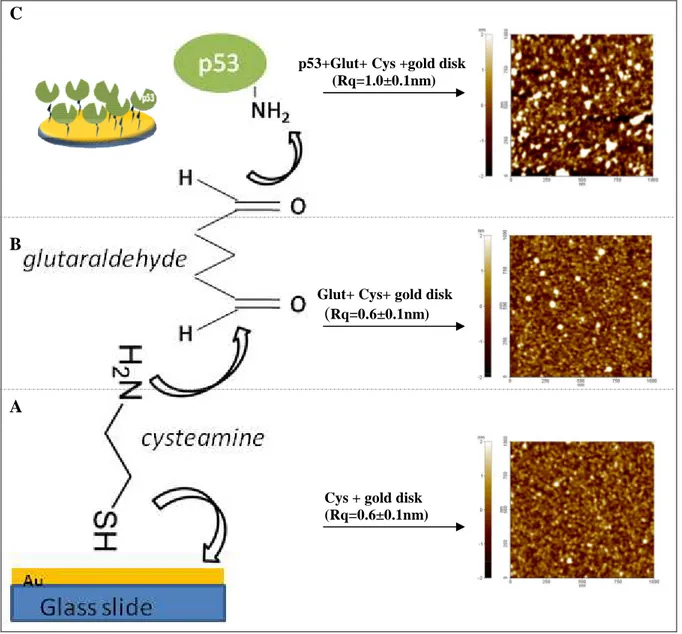
2.3 SPR detection of specific complexes made up of Az, p53 and Mdm2 2.3.1 p53-covered substrate preparation
The planar gold SPR sensor disks for the protein immobilization were purchased from Xantec Bioanalytics (GmbH Munster, Germany). These gold substrates were immersed in an ethanol solution of cysteamine (0.2 mM, Sigma) for 3 hours at room temperature (RT), then washed with ethanol and dried under a stream of nitrogen. The modified substrates were incubated with 250 µl of 1% glutaraldehyde (Sigma) solution in milliQ water for 10 minutes at RT, rinsed carefully with milliQ water and dried with nitrogen. Then, 250 µl of 1.2 µM p53 protein in TST buffer (pH 7.2) were dropped on the amine-reactive surface and incubated over night at 4°C. Next day the substrate was gently washed with PBS (pH 7.2) and stored in PBS buffer at 4°C. A covalent binding between the glutaraldehyde linker
and the exposed NH2 groups of p53 leads to the protein immobilization in the required multi-oriented binding configuration, maintaining at the same time some reorientational freedom to facilitate biorecognition and avoiding denaturation due to direct contact of the protein with the gold surface (Fig. 2.10, left side).
C
p53+Glut+ Cys +gold disk (Rq=1.0±0.1nm)
B
Glut+ Cys+ gold disk
(Rq=0.6±0.1nm)
A
Cys + gold disk (Rq=0.6±0.1nm)
Fig. 2.10. Schematic sketch of the reaction steps of p53-modified SPR substrate and the corresponding AFM
analysis are shown in the left and in the right side of the picture respectively.
Tapping-mode Atomic Force Microscopy (AFM) images in fluid (cantilever force constant k = 0.5 N/m) were recorded by means of a Park XE-100 multimode scanning probe microscope during the different steps of the sample preparation and shown in Fig. 2.10, right side.
2.3.2 SPR binding experiment
By following the time varying SPR angle shift due to binding molecular processes occurring at the sensor surface in real time, it is possible to measure the association and dissociation kinetics of the interaction.
In order to confirm the nature of the protein-protein interaction and regenerate the sensor surface after every binding cycle, we evaluated the use of regeneration solutions at different pH and ionic strength (Andersson et al., 1999). Among them, a 0.5 M NaCl solution at pH 5.0 has resulted the most effective for disassembling the Mdm2-p53 interaction, although subsequent massive loss of the p53 substrate binding capacity was observed, likely due to partial p53 denaturation (Ano Bom et al., 2010). Thus SPR binding studies were conducted by injecting the interacting protein on untreated p53 substrate portions and the homogeneity of p53 deposition was checked by AFM (see Fig. 2.10). Further control experiments and reference subtraction were performed to exclude any possible unspecific binding contribution.
Regarding the experiments on the ternary complex, 2 µM Az in PBS solution (pH 7.2) or 2 µM Mdm2 in TST solution (pH 7.2), was incubated on the overall p53-covered substrate for 3 hours at 25oC, and saturation of the p53 binding site was checked on each investigated area by SPR measurements. To check that the saturation condition is maintained also during the sensorgrams acquisition, further SPR control experiments have been performed, by mixing the protein injected with that used to saturate the p53-modified sensor disk (2 µM of Az or Mdm2) (Domenici et al., 2011).
SPR sensorgrams ere pointed out using a SPR Kretschmann type spectrometer Autolab Esprit (Eco Chemie, Utrecht, The Netherlands). Further instrumental details are reported in paragraph 2.4.
2.3.3 Kinetic analysis of the SPR sensorgrams
A series of response curves collected with different protein concentrations injected over the same binding surface may be fitted simultaneously using the global analysis approach. Indeed, by fitting all data at the same time, information arising from each sensorgram are combined. As a result, global analysis provides a better test of the model and improves the statistical behaviour of the parameter estimates. Global analysis (Morton and Myszka, 1998) of the SPR sensorgramswas performed by using simultaneous nonlinear regression fit procedure derived from a reversible bimolecular interaction model (see also Chapter 1, paragraph 1.1.2):
where A is the receptor injected in the flow chamber, B is the ligand immobilized on the surface of the SPR sensor disk and AB is the product of the specific interaction.
From this model, the following differential rate equations can be derived to determine the association (kon, M-1 s-1) and dissociation (koff, s-1) rate constants for protein-protein binding
interaction: association: [ ] k [A][B] k [AB] dt AB d off on − = (2.1) dissociation: [ ] k [AB] dt AB d off = − (2.2)
Because the reaction rates in the flow chamber may be limited by the rate of protein diffusion from bulk solution to the sensor surface, the fitting procedure also takes into account the mass-transport limit effects (kt, M-1 s-1) (Myszka et al., 1997):
(2.3) Thus, the following system of differential rate equations were used to describe this reaction across the sensor surface:
(2.4)
(2.5)
(2.6)
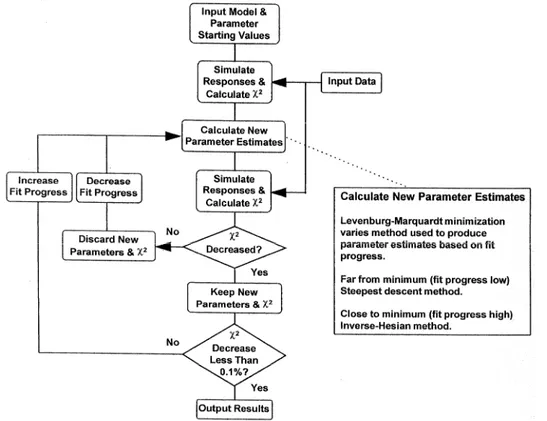
In such model, the concentration of analyte in bulk flow ([Ao]) is assumed to be constant during the association phase and zero during the dissociation phase. The concentration of analyte at the sensor surface ([A]) is zero at the start of the reaction. The kinetic analysis was performed by Clamp biosensor software (Morton and Myszka, 1998). Clamp combines numerical integration and non linear curve-fitting routines. It is designed to interpret complex interactions recorded on biosensors by simultaneously analyzing association and dissociation phase data measured on different surfaces or in different experiments. The flow chart in Fig. 2.11 demonstrates how the program works. To begin
B A A kt o←→ + ←koff AB B A+ kon→ 0 ] [ = dt A d o ] [ ] ][ [ ]) [ ] ([ ] [ AB k B A k A A k dt A d off on o t − − + = ] [ ] ][ [ ] [ AB k B A k dt AB d off on − =
an analysis, the user inputs data, loads a reaction model, and enters reasonable starting values for the unknown parameters. The program will automatically generate a series of differential rate equations based on the model and will integrate them numerically to simulate a set of response curves using a semi-implicit extrapolation method. This method is capable of handling stiff sets of differential rate equations. These occur when two reactions take place with very different rates and, when not treated properly, may cause instability in the integration. After simulated data are generated, they are subtracted from experimental data in order to calculate the χ2. The initial estimates for the rate constants are then adjusted to minimize the χ2 using a Levenburg-Marquardt nonlinear minimization algorithm. If the new estimates do not reduce the χ2, they are discarded, the fit progress is decreased, and another set of parameter estimates is chosen. Estimates that decrease the χ2 are kept and the fit progress is increased. The simulation and minimization process is repeated until the change in the χ2 is less than 0.1%. The parameter values, along with their linear approximation standard deviations and correlation coefficients, are output in a results table.
Thus, the quality of the fits shown in Chapter 4 was judged by the residuals and the normalized chi square (χ2) of the fitting model. In addition, the validity of the obtained rate constants was assessed by simulating data with identical ratio values of the rate constants and varying koff and kon values.