ScienceDirect
Available online at Available online at www.sciencedirect.comwww.sciencedirect.com
ScienceDirect
Structural Integrity Procedia 00 (2016) 000–000
www.elsevier.com/locate/procedia
2452-3216 © 2016 The Authors. Published by Elsevier B.V.
Peer-review under responsibility of the Scientific Committee of PCF 2016.
XV Portuguese Conference on Fracture, PCF 2016, 10-12 February 2016, Paço de Arcos, Portugal
Thermo-mechanical modeling of a high pressure turbine blade of an
airplane gas turbine engine
P. Brandão
a, V. Infante
b, A.M. Deus
c*
aDepartment of Mechanical Engineering, Instituto Superior Técnico, Universidade de Lisboa, Av. Rovisco Pais, 1, 1049-001 Lisboa, Portugal
bIDMEC, Department of Mechanical Engineering, Instituto Superior Técnico, Universidade de Lisboa, Av. Rovisco Pais, 1, 1049-001 Lisboa, Portugal
cCeFEMA, Department of Mechanical Engineering, Instituto Superior Técnico, Universidade de Lisboa, Av. Rovisco Pais, 1, 1049-001 Lisboa, Portugal
Abstract
During their operation, modern aircraft engine components are subjected to increasingly demanding operating conditions, especially the high pressure turbine (HPT) blades. Such conditions cause these parts to undergo different types of time-dependent degradation, one of which is creep. A model using the finite element method (FEM) was developed, in order to be able to predict the creep behaviour of HPT blades. Flight data records (FDR) for a specific aircraft, provided by a commercial aviation company, were used to obtain thermal and mechanical data for three different flight cycles. In order to create the 3D model needed for the FEM analysis, a HPT blade scrap was scanned, and its chemical composition and material properties were obtained. The data that was gathered was fed into the FEM model and different simulations were run, first with a simplified 3D rectangular block shape, in order to better establish the model, and then with the real 3D mesh obtained from the blade scrap. The overall expected behaviour in terms of displacement was observed, in particular at the trailing edge of the blade. Therefore such a model can be useful in the goal of predicting turbine blade life, given a set of FDR data.
© 2016 The Authors. Published by Elsevier B.V.
Peer-review under responsibility of the Scientific Committee of PCF 2016.
Keywords: High Pressure Turbine Blade; Creep; Finite Element Method; 3D Model; Simulation.
* Corresponding author. Tel.: +351 218419991.
E-mail address: [email protected]
Procedia Structural Integrity 12 (2018) 3–8
2452-3216 2018 The Authors. Published by Elsevier B.V.
This is an open access article under the CC BY-NC-ND license (http://creativecommons.org/licenses/by-nc-nd/3.0/)
Peer-review under responsibility of the Scientific Committee of AIAS 2018 International Conference on Stress Analysis. 10.1016/j.prostr.2018.11.112
10.1016/j.prostr.2018.11.112 2452-3216
© 2018 The Authors. Published by Elsevier B.V.
This is an open access article under the CC BY-NC-ND license (http://creativecommons.org/licenses/by-nc-nd/3.0/) Peer-review under responsibility of the Scientific Committee of AIAS 2018 International Conference on Stress Analysis.
Available online at www.sciencedirect.com
ScienceDirect
Structural Integrity Procedia 00 (2018) 000–000
www.elsevier.com/locate/procedia
2452-3216 © 2018 The Authors. Published by Elsevier B.V.
This is an open access article under the CC BY-NC-ND license (http://creativecommons.org/licenses/by-nc-nd/3.0/) Peer-review under responsibility of the Scientific Committee of AIAS 2018 International Conference on Stress Analysis.
AIAS 2018 International Conference on Stress Analysis
Fatigue life evaluation of car front halfshaft
C. Barone
a, R. Casati
b, L. Dusini
b, F. Gerbino
b, E. Guglielmino
c, G. Risitano
c*, D.
Santonocito
caUniversity of Modena and Reggio Emilia, Department of Sciences and Method for Engineering, Via Amendola 2, 42122 Reggio Emilia, Italy bMaserati S.p.a., Via Emilia Ovest 911, 41123 Modena, Italy
cUniversity of Messina, Department of Engineering, Contrada di Dio, 98166 Messina, Italy
Abstract
The present paper is the result of the collaboration between the Engineering Department of Messina University and the car company Maserati S.p.A. The aim of this paper is to determine the T-N torsion fatigue curve at R= -1 of the mechanical system "front halfshaft" of an existing car. In particular, experimental fatigue tests were carried out in the laboratories of the Engineering Department of the University of Messina. Torsion fatigue tests of the entire mechanical system were carried out on 15 different front halfshafts. Evaluations of the crack propagation and of failure analysis were made to determine the causes of breakage. In conclusion, the T-N fatigue curve of the mechanical system "front halfshaft" has been obtained.
© 2018 The Authors. Published by Elsevier B.V.
This is an open access article under the CC BY-NC-ND license (http://creativecommons.org/licenses/by-nc-nd/3.0/) Peer-review under responsibility of the Scientific Committee of AIAS 2018 International Conference on Stress Analysis. Keywords: car halfshaft; fatigue assessment; reverse engineering.
1. Introduction
Halfshafts are among the most important component of a car power transmission because they deliver the torque from the differential to the wheels. They are composed by a spline shaft coupled with a fixed joint at one end and a
* Corresponding author. Tel.: +39 347 3209239.
E-mail address: [email protected]
Available online at www.sciencedirect.com
ScienceDirect
Structural Integrity Procedia 00 (2018) 000–000
www.elsevier.com/locate/procedia
2452-3216 © 2018 The Authors. Published by Elsevier B.V.
This is an open access article under the CC BY-NC-ND license (http://creativecommons.org/licenses/by-nc-nd/3.0/) Peer-review under responsibility of the Scientific Committee of AIAS 2018 International Conference on Stress Analysis.
AIAS 2018 International Conference on Stress Analysis
Fatigue life evaluation of car front halfshaft
C. Barone
a, R. Casati
b, L. Dusini
b, F. Gerbino
b, E. Guglielmino
c, G. Risitano
c*, D.
Santonocito
caUniversity of Modena and Reggio Emilia, Department of Sciences and Method for Engineering, Via Amendola 2, 42122 Reggio Emilia, Italy bMaserati S.p.a., Via Emilia Ovest 911, 41123 Modena, Italy
cUniversity of Messina, Department of Engineering, Contrada di Dio, 98166 Messina, Italy
Abstract
The present paper is the result of the collaboration between the Engineering Department of Messina University and the car company Maserati S.p.A. The aim of this paper is to determine the T-N torsion fatigue curve at R= -1 of the mechanical system "front halfshaft" of an existing car. In particular, experimental fatigue tests were carried out in the laboratories of the Engineering Department of the University of Messina. Torsion fatigue tests of the entire mechanical system were carried out on 15 different front halfshafts. Evaluations of the crack propagation and of failure analysis were made to determine the causes of breakage. In conclusion, the T-N fatigue curve of the mechanical system "front halfshaft" has been obtained.
© 2018 The Authors. Published by Elsevier B.V.
This is an open access article under the CC BY-NC-ND license (http://creativecommons.org/licenses/by-nc-nd/3.0/) Peer-review under responsibility of the Scientific Committee of AIAS 2018 International Conference on Stress Analysis. Keywords: car halfshaft; fatigue assessment; reverse engineering.
1. Introduction
Halfshafts are among the most important component of a car power transmission because they deliver the torque from the differential to the wheels. They are composed by a spline shaft coupled with a fixed joint at one end and a
* Corresponding author. Tel.: +39 347 3209239.
moving joint at the other end. They have to withstand mainly torsional loads which can rapidly change over time, therefore fatigue is one the primary causes of failure. The need to prevent unexpected breakage and to design this mechanical component for a longer lifetime is being an important challenge for the automotive industry, taking into account new kinds of powertrains such as hybrid and electric ones (Bottiglione et al. 2012), which can lead to higher torsion loads. The knowledge of S-N curve allows the prediction of the service life of the components, but performing experimental tests on such complex mechanical system is expensive and not easy for car manufacturers. On the other hand, it is an important way to estimate the working conditions of a mechanical component. A study focused on how working conditions can affect the life of a machine element was conducted by Dikmen et al. (2012) on a railway axle. Starting from the statistical data related to the number of passengers and the convoy speed, the effective stress acting on the axle, hence the residual life of the component was estimated. From a structural point of view, several studies have been conducted. Bayrakceken et al. (2007) investigated a broken car halfshaft, showing how the crack is originated in the highly stressed regions. The adopted material and improper heat treatment conditions also affected the fatigue life of the components. In Vogwell (1998) the effects of torsion and bending loads on a broken driveshaft of an unmanned remotely operated vehicle are studied, proposing design modification in order to reduce stress concentration factors due to keyway groves and shoulders, increasing service life time. Also Bhaumink et al. (2002) notice how improper machining and inadequate radius of keyway end edges are the source of crack initiation on a hollow shaft. Observations conducted by Guimaraes et al. (2016) on the failure surface of a formula SAE halfshaft showed how crack starts from the spline profile. This is in agreement with the conducted finite elements analysis which identify the spline profile as the maximum stressed region of the halfshaft. The previous papers adopted different techniques such as SEM, optical microscopy, non-destructive examinations (NDE) and finite element analysis in order to investigate the failure of the components. A review on different techniques used for shaft failure analysis have been proposed by Raut and Raut (2014). The preset paper is the results of the collaboration between the Engineering Department of Messina University and the car company Maserati S.p.A. Starting from the “front halfshaft” of an existing car, the aim of this study is to determine the M-N torsion fatigue curve at R= -1 of the whole mechanical system by means of experimental tests.
Nomenclature
f frequency [Hz]
HV local Vicker hardness
HVm average Vicker hardness
R stress ratio
T applied torque [Nm]
Tmax maximum applied torque [Nm]
2. Material and methods
The mechanical processing and the detailed drawings of the car front halfshaft have not been disclosed by the component producer for industrial secrecy reasons. The only known information is about the material of which the halfashafts are made. It is a quenched and tempered steel 25CrMo4 whose composition, obtained by means of XRF analysis, is reported in Table 1 and compared with literature data (ASM Handbook, 1993). The values of the XRF analysis are deliberately expressed in terms of percentage compared to the literature data for industrial secret reasons.
Table 1. Chemical composition comparison between XRF analysis and literature for 25CrMo4 steel Elements XRF Literature (%)
C - 0.28 ÷ 0.33 Mn 31.7 % out of zone 0.40 ÷ 0.60 Si 69.3 % out of zone 0.15 ÷ 0.35 P 2242.9 % out of zone 0.035
C. Barone et al. / Procedia Structural Integrity 12 (2018) 3–8 5
Barone et al./ Structural Integrity Procedia 00 (2018) 000–000 3
S 50 % out of zone <0.04 Cr 29.1 % out of zone 0.80 ÷ 1.10 Mo in zone 0.15 ÷ 0.25
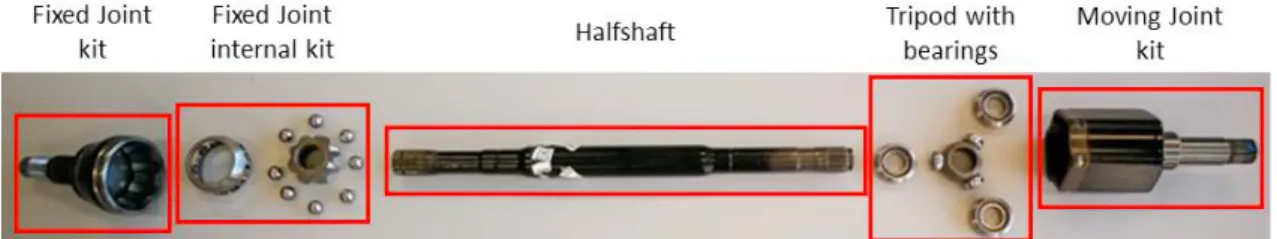
In order to evaluate the effects of mechanical processing on the halfshaft, micro-hardness Vicker tests were performed. A pyramidal indenter with a vertex angle of 136° and indentation force of 4.8 N was used with a test duration of 15 s. The halfshaft was previously disassembled removing clamps and protective covers, then it was degreased and finally joints and bearings were removed. Halfshaft were cutted along their main direction, then it was transversely cutted in eight different sections (labeled from A to H) which were lapped and tested. As is possible to note in Fig. 1, the halfshaft is composed by a fixed and a moving joint, both of them are forced on the spline profile by means of special bearings. Detailed drawings of the halfshaft are not reported for industrial secrecy.
Fig. 1. Disassembled halfshaft
The torsion fatigue tests were carried out in the laboratories of the Engineering Department of the University of Messina using an INSTRON 8854 MT servo-hydraulic load machine with a maximum torque of 2000 Nm. The whole halfshafts were mounted on the test machine (Fig. 2a) by means of especially designed grips (Fig. 2b).
Fig. 2. (a) the front halfshaft mounted on the test machine; (b) custom grip for the halfshaft.
Two types of torsion fatigue tests were performed on 15 halfshafts. The first series of 6 halfshafts was tested with two summarized load histories (Table 2) derived from a multibody car model experimentally validated. Torque values are normalized according to the maximum torque for industrial secret reasons. The other series of 9 halfshafts was tested at different constant loads (58%, 75% and 100% of Tmax) until failure with a load ratio R= -1 and a test frequency
6 C. Barone et al. / Procedia Structural Integrity 12 (2018) 3–8
Table 2. Load histories of the first series of halfshaft
Load type Torque (% of Tmax) Cycles Frequency (Hz) Min Max
Without Abuse (W.O.A.) -22 76 Step 1 1 -12 71 Step 2
With Abuse (W.A.) -76 100 Step 1 0.5 -21 94 Step 2
3. Results and discussion
In micro-hardness tests, the area described by the indenter can be related to the hardness of the material. In Fig. 3 are reported the values of the ratio between the local hardness of the material and its average along the length of the halfshaft. As can be seen from the hardness trends on the halfshaft, higher hardness values are found in areas where the component has a constant and fairly regular cross section (B, E and G sections) while, where there are more detailed machining, such as the spline profile (A and H sections), we have relatively lower hardness values. The hardness investigation shows how mechanical machining lead to critical sections in the halfshaft extremities, especially in the spline profile.
Fig. 3. Hardness trend on the halfshaft for the different sections.
Torsion fatigue tests on the whole halfshaft mechanical system were carried out until failure. The first series of 3 halfshafts, tested with the “Without Abuse” load history, has shown the rupture of the halfshafts at the root of the spline profile on the moving joint side. The second series of 3 halfshafts, tested with the “With Abuse” load history, has shown the rupture on the halfshafts on the side of the fixed joint with crack starting at the root of the spline profile and propagating lengthwise. The third series, tested at a constant amplitude of 58% of Tmax, has shown the rupture
near the root of the spline profile of the halfshaft. In the fourth series, tested at a constant amplitude of 75 % of Tmax,
the rupture occurs in the halfshaft with crack propagating from the root of the spline profile. In the last series, tested at a constant amplitude of Tmax, two halfshafts have shown a failure similar to the previous tests while one failed at
the spline profile of the moving joint near the grip.
From a macroscopic analysis of the failure surfaces we can obtain important information about the way of failure. The failure surfaces on the halfshafts show two different areas, typical of a fatigue breakage (Fig. 4): a smooth area,
C. Barone et al. / Procedia Structural Integrity 12 (2018) 3–8 7
Barone et al./ Structural Integrity Procedia 00 (2018) 000–000 5
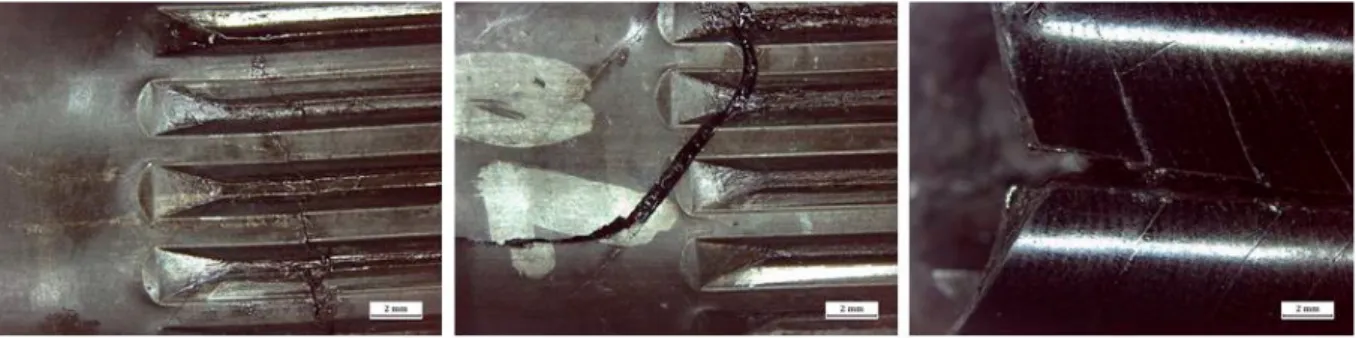
produced by hammering prior to the break, and a rough area, due to a sudden brittle failure. Detailed observation at microscope of the crack shows that it starts from the root of the spline profile (Fig. 5a), propagate transversally along the teeth then it deviates from an angle of 45° (Fig. 5b) and propagate longitudinally up to the failure zone (Fig. 5c). One of the reason because the crack starts at the spline profile is due to the complex geometry and the local mechanical machining which lead to a high stress concentration factor. Another reason could be the forcing of the tripod on the spline profile, which causes residual stresses in that critical zone of the halfshaft.
Fig. 4. Failure surfaces of the halfshaft
Fig. 5. (a) Crack at the root of the spline profile; (b) Crack propagate along the teeth; (c) Crack propagate lengthwise up to the failure zone. From the previous torsion fatigue tests at R= -1, the knowledge of the number of cycle to failure and the related torque level leads to the T-N curve of the whole “front halfshaft” mechanical system. In Fig. 6 are reported the data obtained from experimental torsion fatigue tests at R= -1 normalized respect the maximum applied torque Tmax on the
halfshaft. As is possible to observe, there is a low data dispersion for higher torque amplitude ratio, while it increases for lower values close to the fatigue limit of the mechanical system.
Fig. 6. T-N curve of the mechanical system “front halfshaft”. 4. Conclusions
The aim of the present study is to determine the T-N torsion fatigue curve at R= -1 of the mechanical system "front halfshaft" of an existing car. It is the results of the collaboration between the Engineering Department of Messina University and the car company Maserati S.p.a. The material properties were assessed by means of XRF analysis and micro-hardness tests. Experimental torsion fatigue tests were carried out on the whole front halfshaft mechanical system with different load histories. The analysis of the failure zones shows that the halfshaft breaks due to the high stress values reached at the spline profile. Finally, the T-N curve of the mechanical system was obtained, giving interesting information about the prediction of the fatigue life of front halfshaft mechanical system.
References
Bottiglione, F., Sorniotti, A., Shead, L., 2012. The effect of half-shaft torsion dynamics on the performance of a traction control system for electric vehicles. Proc. Inst. Mech. Eng. Part D J. Automob. Eng. 226, 1145–1159 (2012). doi:10.1177/0954407012440526 Dikmen, F., Bayraktar, M., Guclu, R.: Railway axle analyses, 2011. Fatigue damage and life analysis of rail vehicle axle. Stroj. Vestnik/Journal
Mech. Eng. 58, 545–552 (2012). doi:10.5545/sv-jme.2011.206
Bayrakceken, H., Tasgetiren, S., Yavuz, I., 2006. Two cases of failure in the power transmission system on vehicles: A universal joint yoke and a drive shaft. Eng. Fail. Anal. 14, 716–724 (2007). doi:10.1016/j.engfailanal.2006.03.003
Vogwell, J.: Analysis of a vehicle wheel shaft failure. Eng. Fail. Anal. 5, 271–277 (1998). doi:http://dx.doi.org/10.1016/S1350-6307(98)00022-3 Bhaumik, S.K., Rangaraju, R., Parameswara, M.A., Venkataswamy, M.A., Bhaskaran, T.A., Krishnan, R. V, 2002. Fatigue failure of a hollow
power transmission shaft. Eng. Fail. Anal. 9, 457–467 (2002). doi:10.1016/S1350-6307(01)00033-4
Guimaraes, A. V, Brasileiro, P.C., Giovanni, G.C., Costa, L.R.O., Araujo, L.S, 2016. Case Studies in Engineering Failure Analysis Failure analysis of a half-shaft of a formula SAE racing car. Biochem. Pharmacol. 7, 17–23 (2016). doi:10.1016/j.csefa.2016.05.002 Raut, S.P., Raut, L.P., 1993. A review of various techniques used for shaft failure analysis. Int. J. Eng. Res. Gen. Sci. 2, 220 (2014) ASM Handbook, Volume 1: Properties and Selection: Irons, Steels, and High-Performance Alloys. (1993)