Università degli Studi di Catania
Scuola Superiore di Catania
______________________________________
International PhD
in
Translational Biomedicine
XXVI cycle
Identification and functional analysis of genes
associated with oncogenesis
Eliana Salvo
Coordinator of PhD Tutor Prof. D. Condorelli Prof. G Rappazzo
CONTENTS
ABSTRACT ... 7
INTRODUCTION ... 9
REPLICATIVE SENESCENCE. ... 9
PREMATURE SENESCENCE. ... 11
DNA DAMAGE RESPONSE. ... 13
OXIDATIVE STRESS AND SENESCENCE. ... 15
AUTOPHAGY : BETWEEN LIFE AND DEATH. ... 17
THE MITOCHONDRIAL FREE RADICAL THEORY OF AGING. ... 19
CANCER AND NEURODEGENERATION, AN INVERSE RELATION. ... 20
METALLOTHIONEINS AND OXIDATIVE STRESS ... 22
THE REGION OF MINIMAL DELETION ON CHROMOSOME 6Q26-27. ... 27
THE CATP GENE. ... 29
IDENTIFICATION OF A NOVEL GENE ... 30
RESULTS ... 30
CATP EXPRESSION. ... 32
MUTATIONAL ANALYSIS. ... 33
EVOLUTION. ... 37
DISCUSSION ... 42
EVIDENCES OF CATP AS A NOVEL GENE ... 42
CATP PROTEIN ... 44
RESULTS ... 44
BIOINFORMATIC PREDICTIONS OF CATP STRUCTURE. ... 44
DESIGNING A SYNTHETIC PEPTIDE AND IMMUNIZATION. ... 45
IMMUNOFLUORESCENCE. ... 48 DISCUSSION ... 50 RESULTS ... 51 CLONING ... 51 DISCUSSION ... 65 CONCLUSIVEREMARKS ... 66
MATERIALS AND METHODS ... 68
DNA SAMPLES. ... 68
PHASING ... 69
SEQUENCING ... 69
BIOINFORMATIC TOOLS ... 70
DESIGNING A SYNTHETIC PEPTIDE FOR CATP. ... 70
POLYCLONAL AND MONOCLONAL ANTIBODIES. ... 70
CELL CULTURE. ... 71 IMMUNOCYTOCHEMISTRY. ... 71 TRANSFORMATION ... 74 YEAST COLTURE ... 74 ACKNOWLEDGEMENTS ... 75 REFERENCES ... 76
LIST OF FIGURES
Fig. 1 Growth curve of S. cerevisiae culture ... 25
Fig. 2 Contig of the HD region (from Lin and Morin, 2001). ... 29
Fig. 3 3YAC contig map encompassing the critical region of the RMD ... 30
Fig. 4Southern blot analysis of YAC911C10 and Dot blot of derived cosmids. ... 31
Fig. 5 RT_PCR on human cell lines. ... 32
Fig. 6 SNPs mapped to catp sequence. ... 34
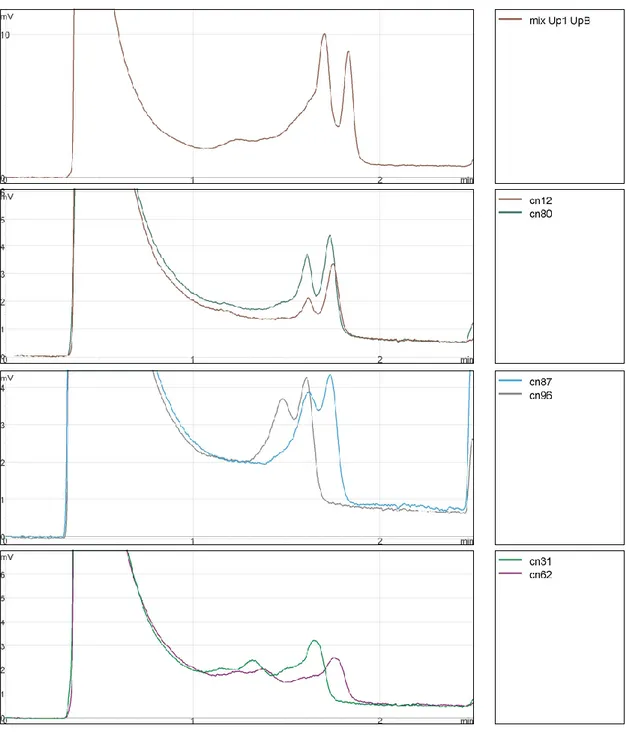
Fig. 7 DHPLC profiles ... 35
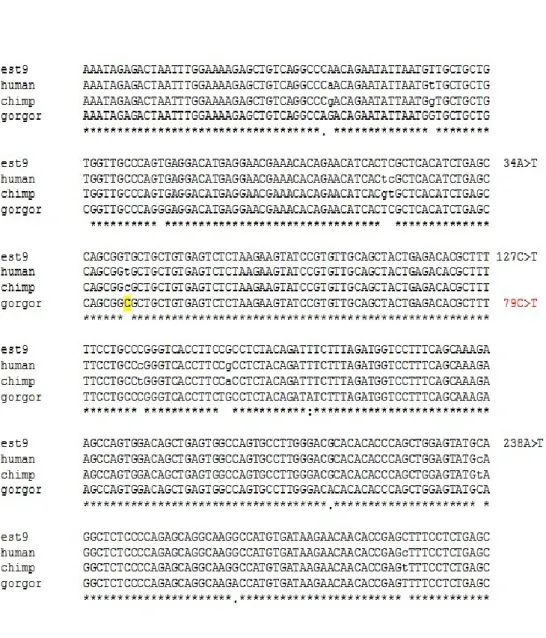
Fig. 8 Multiple aligment of catp sequence in primate. ... 38
Fig. 9 c.34A>T SNP assay fluoresce curves. ... 39
Fig. 10 Allelic Discrimination Plot example ... 40
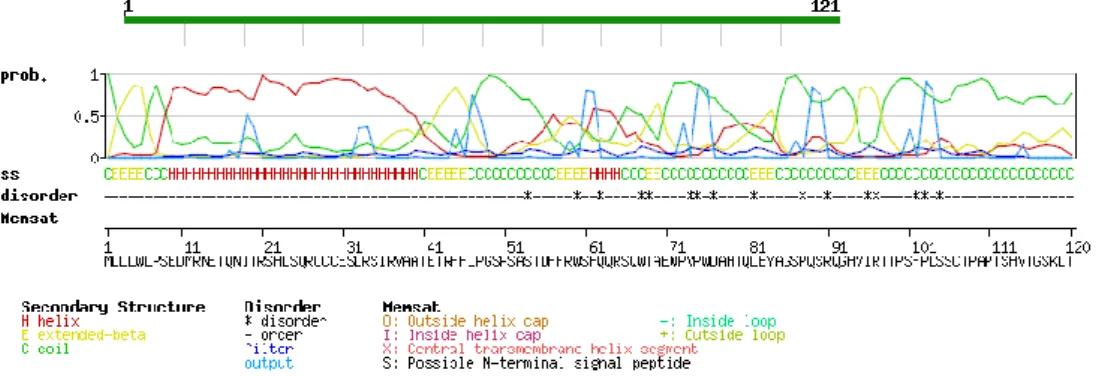
Fig. 11 Secondary Structure prediction obtained by InterproScan. ... 44
Fig. 12 Computation of various physico-chemical properties of CATP obtained by PROSITE. ... 45
Fig. 13 Immunohistochemistery. ... 47
Fig. 14 Immuofluorescence in SH-SY5Y cells ... 49
Fig. 15 chimp allele transformed yeast. ... 52
Fig. 16 Colony morphology on Glucose medium: smooth colonies ... 54
Fig. 17 Colony morphology on Glycerol medium: wrinkly colonies ... 54
Fig. 18 SDGlu-TB plates details. ... 55
Fig. 20 ImageJ elaborated colonies images. ... 56
Fig. 21 SDGly-TB plate detail of chimp allele ... 57
Fig. 22 Hydrogen peroxide-mediated inhibition ... 58
Fig. 23 CFU counts after media shift ... 61
Fig. 24 Colonies size on SDGlu... 62
Fig. 25 ROS production without (up) and after (down) H2O2 treatment ... 63
LIST OF TABLES
Tab I Collections of mutants in human sample population from Burkina Faso. ... 36
Tab II catp alleles: genotypes and allele frequencies. ... 36
Tab III wild type and c.34A>T variant distribution in different pathological conditions. ... 41
ABSTRACT
This study begun with the research project “Genetica Molecolare del processo di senescenza” at IRCSS Oasi Maria SS. - Troina (Enna, Italy). That project was aimed to identify genes mapping within the RMD at the 6q26-27 region, which harbored a locus of senescence named SEN6 (Banga, et al, 1997). It was also known that this region was also implicated with tumorigenesis, since LOH of polymorphic markers were found in some forms of cancer, and a Region of Minimal Deletion (RMD) has been described encompassing markers D6S193-D6S149 (Saito et al., 1992).
One cDNA clone from fetal brain was recovered from a cDNA selection assay and a genomic segment matching the cDNA sequence was identified on chromosome 6 contig. It mapped within the RMD near marker D6S193, and encoded a putative protein without any homology with respect to known sequences. Our aim was to do a functional analysis of this gene in order to evaluate a possible relationships with cancer.
Any functional analysis of gene/protein is normally facilitated by bioinformatic analysis; in this case, however, the lack of homology made the study of its function(s) much more difficult.
Initially, computational studies on the protein were performed which evidenced a possible membrane-binding domain at the C-terminus. For this reason the protein was named CATP (Cytomembrane-Associated Trafficking Protein).
Then, genetic analysis was done to better define catp gene. Particularly, mutation were scanned to identify variants and alleles of the gene, and modifications of its sequence across evolution, especially in Great Apes, were evaluated. Alleles were analyzed for association with diseases such as Neurodegenerative disorders, as well as Autistic spectrum disorders, Early Epilepsy and Leukemias.
Finally functional analysis was performed in a simple in vivo model, using the yeast Saccharomyces cerevisiae, in order to clarify function of catp and the different effects of its alleles on yeast chronological lifespan, a measure of aging in postmitotic
tissues. Data suggested that catp alleles can affect yeast growth in distinguishable ways. Moreover they showed different sensitivity to oxidative stress compared each other and versus a negative control. So far a possible role of catp in senescence and/or tumorogenesis has been suggested throught ossidative stress responce and ROS level regulation.
Chapter 1
INTRODUCTION
Replicative senescence.
One of the first observations made for primary cells explanted from human tissue was that such cells do not proliferate indefinitely but instead are ‘‘mortal’’. Hayflich observed that cultured human fibroblasts undergo senescence (a loss of replicative capacity) after a uniform, fixed number of ~50 population doublings, commonly termed the Hayflick limit. Primary cells explanted from human tissue do not proliferate indefinitely but instead are ‘‘mortal.’ Their proliferative capacity upon explantation consistently displays three phases: phase I, corresponding to a period of little proliferation before the first passage, during which the culture establishes; phase II, characterized by rapid cell proliferation; and phase III, during which proliferation gradually grinds to a complete halt (Hayflick and Moorhead 1961). Commenting on the possible causes of the transition to phase III, Hayflick (1965) hypothesized that ‘‘The finite lifetime of diploid cell strains in vitro may be an expression of aging or senescence at the cellular level.’’ The term cellular senescence therefore denotes a stable and long-term loss of proliferative capacity, despite continued viability and metabolic activity. Almost half a century after the first reports describing the limited replicative potential of primary cells in culture, there is now overwhelming evidence for the existence of ‘‘cellular senescence’’ in vivo.
The absence of telomerase in cultured human cells and the shortening of telomeres at each population doubling have suggested that telomere length acts as a mitotic clock that accounts for their limited lifespan (Rubin, 2002). With the propagation of human cells in culture, telomeres (the protective chromosomal termini) are progressively shortened, ultimately causing cells to reach their ‘‘Hayflick limit’’.
This barrier has been termed replicative (cellular) senescence, since it is brought about by replication. Telomeres are subject to attrition due to the fact that DNA polymerase fails to completely replicate the lagging strands. In the early 1970s, Olovnikov (1971) and Watson (1972) independently described this socalled ‘‘end replication problem’’, which contributes to telomere shortening. Thus, telomeres act as a molecular clock, reflecting the replicative history of a primary cell. When telomeres reach a critical minimal length, their protective structure is disrupted. This triggers a DNA damage response (DDR), which is associated with the appearance of foci that stain positive for g-H2AX (a phosphorylated form of the histone variant H2AX) and the DDR proteins 53BP1, NBS1, and MDC1. Moreover, the DNA damage kinases ATM and ATR are activated in senescent cells. After amplification of the DDR signal, these kinases activate CHK1 and CHK2 kinases. Communication between DDR-associated factors and the cell cycle machinery is brought about by phosphorylation and activation of several cell cycle proteins, including CDC25 (a family of phosphatases) and p53. In addition, differential expression of p53 isoforms has been linked to replicative senescence. Together, these changes can induce a transient proliferation arrest, allowing cells to repair their damage. However, if the DNA damage exceeds a certain threshold, cells are destined to undergo either apoptosis or senescence. The factors bringing about this differential outcome have remained largely elusive, but the cell type and the intensity and duration of the signal, as well as the nature of the damage, are likely to be important determinants (Kuilman, et al., 2010).
The dependence of replicative senescence on telomere shortening is evident from its bypass by the ectopic expression of the catalytic subunit of the telomerase holoenzyme (hTERT), which elongates telomeres, thereby abrogating the effect of the end replication problem (Bodnar et al. 1998). The limited life span of most primary human cells is explained by the fact that, in contrast to stem cells, telomerase is not expressed in human somatic cells, so they are unable to maintain telomeres at a sufficient length to suppress a DDR (Harley et al. 1990; Masutomi et al. 2003). Tumor cells often express telomerase (Shay and Bacchetti 1997), or elongate their telomeres through a mechanism termed alternative lengthening of telomeres (ALT) (Muntoni and Reddel 2005). As a result, telomeres of human cancer cells are maintained at a length
that permits continued proliferation (Shay and Wright 2006).
Senescence is now reconognized as a critical feature of mammalian cells to suppress tumorigenesis , acting alongside cell death programs. Cellular senescence acts as barrier to tumorigenesis. The ability of cells to bypass replicative senescence leads to immortalization, which can promote neoplastic transformation. The phenotype of limited division of the normal human cell has been reported to be dominant over the immortal phenotype of HeLa and SV40-transformedcells in hybrids; cellular immortality was found to be a recessive phenotype in hybrids. Fusion of immortal cell lines with normal human fibroblasts or certain other immortal cell lines yields hybrids having limited division potential. This results also indicated that senescence was the results of active genetic mechanisms rather than random events (Pereira-Smith, 1983).
Premature senescence.
Despite telomere erosion is considered to be the main cause of the onset of replicative senescence, recent findings suggest that a senescent phenotype can be induced by a variety of other stimuli that act independently of telomeres (Itahana, 2004). Premature cellular senescence is the termini to referrer to this type of senescence, since it arises prior to the telomere shortening.
Many different mechanisms of premature senescence can occur in cells which can be triggered by exogenous signals such as oncogenic stimuli, DNA damage and oxidative stress.. In cultured cells stress-induced senescence, oncogene-induced senescence (OIS) and tumor-suppressor senescence are been described. There is now a large number of evidences for premature senescence existence in vivo.
Oncogene-induced senescence
can transform most immortal mammalian cell lines and collaborate with immortalizing genes in oncogenically transforming primary cells, it induces cell cycle arrest when it is introduced alone into primary cells (and at least one immortal rat fibroblast cell line) (Land et al. 1983; Franza et al. 1986; Serrano et al. 1997). Serrano et al. (1997) noted the striking phenotypic resemblance of such nonproliferating cells to those in replicative senescence, and this phenomenon has eventually come to be known as oncogene-induced senescence (OIS). Unlike replicative senescence, OIS cannot be bypassed by expression of hTERT, confirming its independence from telomere attrition (Wei and Sedivy 1999). Some different studies have provided evidences for OIS in vivo, senescence markers have been demonstrated in several contexts in which oncogenes or tumor suppressor gene were perturbed; e.g. Melanocytic nevi, benign tumors that have a low propensity to progress toward melanoma, are a well-studied system for OIS in vivo in humans, mice, and fish. In 2002, BRAFE600 was identified as a frequent mutation in human cancer, predominantly melanoma (Davies et al. 2002). At least as remarkable was the finding that the same mutation is present in the large majority of nevi (Pollock et al. 2003). In spite of the presence of an oncogenic BRAF allele, an important and common feature of nevi is their exceedingly low proliferative activity. This characteristic is typically maintained for decades until the lesion gradually disappears. Nevi express elevated levels of p16INK4A and display increased SA-b-GAL activity (Michaloglou et al. 2005). Arguing against a role for replicative senescence, it was found that telomere length in nevi is indistinguishable from that in normal skin (and longer than in melanoma cells). This strongly suggests that nevi undergo OIS in vivo.
Tumor suppressor loss-induced senescence
Similar to oncogene mutation or overexpression, loss of a tumor suppressor can also trigger senescence in mouse and human cells. Pandolfi and colleagues were the
first to show that senescence in vivo can also be triggered by the loss of a tumor suppressor gene. They found that conditional Pten deletion in murine prostate cells results in the formation of high-grade PIN ((prostatic intraepithelial neoplasia), which display characteristics of senescence. In conjunction with p53 loss, these lesions progress to malignancy. Together, these examples provide the first pieces of evidence that, similar to activated oncogenes, loss of expression of tumor suppressors can also cause incipient cancer lesions to activate features of senescence, serving to limit tumorigenesis in vivo (Kuilman, 2010).
DNA damage response.
Cellular senescence is associated with ageing and cancer in vivo and has a proven tumour-suppressive function. Common to both ageing and cancer is the generation of DNA damage and the engagement of the DNA-damage response pathways(D’Adda di Fagagna 2008).
Structural changes to DNA severely affect its functions, such as replication and transcription, and play a major role in age-related diseases and cancer. A complicated and entangled network of DNA damage response (DDR) mechanisms, including multiple DNA repair pathways, damage tolerance processes, and cell-cycle checkpoints safeguard genomic integrity. Like transcription and replication, DDR is a chromatin-associated process that is generally tightly controlled in time and space. As DNA damage can occur at any time on any genomic location, a specialized spatio-temporal orchestration of this defense apparatus is required. Genomic insults arise from side effects of DNA metabolizing processes, such as replication errors, uncontrolled recombination, off-target mutation induction by somatic hypermutation during antigen production, and inaccurate VDJ recombination (Liu and Schatz, 2009) The biggest genomic burden is, however, induced by processes that directly damage DNA. DNA lesions are derived from three main sources (Lindahl 1993; Friedberg et al. 2006): environmental agents such as ultraviolet light, ionizing radiation, and numerous genotoxic chemicals; reactive oxygen species (ROS) generated by respiration and lipid peroxidation; and spontaneous hydrolysis of nucleotide residues, inducing abasic sites
and deamination of C, A, G, or 5methyl-C. It is estimated that each cell is confronted with approximately 104–105 lesions per day, indicating that clearance of genomic injuries constitutes a demanding task to maintain proper genome function. Essential genome processes, such as transcription and replication, are severely affected by DNA lesions. Replication over damaged DNA induces mutations, which may initiate and propagate carcinogenesis.
To deal with the fundamental problem of genomic erosion, a sophisticated network of DNA damage-response (DDR) systems has evolved. These include a set of DNA repair mechanisms, damage tolerance processes, and cell-cycle checkpoint pathways. The biological significance of a functional DDR for human health is clearly illustrated by the severe consequences of inherited defects in DDR factors resulting in various diseases, including immune deficiency, neurological degeneration, premature aging, and severe cancer susceptibility (Hoeijmakers 2009).
The involvement of DNA damage in the induction of replicative senescence by telomere erosion has been established Activation of a DDR has also been shown to contribute to OIS in several settings in vitro; among others, in the context of oncogene-induced DNA hyperreplication (D’Adda di Fagagna 2008). The DDR and p53 often function in a common signal transduction cascade in which interference with specific DDR components can substitute for the loss of p53 function. However, DDR activation is not a universal feature of OIS. In line with this, senescence induced upon genetic loss of Skp2 in the context of Pten heterozygosity is not associated with the emergence of DDR markers and does not depend on p53 signaling (Lin et al. 2010). Shedding some light on a possible link between the DDR and senescence, an elegant study showed that, in the context of Rb loss-driven murine adenomas, the DDR preceded cellular senescence. While early and late adenomas similarly expressed DDR markers, senescence was apparent only in late (arrested) lesions, suggesting that, at least in this experimental system, it is primarily senescence and not DNA damage signaling that acts cytostatically. It thus seems that DDR activation is involved in certain, but not all, OIS settings (Giglia-Mari et al., 2011).
Oxidative stress and senescence.
It is widely recognized that oxidative stress and ROS are strictly associate, as in vitro as in vivo. It's also largely assumed that ROS levels increase in both replicative senescence and OIS (Lee et al. 1999). ROS contribute also to induction of replicative senescence, as evidenced by its delayed or premature onset upon treatment with antioxidants or inhibitors of cellular oxidant scavengers, respectively (Chen et al. 1995; Yuan et al. 1995). A recent systems biology study has suggested that ROS mediates senescence through induction of DNA damage foci, with a contribution of p21CIP1. Passos and co-workers shown that there exists a dynamic feedback loop that is triggered by a DNA damage response (DDR) and, which after a delay of several days, locks the cell into an actively maintained state of ‘deep’ cellular senescence. The essential feature of the loop is that long-term activation of the checkpoint gene CDKN1A (p21) induces mitochondrial dysfunction and production of reactive oxygen species (ROS) through serial signalling through GADD45-MAPK14(p38MAPK)-GRB2-TGFBR2-TGFb. These ROS in turn replenish short-lived DNA damage foci and maintain an ongoing DDR. This loop is both necessary and sufficient for the stability of growth arrest during the establishment of the senescent phenotype. (Passos et al. 2010). Further studies try to explain how ROS relate to p53 and RB. A study on the maintenance of a senescence-like arrest upon temporary expression of SV40 LT revealed that ROS and PKCd function in a positive feedback loop to maintain this proliferative halt. Furthermore, ROS have been suggested to impinge either directly or indirectly on the p53 and p16INK4A–RB signal transduction cascades For instance, the MINK–p38–PRAK pathway is activated in senescence and controls the activation of p16INK4A and p53, as well as expression of p21CIP1, in a p53-independent manner. These results notwithstanding, although ROS undoubtedly plays an important role in senescence, the nature and mechanism of this contribution remains largely unclear. Major questions include how the increased levels of ROS are generated, and what the cellular targets for ROS in senescence are (Kuilman et al., 2010).
Biomarkers of senescence.
Whilst cellular senescence can be induced by a wide variety of conditions, senescent cells show a number of definite features which allows their identification and that in many cases reflect the mechanism that contribute to senescence program. Cell cycle arrest is certainly the central and indispensable marker of senescence, even if it is no unique for senescent cells. In other words, terminal differentiation results in proliferative arrest.
Morphological changes accompany senescent cells which became large flat multinucleated, or refractile. As it is well known the p53 and p16INK4A–RB signal transduction cascades commonly mediate the activation of the senescence program (Lowe et al. 2004). Consequently, components thereof have been used as biomarkers to identify senescent cells. In human fibroblasts undergoing replicative or premature senescence, RB accumulates in its active, hypophosphorylated form (Stein et al. 1990; Serrano et al. 1997), and p53 displays increased activity and/or levels . The p53 protein can also be phosphorylated on Ser 15 by ATM as part of the senescence response (Calabrese et al. 2009). p53 serves as a node, mediating prosenescence signals emerging from unscheduled oncogene activation, telomere dysfunction, DNA damage, and reactive oxygen species (ROS). RB has a unique role in mediating senescence in human cells, one of its primary activators, p16INK4A, is commonly induced in senescent cells in many contexts in vitro (Serrano et al. 1997; Campisi 2005).
Induction of SA-β-GAL (Senescence Associated β-D-galactosidase) is a common senescence markers (Dimri et al. 1995). Its increased activity in senescent cells derives from lysosomal b-D-galactosidase, which is encoded by the GLB1 gene, however it is as yet unclear to what extent its contribute mechanistically to the senescence process.
Cellular senescence it is also associated with an altered chromatin structure, characterized by the formation of senescence associated heterochromatin foci (SAHF), nuclear DNA domains stained densely by DAPI and enriched for histone modifications including lysine9-trimethylated histone H3. SAHF contribute to senescence-associated cell growth arrest by sequestering and silencing proliferation-promoting genes such as
the E2F target gene cyclin A (Narita, et al., 2003 - 2006).
As cells approach senescence, a known chromatin regulator, HIRA, enters PML(promyelocytic leukemia) nuclear bodies, where it transiently colocalizes with HP1 proteins prior to incorporation of HP1 proteins into SAHF. A physical complex containing HIRA and another chromatin regulator, ASF1a, is rate limiting for formation of SAHF and onset of senescence, and ASF1a is required for formation of SAHF and efficient senescence-associated cell cycle exit (Zhang et al., 2005).
Cells undergoing senescence - whether in response to telomere malfunction, DNA damage, or oncogenic alterations - exhibit profound changes in their transcrip- tomes. A major consequence of this is the secretion of many dozens of factors, including cytokines and chemokines (Campisi 2005). The first indication of changes in the secretome of human cells accompanying senescence was reported for fibroblasts undergoing replicative senescence. Microarray expression analysis revealed a strong inflammatory response, as seen in wound healing (Shelton et al. 1999). Subsequent work from various laboratories has revealed that cells undergoing either replicative or premature senescence display profound changes in their secretome, termed the senescence-associated secretory phenotype (SASP) (Copp´e et al. 2008; ; Rodier et al. 2009). A recent study indicates that, for the induction of several of these SASP factors, persistent DNA damage is required. Because DNA damage accompanies some but not all senescence settings the SASP is not strictly coupled to senescence per se (Rodier et al. 2009).
Autophagy : between life and death.
Autophagy is an ATP- dependent mechanism highly conserved in all eukaryotic cells. Autophagy assures degradation of cytoplasmic cellular components. Autophagy process begins with an isolation membrane, also known as a phagophore that is likely derived from lipid bilayer contributed by the endoplasmic reticulum (ER) and/or the trans-Golgi and endosomes. The phagophore expands to engulf intra-cellular cargo,
such as protein aggregates, organelles and ribosomes, thereby sequestering the cargo in a double-membraned autophagosome The loaded autophagosome matures through fusion with the lysosome, promoting the degradation of autophagosomal contents by lysosomal acid proteases. Lysosomal permeases and transporters export amino acids and other by-products of degradation back out to the cytoplasm, where they can be re-used for building macromolecules and for metabolism (Mizushima 2007).
Although the importance of autophagy is well recognized in mammalian systems, many of the mechanistic breakthroughs in delineating how autophagy is regulated and executed at the molecular level have been made in the yeast Saccharomyces cerevisiae. Currently, 32 different autophagy-related genes (Atg) have been identified by genetic screening in yeast and, significantly, many of these genes are conserved in slime mould, plants, worms, flies and mammals, emphasizing the importance of the autophagic process in responses to starvation across phylogeny (Nakatogawa et al., 2009).
Autophagy is a self-degradative process that is important for balancing sources of energy at critical times in development and in response to nutrient stress. Autophagy also plays a housekeeping role in removing misfolded or aggregated proteins, clearing damaged organelles, such as mitochondria, endoplasmic reticulum and peroxisomes, as well as eliminating intracellular pathogens. Thus, autophagy is generally thought of as a survival mechanism, although its deregulation has been linked to non-apoptotic cell death. In addition to elimination of intracellular aggregates and damaged organelles, autophagy promotes cellular senescence and cell surface antigen presentation, protects against genome instability and prevents necrosis, giving it a key role in preventing diseases such as cancer, neurodegeneration, cardiomyopathy, diabetes, liver disease, autoimmune diseases and infections.
Despite autophagy was first described in 1967 by De Duve, it has been rediscovered by scientist in recent years for its importance in the cell machinary, and although the growing body of findings there remain specific challenges to understanding of autophagy in mammalian cells, including how the phagophore emerges in the first place, how a specific cargo is targeted for degradation, and how
alternative mechanisms of autophagy are regulated. However, the significance of defects in autophagy for disease and ageing is apparent from growing evidence linking mutation or loss of function of key autophagy genes in cancer, neuropathy, heart disease, auto-immune disease and other conditions. From the perspective of a cancer biologist, it remains controversial whether autophagy is tumour suppressive (through cell cycle arrest, promoting genome and organelle integrity, or through inhibition of necrosis and inflammation) or oncogenic (by promoting cell survival in the face of spontaneous or induced nutrient stress). In other diseases, such as neurodegenerative diseases (Huntington's, Alzheimer's and Parkinson's diseases) and ischaemic heart disease, autophagy is more widely accepted as beneficial given its role in eliminating ‘toxic assets’ and promoting cell viability (Glick et al., 2010).
The mitochondrial free radical theory of aging.
In 1956, Denham Harman first proposed that the oxygen free radicals that are endogenously formed from normal metabolic processes in a variety of organisms cause aging. With accumulating evidence, and following decades of studies that have involved both invertebrate and vertebrate model systems, there is continued controversy over whether an accumulation of macromolecular damage caused by chronic ROS production limits mammalian lifespan or whether it primarily contributes to the onset of age-related disease.
Oxidatively-damaged proteins and DNA accumulate with aging. If these damages are not appropriately repaired, they can cause progressive failure of cellular machinery, organ aging and the onset of age-related disease. A number of pathologies have been linked to oxidative stress, including atherosclerosis, hypertension, ischaemia– reperfusion injury, inflammation, cystic fibrosis, diabetes, Parkinson and Alzheimer diseases, and cancer. Given that mitochondria are the major known intracellular generators of reactive oxygen species (ROS), which are the inevitable consequence of oxidative ATP production from electron transport along the mitochondrial inner membrane, this theory has largely become known as the mitochondrial free radical theory of aging.
Accepted refinements to this theory now include the chemical participation of reactive nitrogen species (RNS) as well as ROS, recognition that mitochondrial (mt)DNA damage also accumulates with aging, and appreciation that the balance of intracellular antioxidant and macromolecular repair mechanisms is crucial in determining the cell fate responses to both acute and chronic oxidative stress. It is also important to note that the free radical theory of aging is not mutually exclusive with respect to aging mechanisms illustrated above (cell senescence, telomere shortening and genomic instability).
Evidence in support of the mitochondrial free radical aging theory in mammals includes the following:
‐ mitochondrial ROS production and mtDNA damage (for example, deletions, mutations and base modifications) increase with age in various mammals, including mice and humans
‐ injection of chemically uncoupled or aged mitochondria induces cellular degeneration of knock-in mice with catalase overexpression localized to the mitochondria exhibit reduced levels of mtDNA damage and have an extended lifespan
‐ caloric restriction reduces mitochondrial ROS production and mtDNA damage and extends lifespan (Benz and Yau, 2008)
Cancer and neurodegeneration, an inverse relation.
Cancer and neurodegeneration are often thought of as disease mechanisms at opposite ends of a spectrum; one due to enhanced resistance to cell death and the other due to premature cell death.
Although neuronal degeneration seems to be a condition associated with aging of the organism, not all aging individuals develop neurodegeneration. There is evidence of some cognitive deterioration with aging (Levy, 1994; Rubin et al, 1998;); however the changes due to dementia are much more profound and pervasive than those associated with normal aging. Cancer, on the other hand, is a disorder that manifests itself at almost any age, but like neurodegenerative diseases, its prevalence and incidence also increase with increasing age. Both neurodegenerative diseases and cancer then, are two common and important diseases that increase with age, and lead to high morbidity and mortality in the elderly. Neurodegeneration is associated with progressive loss of neuronal cells, whereas cancer is linked with the opposite phenomenon: unregulated and increased cell survival and proliferation. Therefore, it can be hypothesized that a common biological mechanism underlies the two diseases which, when regulated in one direction leads to cell death or senescence (i.e. neurodegeneration), and when regulated in the other direction promotes cell proliferation (cancer) (Behrens et al., 2008).
There is now accumulating evidence to link so diversified processes. However, the more we learn about the molecular genetics and cell biology of cancer and neurodegeneration, the greater the overlap between these disorders appears. Many epidemiological studies have linked cancer and neurodegenerative disorders. A growing body of evidence suggests an inverse correlation between the risk of developing cancer and a neurodegenerative disorder. It has been shown that, after adjustment for age, a diagnosis of Alzheimer Disease (AD) was associated with a 60% reduced risk of cancer, and conversely a history of cancer was associated with a 30% reduced risk of AD (Bennett et al.,2010)
A number of studies show that the genes causing neurodegeneration are often mutated or abnormally expressed in cancer. Both cancer and neurodegeneration are thought to be the result of the interaction of genetic and environmental factors. Age is the single most important risk factor for both cancer and neurodegeneration and, although the exact cellular mechanisms of aging are not yet completely defined, age is likely to play an important role in the link between the two disorders. Both cancer and
neurodegeneration are also characterized by the contribution of the inheritance of mutated genes.
Research showing that cancer and neurodegenerative disorders share some of the same genes and molecular mechanisms strengthens the idea that individuals affected by a neurodegenerative disease may have a decreased risk of some cancers. Despite a number of intriguing pointers, little is known about the genetic association between cancer and neurodegeneration. Although a large number of genes have been implicated in the genesis of cancer and neurodegeneration, only two, parkin and ATM, have been shown to strongly overlap (Plun-Favreau et al., 2010).
Further studies of the origin of both diseases indicate that their sporadic forms are the result of metabolic dysregulation and that compensatory increase in energy transduction which occurs in both diseases is inversely related. In cancer, the compensatory metabolic effect is the up-regulation of glycolysis, first described by Warburg in 1956, and known as Warburg effect; in Alzheimer Disease , a bioenergetic model based on the interaction between astrocytes and neurons indicates that the compensatory metabolic alteration is the upregulation of oxidative phosphorylation — an inverse Warburg effect. These two modes of metabolic alteration could contribute to an inverse relation between the incidence of the two diseases (Demetrius at al., 2013).
Metallothioneins and oxidative stress
The thiol side chain in cysteine often participates in enzymatic reactions as a nucleophile. The thiol is susceptible to oxidization to give the disulfide derivative cystine, serves an important structural role in many proteins, such as Metallothionein (MT). MTs are small cysteine-rich metal-binding proteins found in many species and, although there are differences between them, it is of note that they have a great deal of sequence and structural homology.MT is characterized by its low molecular weight (6 to 7kDa), high metal content, characteristic amino acid composition, high content of
conserved cysteine residues and absence of aromatic amino acids. The existence of MT across species is indicative of its biological demand, while the conservation of cysteines indicates that these are undoubtedly central to the function of this protein. Over 40 years of research into MT have yielded much information on these proteins, but have failed to assign them a definitive biological role (Miles et al; 2000). Currently, they are considered as multifunctional proteins, playing major roles in metal detoxification and homeostatic trace element regulation, protection of cells against oxidative stress, radical scavenging, and regulation of cell proliferation and apoptosis, and the maintenance of intracellular redox balance. In mammals, predominantly Zn2+, but sometimes also Cu2+ are bound in vivo under physiological conditions, but several other less abundant transition metals, such as Cd2+, Bi3+, Pt2+, Ag+, and Hg2+ also are bound avidly by MTs. It is known that cysteines are organized into some specific cluster, as cys, cys-x-y-cys, and cys-cys sequences. However, sometimes cysteine appear in an atypical context, cys-cys-cys or cys-x-x-cys. Cys triplets has been found to act as ligand in MTs (Serra-Batiste et al.,2010).
Saccharomyces cerevisiae as a model organism for cancer and aging
Saccharomyces cerevisiae is a common species of yeast (Kingdom: Fungi, Phylum: Ascomycota, Subphylum: Saccharomycotina, Class: Saccharomycetes, Order: Saccharomycetales , Family: Saccharomycetaceae, Genus: Saccharomyces).
S. cerevisiae cells are generally ellipsoidal in shape ranging from 5 to 10 μm of diameter, mean cell volumes are 29 or 55 μm3 for a haploid or a diploid cell, respectively; cell size increases with age. Yeast cells share most of the structural and functional features of higher eukaryotes, peculiarities of yeast cells are that they are surrounded by a rigid cell wall, the vacuole corresponds to lysomes in higher cells.
S. cerevisiae is a facultative anaerobic fermenting yeast, it shows a very low Pasteur effect (inhibiting effect of oxygen on the fermentation process), and high Crabtree effect (repression of respiration, under fully aerobic conditions, in the presence of glucose).
Saccharomyces cerevisiae was the first eukaryotic genome that was completely sequenced (Goffeau et al., 1996). The genome is composed of about 12.068 kb and 6.275 genes, compactly organized on 16 chromosomes (A - P). It is estimated that yeast have at least 31% of its genes homologous with that of humans (Botstein et al., 1997).
S. cerevisiae life cycle
Although S. cerevisiae is a unicellular organism, it can exist in any of three specialized cell types which play distinctive roles in their life cycle. Two of the specialized cell types are the mating types α and a, which are able to mate efficiently with each other. Because the mating process results in both cell and nuclear fusion, mating produces a diploid cell. The product of mating, the zygote, has a distinctive shape and gives rise to daughter diploid cells of the usual shape by budding. It is capable of undergoing meiosis upon nutritional starvation. It gives rise to four haploid meiotic progeny, each of which is encased in a spore coat. And are wrapped up together in a sac, the ascus.
Asexual division in yeast is a process known as budding. Budding is a form of reproduction in which a new organism develops from an outgrowth or bud on another one. The new organism remains attached as it grows, separating from the parent organism only when it is mature. Since the reproduction is asexual, the newly created organism is a clone and is genetically identical to the parent organism. This process results in a 'mother' and a smaller 'daughter' cell, unlike the process of fission, in which the initial cell enlarges and then pinches off into two daughter cells. The daughter cell is a bit smaller than the mother cell and must increase in size before it initiates chromosome duplication. It is appropriate to consider the cycle as commencing with an unbudded cell in the G1 interval of the cycle. The nucleus contains a single-spindle plaque, a structure embedded in the nuclear membrane from which microtubules arise. Three events, mark the end of the G1 interval: spindle plaque duplication, the initiation of DNA synthesis, and the emergence of the bud. A diploid cell growing with adequate nutrient at the optimal temperature, 30 °C, may complete a cycle in about 100 min.
Yeast cells abandon the proliferative mode under certain environmental circumstances. For example, if they run out of nutrients, they arrest as unbudded cells in the G1 phase of the cell cycle, where they are able to survive and to resume growth when nutrients are available again. Another environmental influence that interrupts the proliferation mode is the vicinity of another yeast cell with which it can mate. If cells of different mating type are put near each other, the mating partners transiently arrest each other's cell cycle in the G1 phase and then undergo cell fusion. The mating factors cause cells to arrest in the Gl phase of the cell division cycle, just before the initiation of DNA synthesis; they are thus negative growth factors.
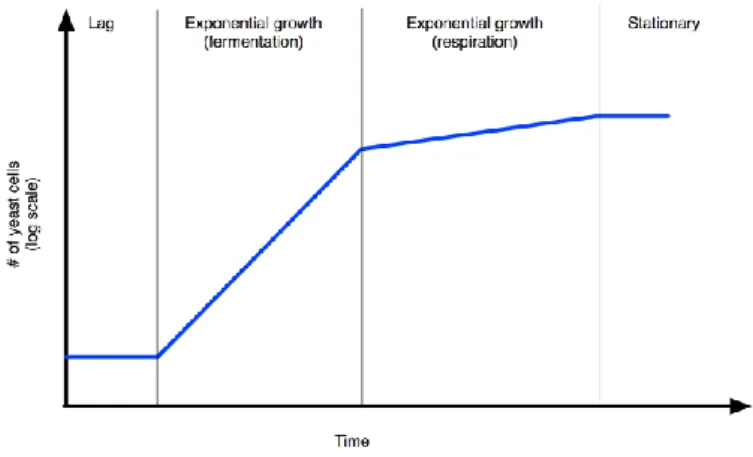
When a culture of yeast cells is inoculated in a fresh growth medium, a diauxic growth curve can be with three main phases (lag, exponential and stationary) can be generate (Fig.1)
Fig. 1 Growth curve of S. cerevisiae culture
The lag phase refers the initial growth phase, where cells are biochemically active but non dividing, the duration and extent of this phase depends on the initial population size and environmental conditions like temperature, oxygen, nutrients etc. The exponential phase of growth is the period in which cells are actively dividing and grow most rapidly. Generally glucose is the carbon source used and fermentation is the preferential metabolic way. The third phase in growth of yeast is stationary phase when metabolism slows down and the cells stop rapid cell division. The factors that cause cells to enter stationary phase are related to change in the environment typically caused
by high cell density, nutrients starvation, or metabolism shift towards respiration. Ethanol or other Carbon sources with two or three Carbon atoms are used, cells produced and stored trealose and glycogen, cells become more stress resistent.
Whole nutrient absence determine the so called long term stationary phase, where cells do not divide, metabolism rate are lower and cell remain viable for very long time (weeks or months) without nutrient. Finally death phase is established, so that cells die until culture lapse.
The replicative and chronological life spans are two established paradigms used to study aging in yeast. Replicative aging is defined as the number of daughter cells a single yeast mother cell produces before senescence; chronological aging is defined by the length of time cells can survive in a non-dividing, quiescence-like state.
A yeast model for aging
Saccharomyces cerevisiae is a an important model organism for biological study, particularly for genetics and molecular biology. Many of the recent insights into cell cycle regulation and cancer have been achieved by using S.cerevisiae. Studies done over the past 50 years have led to the idea that budding yeast can be used to study three types of cellular aging. Replicative aging describes the division potential of individual cells and relies on the asymmetric cell divisions of budding yeast that yield distinct mother and daughter cells. Replicative life span (RLS) is defined as the number of times an individual cell divides before it undergoes senescence (Mortimer and Johnston 1959). Chronological lifespan (CLS) describes the capacity of cells in stationary phase (analogous to G0 in higher eukaryotes) to maintain viability over time, which is assayed
by their ability to reenter the cell cycle when nutrients are reintroduced (Longo et al. 1996). CLS has been proposed as a model for the aging of post-mitotic tissues in mammals (Wilson Powers et al., 2006).
Finally, budding yeast have been used to study clonal senescence, which is analogous to the Hayflick limit imposed on mammalian tissue culture cells and
characterized by a finite number of times a population of cells can divide. (Lindstrom et al., 2009).
Genome-wide comparative RNA profiling with selected cellular model systems of aging, including replicative senescence, stress-induced premature senescence, and distinct other forms of cellular aging, allowed the identification of new genetic regulators of cellular aging and senescence, including a number of genes and pathways not previously been linked to aging. An unbiased screen across species uncovered several so far unrecognized molecular pathways for cellular aging that are conserved in evolution. Both upregulated and downregulated genes were considered. Starting with a total of 6750 human genes, 553 yeast orthologs were identified, of which only the nonessential genes were considered for further analysis (Laschober et al., 2010).
For the top ranking human genes, 93 nonessential yeast orthologs were identified. Several candidate genes obtained through this analysis have been confirmed by functional experiments. The effect of genetic deletion on chronological lifespan in yeast was assessed for 93 genes whose functional homologues were found in the yeast genome and the deletion strain was viable.
Several genes whose deletion led to significant changes of chronological lifespan in yeast were identified featuring both lifespan shortening and lifespan extension. The ability of a particular gene to restrict lifespan in yeast suggests it plays a role in modulating the rate of aging that potentially extends beyond yeast.
The Region of Minimal Deletion on chromosome 6q26-27.
In past years, a relationship between the establishment of a senescence phenotype and 6q region was demonstrated. Sandhu and co-workers showed that introduction of a normal human chromosome 6 or 6q - by microcell-mediated chromosome transfer (MMCT) - can suppress the immortal phenotype of simian virus 40-transformed human fibroblasts (SV/HF). At least one of the genes for cellular
senescence in human fibroblasts should be present on the long arm of chromosome 6 (Sandhu, 1994).
Cytogenetic and molecular studies showed 6q26-27 chromosome rearrangement involved in some different type of cancer, such as ovarian cancer (Trent, 1980; Tibiletti, et al., 1998), breast cancer (Negrini et al, 1994), gastric carcinoma (Carvalho, et al., 2001), chronic lymphocytic leukemia (Amiel, et al., 1999), B-cell non-Hodgkin lymphoma (Gaidano, 1992), and others.
To define a small region on chromosome 6q containing a putative tumor suppressor gene for ovarian cancer, 70 ovarian tumors of three histological types were scored for loss of heterozygosity with nine restriction fragment length polymorphism markers located at 6q24-27. The results supported earlier suggestion that alteration of a gene on chromosome 6q may play an important role during development of serous ovarian tumors (Saito et al., 1992).
A detailed deletion map indicated a commonly deleted region between D6S193 e D6S149 loci; these markers were estimated to be 1.9 cM apart (Saito, 1992), but this distance was reduced to about 700-800 kb by physical mapping methods. Within this Region of Minimal Deletion (RMD) one or more tumor suppressor genes should be present.
Banga and co-workers showed that SV40-immortalized fibroblast cell lines share a deletion in this area based on assessment for loss of heterozygosity (LOH) for seven informative markers on 6q. They suggested the presence of a senescence locus, called SEN6, on 6q27. Inactivation of SEN6 may be responsible for immortalization of these tumors (Banga, et al, 1997). SEN6 overlaps to RMD. The genetic locus of the putative tumor suppressor gene was better delineated by Lin and Morin, who found an 80 kb homozygous deletion (HD) encompassing marker D6S193 (Fig.2) at 6q27 in a ovarian cancer cell lines (Lin and Morin, 2001).
Fig. 2 Contig of the HD region (from Lin and Morin, 2001).
The catp gene.
Our study begun with the project “Genetica Molecolare del processo di senescenza” at IRCSS Oasi Maria SS. - Troina (EN). The aim of this study was to identify genes present on 6q27 region.
By “direct cDNA selection” (Lovett, 1991), an EST was identified mapping to the RMD. It was present as single copy and contains a short open reading frame (360 bp) without introns. Analysis for this new putative gene begun with bioinformatics searches; however, nucleotide and protein Blast against sequence databases did not show any homology with known sequences, either nucleotidic or aminoacidic. For this gene the transitional name catp (Cytomembrane Associated Trafficking Protein) was chosen because bioinformatics analysis predicted the presence of a cytomembrane binding domain to its C–terminus. The EST has been deposited on GenBank with accession number AF453446.
30
Chapter 2
IDENTIFICATION OF A NOVEL GENE
RESULTS
Direct cDNA selection: identification of a cDNA mapping to 6q26 region.
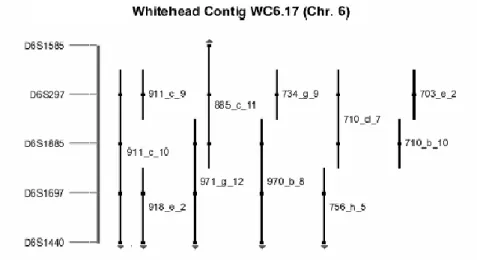
The RMD at 6q27 was the starting point of this study. A “direct cDNA selection” approach (Lovett, 1991) was devised in order to enrich and isolate individual cDNAs mapping to that chromosomal region, through hybridation of a fetal brain cDNA library versus genomic clones. mRNA composition in fetal brain is estimated to represent up to 70% of the genomic information. In order to identify genes present on 6q27, the YAC 911C10 was choiced since it mapped precisely on the region of interest (Fig.3), and subcloned in cosmids.
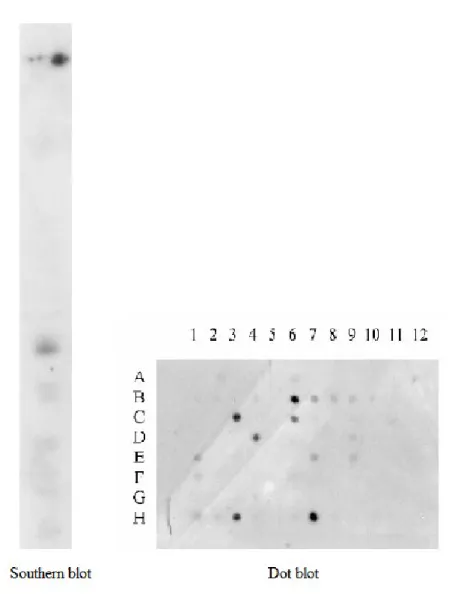
31 Inserts were rescued by PCR amplification with specific primers by nested PCR. The cDNA:DNA hybrids which resisted to high stringency washes were recovered by denaturation and PCR re-amplified. The cDNAs pool obtained was tested through Southern blot and dot blot both on YAC 911C10 and cosmids derived from it (Fig.4). All these data together suggest that at least one of the selected cDNA gave a prominent band on Southern blot and thus match the 6q27 region. The enriched cDNAs were finally cloned in pUC18 vectors and transformed in DH5α host.
32 A clone encompassing a 700 bp fragment was isolated, extracted, sequenced and subjected to bioinformatics analysis. Blastn versus genomic databases reveled that it matches BACs mapping to 6q26-27, while no match was seen against any EST library. This cDNA was then submitted to GenBank (AF453446). Overall, the data obtained suggest that this cDNA indeed mapped to 6q27, was present as single copy and was possibly a novel gene.
A single ORF 363 bp long was found within the cDNA sequence.
catp expression.
After identification of the gene, studying its expression was the first step to confirm its transcription in brain cells. RT-PCR experiments on cell lines of neuroblastoma and glyoma origin, revealed the presence of catp transcripts, even if at low levels. Neuroblastoma SH-SY5Y line gave more consistent results (Fig.5).
33
Mutational analysis.
The presence of catp within the RMD raises the question about its implication in tumors. Genes implicated in cancer, either sporadic or familial, often present mutations, either somatic or germline. The relevance of single point mutations for this argument led us to investigate for the presence of mutations on this gene.
One germline mutation was found in a preliminary screening of normal population from Sicily. It consisted in a point mutation causing Arg12 changing to Trp. Wild-type allele was called Up1 and the mutant UpB. The allelic frequency are 94% and 6% respectively. When cloned into pET expression vector in E.coli, alleles showed different growth properties. The wild type grew poorly and showed a phenotype compatible with oxidative stress. That plasmid was occasionally rearranged in colture; on the other hand, the mutant (UpB) did not show any problem in growth and DNA or protein syntheses were normal. Since alleles differ only by one point mutation, differences in growth ability appeared of some relevance. Further assays suggested that the difficult growth of the wild type allele was possibly due to Iron starvation, since growth was restored following addition of Fe citrate.
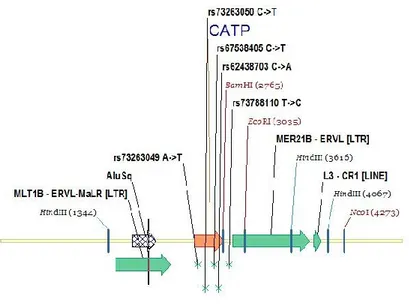
This consideration encouraged me to investigate for the presence of further mutations on this gene. SNPs are described in bioinformatics databases dbSNP short genetic variations (http://www.ncbi.nlm.nih.gov/snp/). Five SNPs are known to map within catp sequence (Fig.6).
34
Fig. 6 SNPs mapped to catp sequence.
In order to evaluate the presence of those variations in human population, we made use of DHPLC, a powerful techniques for identifying point mutations, to screen a sample of an African population from Burkina Faso. Four different heterozygote profiles were found (Fig.7). DNA from individuals belonging of each group was sequenced and three of the aforementioned SNPs were identified. One of them, rs73263049, represented the same c.34A>T transversion already found in Sicily; rs73263050 was found to create a missense mutation c.127C>T, causing Arg43 changing to Cys, and rs67538405 a nonsense mutation c.238C>T.
Those mutations were found arranged in four different genotypes, indicated in Table I as heterozygous groups.
35
36
Tab I Collections of mutants in human sample population from Burkina Faso.
Establishing the phase, i.e. the ways the mutation are arranged into alleles, was my next goal. To this purpose, I cloned PCR products in E.coli. Each plasmid now carried only one allele, so by sequencing I could establish the precise association (cis or trans) of mutations in those alleles. Surprisingly, all multiple mutations were found in cis arrangement. Allelic frequency for wild-type allele was about the same both in Sicilian and in African population samples, whereas lower frequencies were found for the other ones. Data collected allowed to define overall five alleles for the gene catp. Genotypes are showed in table II.
Allele name Genotype SNP # Aa substitution Allele frequency(%)
Up1 wt - - 94
Trunk c.238C>T rs67538405 Q80STOP 1 (Burkina Faso) Double c.127C>Tc.34A>T rs73263049rs73263050 R12W R43C 1 (Burkina Faso)
UpB Triple c.34A>T rs73263049 R12W 6 (Sicily) 3 (Burkina Faso) c.34A>T c.238C>T c.127C>T rs73263049 rs73263050 rs67538405 R12W R43C Q80STOP 1 (Burkina Faso)
Tab II catp alleles: genotypes and allele frequencies.
c.34A>T c.127C>T c.238C>T
hetero1 x SNP codon aminoacid
hetero2 x x x c.34A>T AGG → TGG R12W hetero3 x x c.127C>T CGC → TGC R43C hetero5 x c.238C>T CAG → TAG Q80STOP heterozigous groups mutations
37
Evolution.
Another way for analyzing the function of capt was comparing its sequence with those of Great Apes. Recent advances in genomic sequencing of Great Apes such as Pan troglodytes (chimpanzee) and Gorilla gorilla (gorilla), allowed to recognize a detailed model of molecular evolution for Higher Primates.
I was motivated to achieve a multialignment between human, chimpanzee and gorilla. The gorilla assembly was included with human chimpanzee and macaque in a 5-way whole genome alignment using the Ensembl EPO pipeline6. Using the UCSC genome browser and Ensembl, I was able to search and analyse the region of my interest in each species of interest. A multiple alignment was obtained with gorilla and chimpanzee sequences in the region corresponding to catp gene and flanking sequences (human chr6:167,078,690-167,080,192; chimpanzee chr6:169,870,326-169,872,575; gorilla chr6:168,084,094-168,543,716). Sequences from Homo neandertalensis and H. denisovian were omitted, since they were fully coincident with that of Homo sapiens sapiens; similarly, the sequence of orangutang were also omitted because it was found to be more divergent.
Multiple alignment shows high similarity among all sequences isolated. All of them presented a sequence high homologous with catp; so my attention was focused on variations within CDS (Fig.8). Three synonymous variations and four missense substitution were found; while nucleotide substitutions found in gorilla sequence are in some cases common to chimpanzee, a few other are peculiar of the former species. In particular, five sites, mutated in chimpanzee, are common in gorilla and in human; two synonymous substitution and five substitutions resulting in amino acid change occur only in gorilla; one synonymous and two amino acid substitution are common to chimpanzee and gorilla sequences. One of them, a first position transition 79C>T, seems more interesting because it introduces a Arg to Cys mutation; since this is followed by two consecutive Cys, a Cys triplet forms in human protein which is absent in Great Apes. Cys triplets are rare in protein databases (about 50 entries on 8 millions), especially in higher Vertebrates. Thus, one could believe that this mutation may constitute a gain of function in human compared to Great Apes. I did some preliminary experiments in order to test this hypothesis (see funcional analysis in yeast model).
38
Fig. 8 - Multiple aligment of catp sequence in primate. The point mutation giving rise to a Cys triplet in human is highlighted (yellow)
39
Distribution of catp alleles in human pathologies
Next goal was to investigate distribution of wild type and c.34A>T mutation (rs73263049) - the most recurrent among catp polymorphisms - in genomic DNA of different pathological samples.
Since the inverse association between cancer and neurodegenerative disorder, we analyzed patients affected by neurological disorder, such as Alzheimer Disease (AD), and others, and by cancers, particularly we addressed our analysis to myeloid leukemias (ML) since some level of expression of the region of our interest was detected in K562 cells, i.e. the first human immortalised myelogenous leukemia line (USCS genome browser data).
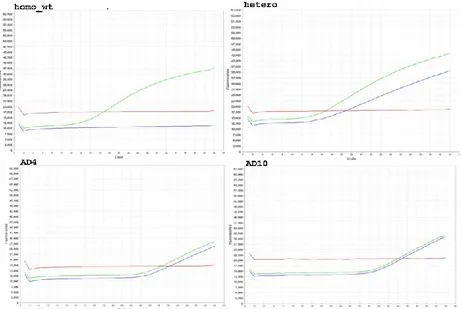
Custom SNP Genotyping Assay was designed (Applied Biosystems®) by submitting target region encompassing rs73263049 SNP, for Real-Time PCR SNP Genotyping experiments. Examples of fluoresce curve (Fig.9) obtained (StepOne™ Software) were shown for two heterozygous compared to amplicons of known alleles, used as positive controls.
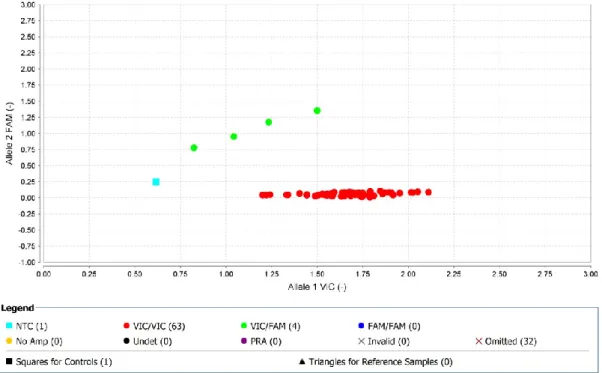
40 Allelic Discrimination Plot (Fig.10) was generated by dedicated Applied Biosystems® TaqMan® Genotyper Software: heterozygous samples found clustered with positive heterozygous control (green), while all wt-homozygous clustered together (red).
Fig. 10 Allelic Discrimination Plot example (TaqMan® Genotyper Software). Four AD heterozygous are shown.
Data so far collected are summarized in Table III; according to expected for low frequent allele, any c.34A>T homozygous and few heterozygous were found, however cohort's sizes are still too small for obtaining statistically significant results.
41 tot homo wt hetero homo 34A>T alleles tot allele wt allele 34T Minor Allele frequency Neurodisorder AD 85 78 7 / 170 163 7 4.12% EIEE 15 13 2 / 30 28 2 6.67% ASD 12 12 0 / 24 24 0 0.00% Cancers / AML 34 32 2 / 68 66 2 2.94% CML 9 8 1 / 18 17 1 5.56% ML tot 43 40 3 / 86 83 3 3.49% Melanoma 4 4 0 / 8 8 0 0.00% Tot 202 187 15 / 404 389 15 3.71% Tab III wild type and c.34A>T variant distribution in different pathological conditions.
A sample of 85 patients with clinical diagnosis of Alzheimer Disease (AD) was the widest group analyzed, Minor Allele Frequency (MAF) in AD found is 4.12%, c.34A>T seems to be slightly, although not significantly, hypo-represented. MAF calculated for Acute Myeloid Leukemia (AML) is even lower (2.94%).
I have also tested Autism Spectrum Disorder (ASD), which however, did not show any heterozygotes.
A cohort of children affected by Early Infantile Epileptic Encephalopathy (EIEE) with Intellectual Disability (ID) was investigated. Among them two heterozygotes were found: clinical diagnosis of acute ID and symptomatic partial epilepsy (time of first critical episode 9 months) and hypothyroidism; West Syndrome (spasms, psychomotor impairment and EEG hypsarrhythmia) are their clinical diagnosis. We know that both ASD and EIEE are complex multifactorial conditions, this, together with the small number of patients, makes data not totally meaningful. The same consideration can be extended to others tumor groups assayed: Chronic Myeloid Leukemia (CML) and Melanoma which count too little cases analyzed in our study.
I can conclude that although SNP c.34A>T frequency seems to be only slightly divergent with respect to normal population, the sample size of pathological samples is not adequate for obtaining statistical significance, especially when dealing with skewed allele distribution such that involving wt / c.34A>T. Further increase in sample size of pathological will be necessary to draw more exhaustive conclusion.
42
DISCUSSION
Evidences of catp as a novel gene
The gene catp could have been so elusive as to escape massive searches for genes, both bioinformatic and experimental (EST libraries), for several reason. The first reason consists in its sequence, which is unique. One more reason is that its expression level is apparently very low, at least in fetal brain. Moreover, it falls between two highly repetitive sequence, one of which (Alu) is possibily transcribed. It is known that automated removal of repetitive sequences was programmed in most, if not all, EST sequencing software. Finally, it presents a unique exon, while the most widely used softwares for gene identification mainly relies on intron-exon junction finding.
The results of my study allow to draw at least some conclusions. The frequency of the more abundant allele is about the same in Sicily and Burkina Faso; for this reason I assume it is the 'normal' allele; moreover, it is present in Neanderthal's and Denisov's sequences. An orthologous sequence with some point mutations is found in chimpanzee an gorilla. Amino acid substitution rate reflect the average of gene coding variations found in whole chimpanzee and gorilla genomes (The Chimpanzee sequencing and analysis consortium, 2005; Scally et al., 2012). Thus, catp gene could have evolved from a sequence common in Great Apes (both gorilla and chimpanzee) through a C->T transition, which in turn led to the substitution of the 28th aminoacid, Arg, with Cys. As a consequence, the peptide ArgArgCysCys gave rise to ArgCysCysCys, so that a very unusual Cys triplet was formed. In fact, screening the complete protein databases (including viruses, plants, bacteria etc.) allowed to find only about 50 Cys triplets on over 8 million proteins.
A key hypothesis of my study is that this aminoacid replacement led to a gain of function, and this possibility was addressed by functional analysis in yeast (see below). However, a further consideration should be discussed here. Let us assume that catp originated from a 'silent' DNA segment through the occurring of a mutation; however, one may wonder that a functional protein may arise in such a way. In fact, most, if not
43 all, proteins known have been shaped by evolutionary processes during millions years. The discovery of several alleles – apart from the wild type – in African population shows that some evolution of catp indeed occurred. Two point mutations, c.34A>T and c.238C>T, should have been independently originated; but at least one recombination event should be invoked in order to explain the formation of double and triple mutants (see Table II). Since this occurred on a DNA segment <300 bp long, a strong selective pressure, presumably against the c.34A>T allele, has to be postulated. Similar recombination frequencies, which are common in bacterial genetics, are quite unusual in human genome.
Analysing the alleles' distribution in two different groups of patients, including those suffering from brain-related diseases (epilepsy, autism, and Alzheimer diseases) and from leukemia, however, showed only slightly, not significant alterations in allele frequencies were found. It is possible, however, that much larger cohorts of patients should be recruited in order to get significant results.
44
Chapter 3
CATP PROTEIN
RESULTS
Bioinformatic predictions of CATP structure.
The catp gene contains a short open reading frame (360 bp) without introns, coding for a 121aa-long protein. Functional analysis of unknown proteins could be facilitated by homology studies by comparison with database of known genes or proteins, or secondary / tertiary structure prediction. Since CATP doesn’t shows any homology with known protein sequences, bioinformatics analysis was used to decipher some of the protein features through PROSITE on line tool (http://prosite.expasy.org). Secondary structure and disorder prediction obtained by InterproScan (Zdobnov et al., 2001) indicates the presence of a α-helix domain to its N-end (Fig.11). The remaining, including the C-terminus, was organized as coiled-coil, with the exception of two segments, located at residues 2-5 and 41-45, showing high scores for beta strand.
45 Further predictive bioinformatic analyses allowed computation of various
physico-chemical parameters such as MW of about 13 kDA, pI about 8, the presence of cytomembrane binding domain to its C–end (Fig.12).
Fig. 12 Computation of various physico-chemical properties of CATP obtained by PROSITE.
Designing a synthetic peptide and immunization.
The 17-mer synthetic peptide MRNETQNITRSHLSQRC was designed on the alpha-helical domain present in the N-terminal moiety of CATP. Peptide conjugation to ovalbumin was carried out through the peptide amino terminal using glutaraldehyde, as previously described (Reichlin, 1980). For polyclonal antibody production, two mice were inoculated intraperitoneally using alumina powder as adjuvant (Chase, 1967). After 3 weeks, mice were boosted with the same antigen and killed after one more week