2
Abstract: This thesis investigates the impact of information on economic outcomes. We find
empirical evidence that the high level of information to which consumers are exposed has the ability to influence their behavior.
In the three chapters of our thesis, we analyze three different fields. First, analysing data on Sanremo Festival, we show, through a Regression Discontinuity Design, that receiving an award have an impact on the commercial success of songs. Second, analysing data on cars sales and stock prices, we show that the Dieselgate scandal has an impact on the stock prices but not on the sales of the Volkswagen group. We use a Differences-in-Differences model and a RDD. Third, we investigate the impact of terrorism on the touristic sector, running a panel data model in some countries of the Euro zone and in the USA. Results illustrate that the terrorist attacks have both a long-run and a short-run effect on tourism.
In all the chapters, we find that a positive or a negative information could have an effect on the behaviour of people, and this consequently generates a positive or a negative economic performance.
Abstract: questa tesi studia l'impatto delle informazioni sui risultati economici. Le nostre evidenze
empiriche dimostrano che l'elevato livello di informazioni a cui sono esposti i consumatori ha la capacità di influenzare il loro comportamento.
Nei tre capitoli della nostra tesi, analizziamo tre diversi ambiti. Innanzitutto, analizzando i dati sul Festival di Sanremo, mostriamo, attraverso un Regression Discontinuity Design, che ricevere un premio ha un impatto sul successo commerciale delle canzoni. In secondo luogo, analizzando i dati relativi alle vendite di automobili e ai prezzi delle azioni, dimostriamo che lo scandalo Dieselgate ha un impatto sui prezzi delle azioni ma non sulle vendite del gruppo Volkswagen. Usiamo in questo caso un modello Differences-in-Differences e un RDD. In terzo luogo, esaminiamo l'impatto del terrorismo sul settore turistico, eseguendo un panel data model in alcuni paesi della zona Euro e negli Stati Uniti. I risultati mostrano che gli attacchi terroristici hanno sia un effetto a lungo termine che a breve termine sul turismo.
In tutti i capitoli, scopriamo che un'informazione positiva o negativa potrebbe avere un effetto sul comportamento delle persone e questo di conseguenza genera una performance economica positiva o negativa.
3
Impact of positive and negative
information on economic outcomes
Author: Salvatore Rizzo
Supervisor: Vincenzo Scoppa
4
Table of contents
Introduction 5
1. Cultural prize and economic success: evidence from the Italian Sanremo Music Festival 9
1.1 Introduction 9
1.2 Literature 10
1.3 The Sanremo Festival 19
1.4 The data 20
1.5 Descriptive statistics 21
1.6 First application: effects on total points in hit-parade (a proxy for sales) 23
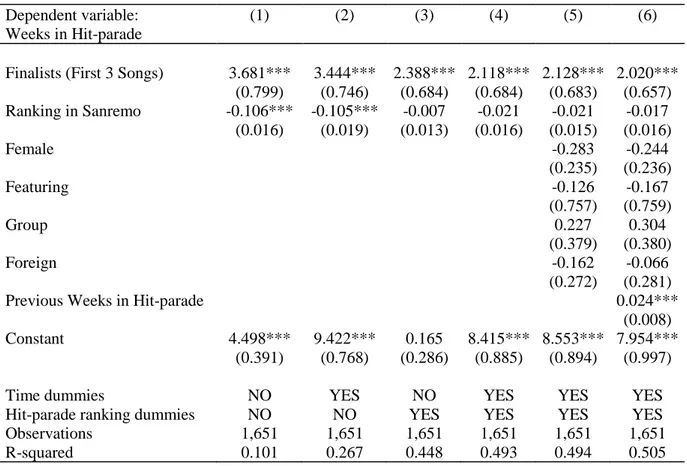
1.7 Second application: effects on weeks in hit-parade 34
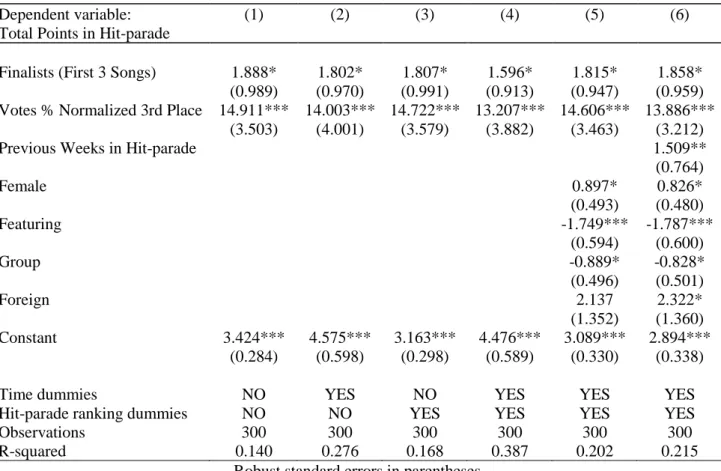
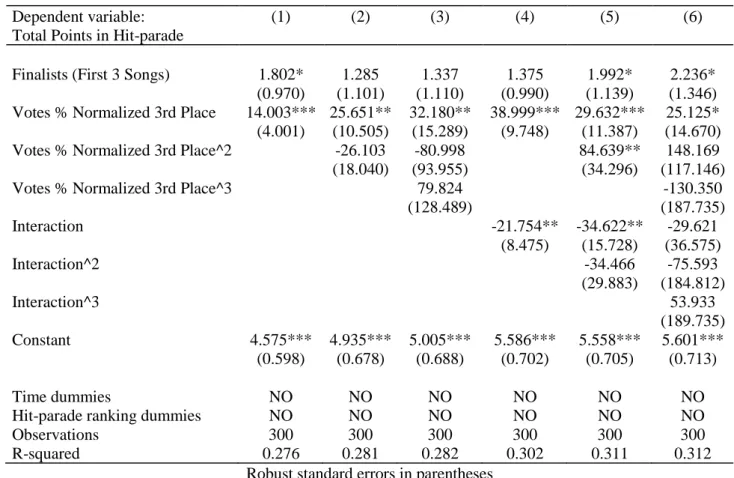
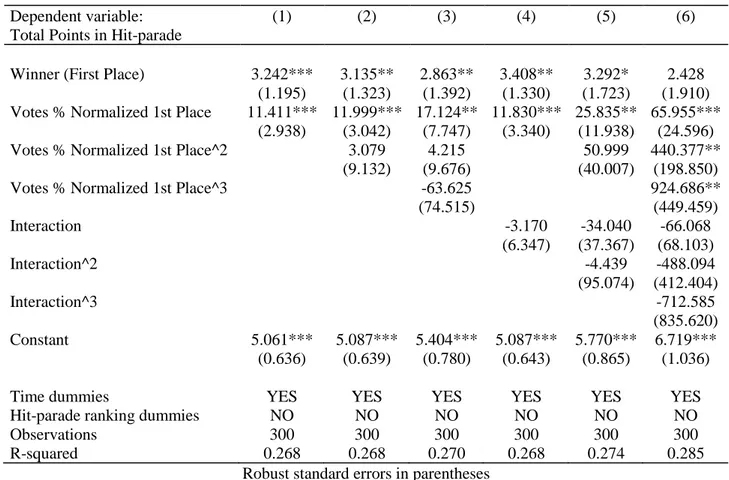
1.8 Third application: effects on total points in hit-parade using votes percentage 43
1.9 Concluding remarks 52
1.10 References 52
2. Impact on sales and on market value of a negative product information: evidence from the
Dieselgate scandal 54
2.1 Introduction 54
2.2 Literature 56
2.3 The Dieselgate 65
2.4 The data 66
2.5 First application: differences-in-differences analysis on car sales 68 2.6 Second application: differences-in-differences analysis on stock prices 74
2.7 Third application: RDD analysis on stock prices 79
2.8 Concluding remarks 86
2.9 References 87
3. Terrorist attacks and impact on tourism: evidence from Europe and USA 89
3.1 Introduction 89
3.2 Literature 90
3.3 Terrorism: definition and attacks 101
3.4 The data 102
3.5 Model 104
3.6 Estimations and outcomes 105
3.7 Concluding remarks 120
3.8 References 121
Concluding remarks 123
5
Impact of positive and negative information on economic outcomes
Introduction
This thesis investigates the impact of information on economic outcomes in different fields. The word information derives from the verb “to inform”, that means the knowledge that people gain from studying or experiences. In particular, we are interested to the effect of information that people receive from the media.
The technological development of the last decades has had the great merit of bringing information to a global level. Acquiring information turns out to be now easy and immediate for most of the inhabitants of the world, who access quickly to any kind of news through internet, television, radio, newspapers. This high level of access to information has the ability to influence the judgments and assessments of consumers who have direct contact with what is happening in every part of the world.
We find that a positive or a negative information could have an effect on the behaviour of people, and this consequently generates a positive or a negative economic performance for the subject to which the information refers.
The thesis is divided into three chapters, each of which is referred to a research in a different field. The titles of the researches are:
• Cultural prize and economic success: evidence from the Italian Sanremo Music Festival • Impact on sales and on market value of a negative product information: evidence from the
Dieselgate scandal
• Terrorist attacks and impact on tourism: evidence from Europe and USA
The first research investigates the impact of the Sanremo music prize on the economic success of songs in the Italian market. It refers to the cultural field, with the purpose of adding new evidence to the line of literature to which it refers. Using a Regression Discontinuity Design, we show that receiving an award have an impact on the commercial success of songs.
In the second research, we analyse data on cars sales and stock prices of the major companies of the automotive industry, with the aim of estimating the effect of the Dieselgate scandal on economic performances of the sector. We use a Differences-in-Differences and a Regression Discontinuity Design, showing that the scandal had an effect on the stock prices of the companies involved, but not on the sales.
The aim of the third research is to estimate the impact of terrorism on the touristic sector. We analyse, in 16 different countries (Europe and USA), the principal terrorist attacks of the last 3
6
decades and their impact on indicators of tourism performance. The panel data model used show us that terrorist attacks have both a long-run and a short-run effect on tourism.
All the three researches are united by the theme of ‘information’. In the first case the information is positive, referred to the assignment of a cultural prize; in the second and third cases the information is negative, referred respectively to negative features of a product and to negative events in a nation. In each case, we analyse the effect of an information that is made public and that negatively or positively have an impact on economic performances in different fields.
In order to prove our hypotheses, we consider a wide literature regarding the effect that information has on consumer choice. We analyse the role of information in three different scopes: artistic products, physical products and experience products.
With reference to the information related to artistic products, artists such as musician, singers, writers, filmmakers, painters, have to produce appreciated goods, in order to intercept the cultural taste of consumers. This allows a good reputation of cultural products and consequently a higher volume of sales. In this market, awards have a great influence on the perception the consumers have on products. For example, if a film wins the Oscar or it receives an Oscar nomination, it is more likely to be seen by the consumers. This behaviour is driven by expert judgement, that gives information a priori about the high quality of the cultural product. Therefore, information given by the assignment of a prize is perceived as synonymous of good quality: the consumer is more inclined to buy a product which is already marked by a quality title. They exist interesting empirical results about this thesis.
Jerrell and Peltzman (1985) test any losses incurred by entrepreneurs following the withdrawal from the market of products judged defective. The report takes into consideration the markets of two goods: cars and medicines. The main conclusion is that the market penalizes entrepreneurs considerably, resulting in a total cost higher than the simple direct costs, due to a deterioration of the company's image.
Another important result of the study by Jerrell and Peltzman is that any loss of credibility of a single company causes disadvantages to the entire sector of reference.
A wide literature range confirms that positive information influence consumer choices. In the field of cultural products, in markets with imperfect information, consumers tend to trust experts. Ponzo and Scoppa (2015) show that winning the Strega Prize significantly increases the cumulated sales of a book.
7
Berger, Sorensen and Rasmussen (2010) demonstrate that also negative publicity can increase sales by increasing product awareness, but this is valid especially if it is referred to less known writers: even if negative reviews have a negative impact on the most popular author’s books, they have a positive effect for not famous author’s books.
The influence of information is also verified in the branch of cinema. It has been proved that Oscar nomination positively affects the financial success of the movie, in relation to the weekly returns and to the survival time (Deuchert, Adjamah and Pauly, 2005). A similar research conducted by Nelson et al. (2001) examines how information about Oscar nomination and award for best picture, best actor, and best supporting actor can influence movie sales.
All these researches inspire our interest in testing if the information has a real effect on the sales in an artistic field. We focus our first research on the Sanremo Music Festival.
With reference to the information related to physical products, different researches prove that product quality affects consumer demand and stock prices.
Markets characterized by asymmetric information are based on reputational mechanisms. For this reason, firms aim to produce quality products. Consumers pay attention to information about the quality of products they would like to buy: negative news about the functioning of a product, bad reviews on a website of e-commerce, unfavourable word of mouth concerning a good shift negatively the demand for the product. If firms want to preserve their reputation, and consequently the rents on future sales, they have to maintain high quality standards of their products and services. Another element affected by the bad or good reputation is the financial performance of a company (McGuire et al., 1990). The information is relevant in the short period as in the long period. (Roberts and Dowling, 2002).
Bachmann et al. (2018) conduct a research on the same theme of our research, the Dieselgate scandal, to provide causal evidence that group reputation externalities matter for firms. They show significant declines in the U.S. sales and stock returns of some German car brands, due to the fact that Volkswagen’s episode injured the reputation of all the “German car engineering” group in the United States. They show that not only the Volkswagen group, but also BMW, Mercedes-Benz, and Smart reputation results damaged by the Volkswagen scandal.
De Paola and Scoppa (2013) analyse a product recall in the food industry, computing the effects of negative information on the sales of involved brands. In 2008, in Italy, a fraud has involved some leading firms in the cheese sector. The research shows how the negative publicity on product quality has led to a consumers’ demand shift from involved to not involved brands, and these effects continue in the long-term. The consequences of the negative information affect the retailers.
8
Roberts and Grahame (2002) prove that there is a positive relationship between reputation and financial performance: good corporate reputations create value for the company. Firms with relatively good reputations are better able to sustain superior profit outcomes over time.
With reference to the information related to experiential products, an event may affect the sales of this kind of goods. When the event is represented by a terrorist attack, the negative effect provoked by information could affect the sales of an entire country. Some researches show that there is a relationship between terrorist attacks and tourism: there is unidirectional causality from terrorism to tourism in the short-run and in the long-run, with no evidence of reverse causality (Liu and Pratt, 2017).
Kosová and Enz (2012) study the impact of the terrorist attacks of September 11, 2001 on US hotel performance. They control for market factors, such as inflation and seasonality, and for hotel characteristics, such as size, segment, or operation type. They find that New York’s luxury hotels were the most affected by the terrorist attack.
Tourists have to take into account the unpredictability of terrorism when they organize their travels. Also the research of Pizam and Smith (2000) sustains that terrorism acts have effects on tourism destinations. They investigate the major terrorism events around the world from 1985 to 1998, classified by date, location, victims, weapons used, severity of damage, motive, effect on tourism demand, and length of effect. They conclude that information on terrorism appear to be inextricably linked to tourism performance of a country.
Since our three researches treat different economic fields, the literature’s review is expressed differently in each chapter.
The thesis is organized as follows. In Chapter 1 we expose the research on the Sanremo Prize. In Chapter 2 we set out the research on the Dieselgate scandal. In Chapter 3 we present the research on terrorist attacks. In the last section, we draw concluding remarks, exposing the economic outputs common to the three researches.
9
1. Cultural prize and economic success: evidence from the Italian Sanremo Music Festival
Abstract: Analysing data on Sanremo Festival, the most popular Italian music Prize, we show that receiving an award have an impact on the commercial success of songs. We model a Regression Discontinuity Design, using as dependent variable two different measures for song sales, expressed by the ranking in parade (a national musical ranking) and the presence in different weeks in Hit-Parade.
1.1 Introduction
We are interested on the prize effect on the economic success of songs and of artists. This would confirm the empirical evidence that prizes express quality and that they affect consumer choices. We try to understand if awards affect consumers’ choices or, conversely, if awards are conferred to the highest quality products.
A serious econometric problem in estimating the impact of the awards on the sales is the omission from the regression of an unobservable variable: the song’s true quality. This variable has surely an impact on sales. We can also observe that prizes are normally given to high-quality products. Then, if we estimate a regression of sales on a variable “Prize”, that indicates whether an award is obtained while omitting a measure of product quality, then the variable “Prize” might gather the effect of quality without having any independent effect on sales. Therefore, the coefficient on the prize will be upward biased.
In order to avoid estimation biases, we use a regression discontinuity design (RDD) using a measure for song sales as the dependent variable and, as a forcing variable, the ranking of the Sanremo Festival. Each year, the competing songs receive votes from different juries, some composed by experts and other by normal people, and the song that receives the largest number of votes wins the Sanremo Festival. In our RDD model, the evidence of treatment effects are the jumps in the relationship between sales and votes near the threshold of votes percentage necessary to win the Sanremo competition.
As a dependent variable, we should use data on song sales, but these are rarely available, therefore we use the Hit Parade ranking, that is a good proxy for the weekly sales, because it gives a position to the most sold songs of the market, for each week.
We use data on the Sanremo Festival ranking, the most famous Italian music competition, for 59 years, from 1959 to 2017.
10
1.2 Literature
A wide literature investigates the effect of cultural awards on success, in different artistic contexts, such as music, books or films.
Ponzo and Scoppa (2015) perform a research in literary context. Using data on the Strega Prize, the most important literary prize in Italy, they find a strong influence of the prize on book sales, showing that most of the impact happens in the weeks following the announcement of the Prize. The authors show therefore that expert’s judgment influences books success.
They use data from three different datasets:
- the Strega prize ranking, with the number of votes that each book received from the expert’s jury, over a period of 66 years
- number of copies of each book owned by members of aNobii, an international website for book lovers
- the bestseller lists published weekly by the leading Italian newspaper “La Stampa”, over a period of 30 years.
The authors use two different models for the analysis: a sharp Regression Discontinuity Design (RDD) model and a difference-in-differences model.
In the RDD model they use the jury votes as a proxy for quality, that is the forcing variable, and they study the relationship with the sales. The votes are normalized subtracting from the effective number of votes received the votes received by the second ranked book in the competition plus one. Zero is the threshold: when the variable vote is equal to or greater than zero, the treatment of winning the Strega prize is received. In order to estimate the treatment effect, they compare the sales of those books that receive a number of normalized votes just above and below the cut-off of zero.
The estimates of the RDD model are clear: there is a jump in the relationship between the proxy of sales and the number of votes near the cut-off. Then the positive effect of the Strega Prize on sales is confirmed: winning the prize increases by about 500% the cumulated sales of a book.
The difference-in-differences model uses the average number of weeks on the bestseller lists for winners and non-winners of the Strega Prize. There is a comparison before and after the Strega Prize assignment, between these two measures. The authors find that, under the hypothesis that no other differences affect the two categories of books contemporaneously to the treatment, the difference-in-differences can be interpreted as the direct effect of the prizes on awarded books. The authors also analyse data based on weekly level instead of that aggregated for longer spells. The regression shows that the effect on sales of winning Strega Prize is huge: the prize is
11
announced in July, in this period the probability of being on bestseller list increases by 45.7%, while the probability for non-awarded books slightly decreases when the Prize is announced.
Ponzo and Scoppa (2015) conclude that winning the Strega Prize increases by about 500% the cumulated sales of a book (RDD) and that the Prize has an immediate effect when it is announced, but this decreases in the following weeks (difference-in-differences). The authors are confident they are capturing a causal effect of the Prize because they use two different measures of book sales and two different econometric strategies. It is confirmed that the awards are a signal for the quality of a cultural product in markets with imperfect information: consumers tend to trust experts.
Ginsburgh and Van Ours (2003) analyse the Queen Elizabeth music competition, the best-known international competition for piano and violin, organized in Belgium.
Their key question is whether experts’ opinions reflect true quality, or whether they influence economic outcomes independently of their value as a signal of quality. It turns out that a critical determinant of success in the competition is the order in which musicians perform and this order is assigned randomly.
They use data on the Queen Elizabeth competition ranking for 11 years, held between 1952 and 1991. The total number of musicians is 132, they collect data about some individual characteristics like sex, nationality, age at the moment of the competition, time elapsed between the competition and the date at which the success indicator is observed, order of performance, and final rank (one to 12). They also collect indicators of success such as the presence in catalogues and ratings by Belgian music critics.
The authors estimate the effect of ranking on success using a Two Stage Least Squares model. The order of appearance is used as an instrument for success. In fact, the order of appearance, that is randomly chosen, is not correlated with quality or with any observable characteristic of performers, it can be used to identify the nature and effect of ranking on success.
The research uses a probit equation and a tobit equation, both estimated through maximum-likelihood methods.
The results show that the order of appearance has a positive effect on both success indicators. This indicates that musicians that appear before seem to lead to more success.
The authors also investigated whether characteristics other than the order of appearance possibly contribute to success: gender, age at the time of the finals, nationality, and year of the competition have no significant effect.
In conclusion, musicians with high scores are more likely to record their music work and the opinion of music critics is more influenced by the ranking than by the quality of the pianist.
12
Ginsburgh (2003) illustrates that prizes awarded shortly after the production of an artwork or rankings that result from competitions are correlated with economic success and may even influence or predict it, but are often poor predictors of true aesthetic quality or survival of the work. The research investigates awards taken from three different artistic contexts: movies, books and music.
The first research is about movies. Part of the data derives from three different lists of all-time best movies (America's 100 greatest movies, Mr. Showbiz critics pics, The 100 must-see films of the 20th century) in which they are cited 77 movies produced between 1950 and 1980.
Other data are information about the economic success of the film. Since it was difficult to measure box office gross ticket sales, it is considered the amount of money paid by movie theatres to producers and distributors to show a film. The final sample contains 559 movies, taking together the movies nominated for or winning Oscars, the movies from the top 100 lists and the top five film rentals in each year.
The model is a simple OLS with three different equations. The first one shows that winners are significantly associated with higher success, but it is difficult to say whether awards influence the success or whether the prize is assigned to the most popular film, since the movies are projected in cinemas before the award assignment. In the second equation, a standard F-test shows that movies listed in the top 100 do better than others, but the number of lists on which a movie is present makes no difference. The third equation takes both groups of variables together and shows that Oscar winners and nominees still pick up significant coefficients, while only those movies that are cited in all three best movies lists are then associated with short-run success.
The second research is about books, it investigates the Booker Prize, rewarding the best novel of the year written in English. Data about success of the book are measured by the number of editions published during the ten years after the selection. These are taken from the website Amazon.com. Other data derive from the online catalogue of the Library of Congress: the number of titles different from the winner book but belonging to the same author.
The OLS model, divided into three equations, shows that winners are not more successful than nominees.
The third research is that of Ginsburgh and Van Ours (2003) on the Queen Elizabeth competition, explained before.
In conclusion, despite there are some differences in the three case studies, the main results are very similar: awards, prizes and critics may have an impact on success.
13
Haan, Dijkstra and Dijkstra (2005) find that expert judgement is a better expression of quality, compared to popular judgment. Indeed, expert judgement is less sensitive to factors unrelated to quality than public judgment. The popular jury could be influenced the most by the singer’s former success. Their research, unlike the others, is not about the economic success of the song, but only about the jury composition.
They refer to the Eurovision Song Contest, the European song competition, that has had different juries’ composition among the years. The authors collect data for 41 years, from 1957 to 1997, about the order of appearance and the final ranking of the contest. Since not all festivals have the same number of contestants, they normalize these values. In total, there are 758 contestants in the dataset, divided into four categories: male singers, female singers, duos and groups.
An OLS estimation regresses the final ranking on the order of appearance and on other characteristics of the singer. It comes out that a song that is performed later during the contest stands a much better chance of obtaining a good position in the ranking.
To test the hypothesis of this research, the authors collect another dataset, with data for a total of 70 national finals. Many countries use both the expert and the popular jury for the national competition. The OLS regression shows that the song that is performed first has a rank that is lower than the song that is performed last, this has a great impact on the position in the final ranking. Furthermore, it shows that experts are a better judge of quality than the general public.
This study has two main conclusions. First, it provides evidence that there are ordering effects when judging music contests. An ordering effect exists not only for contests judged by experts but also for those judged by the general public.
Order effects can be a major source of economic inefficiency, not only in cultural contests but also in other contexts where the quality of several candidates needs to be compared (i.e. job interviews and the grading of exams).
The second contribution of this paper is that experts are unambiguously better judges of quality, at least in the sense that the outcomes of contests judged by experts are less sensitive to exogenous factors that clearly do not influence the quality of output. Nevertheless, experts are not perfect, because their judgment does depend on such factors.
Berger, Sorensen and Rasmussen (2010) argue that negative publicity can increase purchase likelihood and sales by increasing product awareness. In three different studies they show that, in the New York Times, even if negative reviews have a negative impact on the most popular author’s books, they have a positive effect for less known author’s books. Their results are in contrast with all the existing studies of negative publicity, that have found its effects to be negative.
14
The first study uses weekly sales data to estimate the impact of New York Times book reviews on the sales of more than 200 hardcover fiction titles. The OLS regression shows that for books by established authors, a negative review led to a 15% decrease in sales. For books by relatively unknown and new authors, negative publicity has the opposite effect, increasing sales by 45%. The second study provides a more controlled experiment of the effects of negative publicity. The authors directly manipulated both publicity valence and product awareness to examine how they influence purchase likelihood. Few consumers want to read a bad book or see a movie they know will be terrible, but over time, the valence of publicity for unknown products may be forgotten, leading positive and negative reviews to have a similar effect. To test this possibility, the authors manipulated whether people reported purchase likelihood either right after reading a product review or after a delay. The group of experiment is composed by 252 participants. The model used is an analysis of variance (ANOVA) of type 2 (review valence: positive versus negative) x 2 (time: delay versus no delay) x 2 product awareness (well known versus unknown). Participants reported they would be more likely to purchase well-known products that were positively reviewed, regardless of whether they reported purchase likelihood right away or after a delay. In contrast, for unknown products, a delay moderated the effect of review valence on purchase likelihood. Viewed another way, the effect of a negative review for an unknown product became more positive after a delay such that purchase likelihood after a delay was similar after a positive or negative review.
The third study examines whether positive effects of negative publicity are driven by increased awareness. The authors use a 2 (prior product awareness) x 2 (review valence) x 2 (product reviewed) full-factorial mixed design.
Results of Study 3 again demonstrate conditions under which negative publicity will have positive versus negative effects. Compared to no publicity at all, whether the same negative review increased or decreased purchase likelihood depended on existing awareness about the cultural product being reviewed. Whereas a negative review decreased purchase likelihood of a book that was already well known, it increased purchase likelihood for a previously unknown book.
The result of the three studies is that the paper is the first to demonstrate beneficial effects of negative publicity, and then to delineate conditions under which negative publicity will have positive versus negative effects.
Sorensen (2007) performs a research on the impact of the bestseller list published on the New York Times and on sales and product variety. It comes out that appearing on the list leads to a modest increase in sales for the average book, and that the effect is more dramatic for bestsellers by debut authors.
15
The dataset is composed by weekly national sales for over 1,200 hardcover fiction titles that were released in 2001 or 2002, provided by the market research firm Nielsen BookScan. Information about the individual titles, such as the publication date, subject, and author information, was obtained from a variety of sources, including Amazon.com and a volunteer website called Overbooked.org.
In a first analysis of the data, Sorensen finds that book sales are remarkably skewed in two important ways. First, the distribution of sales across books is heavily skewed. Second, book sales tend to be skewed with respect to time for any given title: sales tend to be heavily concentrated in the first few weeks after a book’s release.
The author models book sales as an autoregressive process in which the autoregression parameter is a function of covariates. The model can accommodate unobserved, book-specific heterogeneity in both the level and trajectory of sales.
The regression results confirm that appearances on a bestseller list have a direct impact on sales. But why the list has an impact? The author explains the idea that bestseller status is informative: for example, bestseller appearances could signal high quality, or signal what other people are reading. Another possibility is that sales increases result from promotional activities undertaken for bestsellers. A third explanation would be that the increases are merely price effects, resulting from the automatic discount that many stores offer on current bestsellers.
Another question the author tries to answer is “Do bestseller lists affect product variety?”. In other words, to what extent are those extra sales ‘stolen’ from non-bestselling titles?
If substitution between non-bestsellers and bestsellers is important, then, presuming that books in the same genre are closer substitutes than books in different genres, sales of non-bestselling books should decline when the bestseller list is comprised of books in similar genres. To capture these kinds of substitution patterns, a variable summarizing each book’s similarity to the current set of bestsellers is constructed by comparing the book’s genres to the genres of all books on the current bestseller list. It is launched a regression with sales used as dependent variable, and all bestsellers, new on list, weeks out, week dummies and subject dummies as independent variables. The results suggest a complementarity between bestsellers and non-bestsellers. The effect seems to be most pronounced for books appearing on the list for the first time: when the similarity measure is defined only for the subset of bestsellers whose first appearance was in the given week, the positive effect of the similarity is stronger.
The final remarks of this research confirm that appearing on the New York Times bestseller list has a direct impact on the book’s sales. However, given the amount of attention paid to the New York Times list, the estimates of its impact may seem surprisingly small, because the magnitude of the
16
effect is modest. The analysis ignores two effects that could be quite significant to authors and publishers. First, while appearing on the bestseller list may have only a modest immediate impact on the book’s sales, it may dramatically increase the popularity of future books by the same author. Second, paperback sales may be influenced by whether the hardcover edition was a bestseller. Unfortunately, these effects can’t be measured with the data owned by the author.
Deuchert, Adjamah and Pauly (2005) investigate the effect of Oscar nomination and awards on the financial success of the movie, in relation to the weekly returns and to the survival time.
The movies analysed are all released in the US in the years from 1990 to 2000. Excluding some outliers, the movies that have total box office revenues of less than 10000$, the final sample includes 32040 observations, for a total of 2244 movies. 144 of these movies were nominated in at least one of the five categories under consideration which are “best picture”, “best actor/actress in a leading role”, and “best actor/actress in a supporting role”. 40 movies won in at least one of these categories. Data on box office returns, release dates, and details on genre and distributor are taken from Variety’s Weekly Box Office Chart, on the website www.variety.com. Data on nominations, awards and the dates of Oscar ceremonies are available from the Internet Movie Database on the website www.IMDb.com.
To analyse the effect of quality on financial success the authors consider two different directions of causality: first, movies with higher quality might attract larger audiences in a given week and, hence, should show significantly higher average weekly box office revenues. Second, movie theatres are constrained by their seating capacities and thus only a certain number of tickets can be sold per time unit.
The output comes out from two different models.
In the first model, there is a focus on the impact of nomination and award on weekly returns. There is the assumption that the effects of nomination and awards do not diminish but are constant over time. The logarithm of the weekly box office revenue is the dependent variable. The independent variables are the number of weeks a movie has already been released, the logarithm of the box office revenue of the opening week, seasonal effects which are captured by dummy variables for the quarter of the year, movie-specific variables captured by dummy variables for genre and for each of the five major distributors, and the nominations and awards by including dummy variables in each of the categories. The Academy Awards categories considered are “best picture”, “best actor/actress in a leading role”, and “best actor/actress in a supporting role”, because they are the most prominent ones.
17
Coefficients show that where 1% higher box office results of the opening week results in 0.3% higher box office revenue in the following weeks. However, there isn’t a snowball effect of the first week’s revenue that drives the weekly box office revenues of the following weeks up because the effect of the opening week is rather small. It seems more likely that blockbusters are successful from the first week onwards. Outputs show that a nomination in the categories “best picture” or “best actor in a leading role” increases the weekly box office revenue of the following weeks by more than 200%, while a nomination for “best actress in a leading role” increases weekly box office revenue by almost 150%. The coefficients for winning an award are not significant, so surprisingly there is no evidence for the hypothesis that winning an award generates revenue in addition to nominations.
In the second model, there is a time-dependent impact of nominations. In the model are introduced dummy variables for the nomination of Oscar winners and only nominated movies are set equal to one for all weeks following the announcement, including the week of the announcement itself. There are also dummy variables that capture whether a movie was still shown in movie theatres in the weeks following the nomination and on the week of the nomination.
Three hypotheses are tested in this second model: hypothesis 1, awards generate revenues in addition to the effects of nominations, then Oscar winning movies should show a significant jump in weekly box office revenue after the announcement of the winners (in week 7 after
the announcement of nominations and the following weeks); hypothesis 2, the audience punishes movies that are nominated but do not win, with lower attention. Thus, these movies should show a significant fall in weekly box office revenue after the announcement of the winners; hypothesis 3, Oscar winners benefit more from a nomination than movies that are nominated but do not win, then the parameter estimates for winning movies should be considerably larger than the corresponding parameters for only nominated movies in the weeks before Oscar night.
The duration of nomination effects on box office revenue differs widely within categories, ranging from 29 weeks in the category “best picture” to only four weeks for “best actress in a supporting role”. The impact of nominations exceeds the announcement of winners even for those movies that do not win. Surprisingly, longer-lasting nomination effects can be found for movies that did not win. Significant nomination effects of movies that did not win can be found until 20 weeks after the announcement of the nominations. Winning movies tend to enjoy a higher initial boost in revenues, until week 7, but this effect seems to diminish very quickly, while nomination effects for movies that did not win seem to be more constant.
The results show that, for the first hypothesis, there is no immediate effect of winning, since the parameters of week 7 and week 8 do not differ significantly from the parameters of week 6. For the
18
second hypothesis, there is no immediate punishment for not winning, as there are not significant differences for week 7 and week 8. For the third hypothesis, winning movies are not significantly different from only nominated movies.
In conclusion, the paper shows that the awards have a positive effect on the sales, but the main box office effect is generated primarily by the nominations.
Nelson et al. (2001) examine the impact of an Oscar nomination and award for best picture, best actor, and best supporting actor on a film’s market share of theatres. Furthermore, they examine the average revenue per screen and the film’s probability of survival.
The research data were obtained from Variety, a weekly trade journal for the entertainment industry. In the period 1978-1987, of 131 films were nominated for best picture, best actor, or best supporting actor awards. In addition, it was created a control sample of 131 non-nominated films: for each nominated film, a non-nominated film released in the same week was chosen, the highest ranked non-nominated film that remained on the top 50 charts for a minimum of five weeks was selected. The final combined sample of nominated and non-nominated films totals 4,544 observations. For each film, the authors compute the percentage of total screens on which the film appears and the average revenue per screen.
Observing the descriptive statistics, the authors find evidence of seasonal fluctuations, generally reaching a peak around Christmas, declining in the late winter and spring months, increasing during the summer vacation months, and then declining again in early fall.
Two OLS models are created for the estimation of the award’s effect. In model 1 the impact of a nomination is captured by the number of nominations a film receives for best supporting actor, best actor, and best picture. The model 2 is more flexible, it has more variables that allow to overcome some shortcomings of the first model.
The parameter estimates common to both models are similar in sign, magnitude, and statistical significance. A nomination or award for best supporting actor appears to have little if any impact on the percentage of total screens on which the film appears and on the average revenue per screen. A nomination for best actor has a positive and statistically significant impact on the percentage of total screens on which the film appears in both models and a positive but insignificant effect on the average revenue per screen. An award for best actor has a positive and statistically significant effect on both the variables listed above in both models. Finally, a nomination and award for best picture have a positive and significant impact on both the variables in model 1.
19
the impacts of a nomination and award are independent of the release date and constant in the weeks following the announcements of the nominations and awards. On the basis of these test, results they employ the estimates from model 1 in calculating the predicted values of an Oscar.
In the final step, they determine the impact of a nomination or award on the film’s probability of survival. Films that receive Oscar nominations or awards generally remain on the Variety Top 50 chart longer than non-nominated films; an Oscar nomination or award thus enhances a film’s probability of survival. A parametric survival function is used, based on the assumption of a Weibull distribution. The Weibull distribution allows for duration dependence and facilitates the incorporation of covariates. The results indicate that a nomination or an award for best picture has a positive and statistically significant effect on the survival of a film. In the weeks following the announcement of the awards, however, the films receiving an Oscar for best actor and best supporting actor experience a positive and statistically significant increase in the probability of survival. Finally, the negative and statistically significant coefficient for the lagged duration variable indicates that the probability of survival in the next spell is inversely related to the length of the previous spell. Thus, for example, films that were in the theatres for 20 weeks prior to the nominations have a lower probability of survival following the nominations than films that were in the theatres for 10 weeks prior to the nominations.
In conclusion, the results indicate that a nomination or award for the “top” prizes, such as best picture and actor, generally has a positive impact on a film’s probability of survival, its market share of screens, and the average revenue per screen, while a nomination or award for “lesser” prizes, such as best supporting actor, has little if any impact on these variables. The authors conclude that Rosen’s (1981) theory of superstars, in which small differences in talent or quality translate into large differences in earnings, may well be applicable to the motion picture industry. Finally, the competition for an Oscar may be viewed as a two-stage, single-elimination tournament, in which films first compete for a nomination with the survivors then competing for the award.
1.3 The Sanremo Festival
The Sanremo Festival is the most important Italian music prize, it is also called “Italian song festival”. In 1951 Angelo Nicola Amato, the director of public relationships of the Sanremo casino, and the radio speaker Angelo Nizza, organized the first edition of the Sanremo Festival. From that year, the contest takes place every year in the period of February March. At the beginning, it took place in the Casinò theatre until 1976 and, from the following year, in the Ariston theatre; both the theatres are in the city of Sanremo; only in 1990 it took place in a different place, in the occasion of the 40th edition, because there was a larger audience to accommodate.
20
Until 1954, the Festival editions were transmitted exclusively through the radio. Subsequently to this date, the contest became a TV show, transmitted in Eurovision from the TV channel Rai Uno. During the exhibition, the singer is always accompanied by an orchestra. Only during the 80s, the singers performed without the orchestra accompaniment, singing live on a previously registered musical base, or in playback.
The television audience peak was reached in 1987, with a share of 61%, followed by the year 1995 with a share of 66,42%.
The Eurovision Song Contest is inspired to the Sanremo Festival: in 1955 Europe had just emerged from the war and there was the expectation of a TV program which could involve different nations, therefore, it was created a Broadcasting European Union committee that inspired to the Italian Sanremo competition for the creation of the ESC.
The jury composition, that expresses an opinion for the final ranking, was different in the years. There are two types of juries: a committee selects the songs that will participate to the Festival, a different jury votes for the final ranking.
Below we list the different juries typologies, which have followed during the years: experts jury, also called quality jury, composed by important people in the environment of art, music, entertainment and television; demoscopic jury, composed by a sample extracted by the usual music audiences; popular jury, composed by the live audience of the Festival and by different popular juries, spread in different Italian region, selected by age, sex and social class (in the years people were drawn from subscribers to the RAI Radio Televisione Italiana, subscribers to the principal Italian newspapers, telephone subscribers, components of social communities like barracks and hospices); televoting jury, composed by each Italian citizen who wants to vote using the telephone.
1.4 The data
We have data on the final ranking of the Sanremo Festival for 59 years, from 1959 to 2017, collected from the website of the RAI Radio Televisione Italiana www.rai.it, which organizes the event, and from the website www.hitparadeitalia.it, that faithfully collects data on the final ranking of the Festival. For all the years we have: name of the song, name of the artist, position in the final ranking. From 2002 to 2017 we have more detailed data on the percentage of votes attributed to each song in the ranking. The votes are expressed in percentage, not in absolute value, because the number of participants to the Festival, the number of judges and the jury composition are different for each year. Furthermore, for 8 years, from 2010 to 2017, we have the vote percentage of the different jury: demoscopic jury, expert jury, televoting, quality jury, orchestra jury, golden share pressroom jury. The final ranking for the last 8 years of the Festival is double, because in the final
21
evening of the event, in a first moment, all the songs in competition receive a vote, then in a second moment, only the first three ranked receive another vote that ultimately decides the winner of the Prize.
For the same period of 59 years, we collected data on the Hit parade from the website
www.hitparadeitalia.it. Hit parade is a weekly ranking of the most sold songs in Italy. It considers,
from different official sources, the songs with the highest sales in Italy. It contains, obviously, not only Italian songs but also international songs sold in Italy. For the last years, it considers the revenues that derive from new ways to listen to music: the streaming. From the website are available data for each week for the first 100 songs from 2009 to 2017, for the first 20 songs from 1985 to 2008, and for the first 10 songs from 1959 to 1984.
The best choice for data on economic success was to have precise data on the weekly sales, but unfortunately these are not available; consequently, the weekly Hit parade ranking is a good proxy for sales. For each week we have the song title, the singer, the ranking position, the position of the previous week and the date of the week.
1.5 Descriptive statistics
We have data on 59 years of the Sanremo Festival, from 1959 to 2017. For each year we have 3 finalists of which one is the winner of the Sanremo Prize (the prize is assigned to the first, but also the second and the third ranked songs in the Festival have visibility because they are on the podium). In our sample we have in total 1651 songs: the 203 that are the finalists for the Prize are considered as “treated” units in our analysis (in some years we have more than three finalists because competition rules change over the years, for this reason, the finalist songs are in total 203 and not 177 = 59 × 3), while the remaining 1448 constitute our control units.
We use a Regression Discontinuity Design to measure the impact that winning the Sanremo Festival has on a song’s economic success. We employ a sharp RDD, following the model of Ponzo and Scoppa (2015).
We create a variable that gives points to each song, with reference to their ranking position. The variable gives 100 points to the first ranked song in the Hit-parade ranking, and one point less to the other songs, as they are under in the ranking. We impute zero to songs not ranked in the Hit-parade. This variable is called “Points in Hit-parade”.
Another ranking variable is “Ranking in Sanremo”, a variable that gives increasing points to the songs, as they are under in the ranking.
22
The first variable we use as a proxy for song sales is the sum of the points that we created for the Hit-parade ranking: we sum the points of the song in the different weeks a song is present in the Hit-parade. We call this variable “Total Points in Hit-parade”.
The second variable we use as a proxy for song sales is the sum of the number of weeks that this song is present in the Hit-parade. We call this variable “Weeks in Hit-parade”.
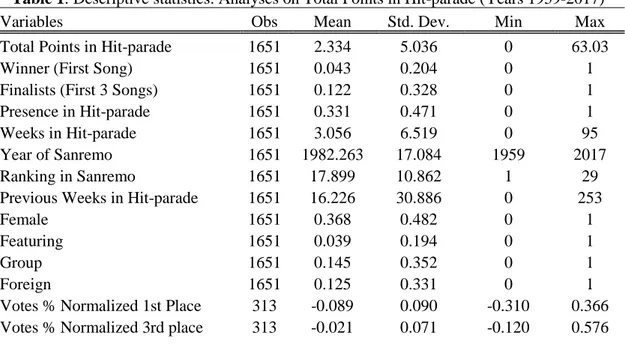
Table 1 shows the descriptive statistics of our variables. Our sample is limited to the songs that participate to the Sanremo Festival. We drop all the other songs.
Table 1: Descriptive statistics. Analyses on Total Points in Hit-parade (Years 1959-2017)
Variables Obs Mean Std. Dev. Min Max
Total Points in Hit-parade 1651 2.334 5.036 0 63.03
Winner (First Song) 1651 0.043 0.204 0 1
Finalists (First 3 Songs) 1651 0.122 0.328 0 1
Presence in Hit-parade 1651 0.331 0.471 0 1
Weeks in Hit-parade 1651 3.056 6.519 0 95
Year of Sanremo 1651 1982.263 17.084 1959 2017
Ranking in Sanremo 1651 17.899 10.862 1 29
Previous Weeks in Hit-parade 1651 16.226 30.886 0 253
Female 1651 0.368 0.482 0 1
Featuring 1651 0.039 0.194 0 1
Group 1651 0.145 0.352 0 1
Foreign 1651 0.125 0.331 0 1
Votes % Normalized 1st Place 313 -0.089 0.090 -0.310 0.366 Votes % Normalized 3rd place 313 -0.021 0.071 -0.120 0.576
The forcing variable of our RDD model is the variable “Ranking in Sanremo”. For this variable, the cut-off is the third place in the Sanremo ranking, and it refers to the songs that win the Prize. The treatment status “Finalists (first 3 songs)” is a deterministic and discontinuous function of the Sanremo ranking.
In order to estimate a treatment effect, the sharp RDD compares the outcome of units just above the threshold with the outcome of units just below the threshold. In terms of our research, we compare the sales of those songs that arrive in the final, that are the songs above the fourth position in the Sanremo ranking, with the songs that don’t receive the prize, that are the songs below the third position in the Sanremo ranking. The Sanremo ranking should express the intrinsic quality of the songs. We take into account this using a flexible polynomial function of Sanremo ranking. We assume that, in the absence of a treatment, the relationship between the outcome variable and the Sanremo ranking position is continuous in the neighbourhood of the cut-off point. For this reason, any jump of the dependent variable in proximity of the cut-off can be interpreted as evidence of a treatment effect.
23
We use a parametric approach, in line with most of the papers analysed in the literature.
1.6 First application: effects on total points in hit-parade (a proxy for sales)
The following equation (1) models the dependent variable “Total points in Hit-parade” of song i competing in year t:
(1)
𝑇𝑜𝑡𝑎𝑙 𝑝𝑜𝑖𝑛𝑡𝑠 𝑖𝑛 𝐻𝑖𝑡 𝑝𝑎𝑟𝑎𝑑𝑒𝑖𝑡 = 𝛽0+ 𝛽1𝐹𝑖𝑛𝑎𝑙𝑖𝑠𝑡𝑠3𝑖𝑡 + 𝛽2𝑅𝑎𝑛𝑘𝑖𝑛𝑔 𝑖𝑛 𝑆𝑎𝑛𝑟𝑒𝑚𝑜𝑖𝑡+ 𝜆𝑡+ 𝛾𝑡+ 𝜀𝑖𝑡
Total points in Hit-parade, the dependent variable, is a proxy for song sales.
Finalists is the dummy variable referred to the three songs that each year receive the Sanremo Prize. Ranking in Sanremo is the variable referred to the Sanremo ranking, we use the threshold at the 3rd
place of the Sanremo ranking to verify if there is a jump in the RDD plot. In addition to the variables explained above, there are other dummy variables: 𝜆𝑡 represents the time dummies, for each different year;
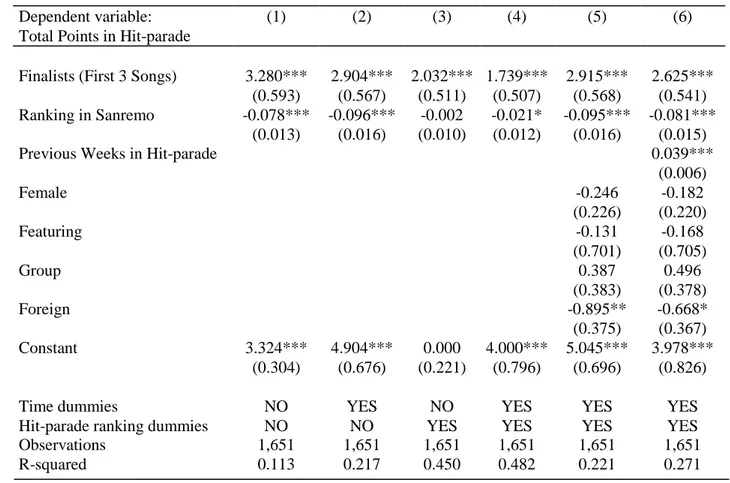
𝛾𝑡 represents the Hit-parade ranking dummies, for each different range of the Hit-parade ranking, that can differ in the years according to the number of positions expressed in the ranking. There could be 10, 20, 100 or 200 positions in the Hit-parade rankings, in different years. In Table 2 we show the outcomes of this analysis. We create a linear trend model and OLS estimates of the equation, using the Hit-parade ranking as the dependent variable and as a proxy for the sales, are the following:
• in column (1) we only control for the finalists, without the time dummies and without the Hit-Parade dummies. The coefficient on Finalists is large and highly statistically significant, with a t-stat of 5.53. As expected, the position in the Sanremo Ranking is negatively related to the proxy for sales: the best ranked songs in Sanremo have more points in Hit-parade, then higher sales on the music market. Arriving at the first three positions in Sanremo ranking increases by 3.28 the points used as a proxy for sales. The coefficient on Ranking in Sanremo is negative and highly statistically significant, with a t-stat of -6.15. This is in line with our expectations: the first ranked songs of Sanremo Festival have the lowest points in the Ranking (1 for the first, 2 for the second, and so on);
• in column (2), we control for time dummies (one for each year). We find that the effect of the Sanremo Prize is smaller in column (2) respect to that in column (1), however the results are statistically significant;
• in column (3), we control for Hit-parade ranking dummies, because in different years we collected data with different range of the Hit-parade ranking (there could be 10, 20, 100 or
24
200 positions in the Hit-parade rankings). We find that the effect of the Sanremo Prize is smaller in column (3) respect to that in column (2), and the statistical significance is maintained only for the variable Finalists, not for the Ranking in Sanremo;
• in column (4) we control for both time dummies and Hit-parade ranking dummies. We have a higher adjusted R-squared, this implies that column (4) is a more complete specification of our estimates;
• in column (5) we add some control variables referred to the singer: Female (the gender, equal to 1 if the artist is female, equal to 0 otherwise), Featuring (equal to 1 if the artist sings his song in couple with another singer, equal to 0 otherwise), Group (equal to 1 if there is more than one artist that form a musical group, equal to 0 otherwise), Foreign (equal to 1 if the artist comes from a foreign country different from Italy, equal to 0 otherwise). Within these control variables, the only significant one is Foreign: it has a statistical significance, with a t-value of -2.39 and it has a negative impact on the dependent variable;
• column (6) expresses the most complete interpretation, because we control for time dummies, Hit-parade ranking dummies, for the four control variables expressed in column (5) and for another control variable: Previous Weeks in Hit-parade, that expresses the presence in Hit-parade of the same singer, in the weeks and years previous to that specific Sanremo Festival. With this variable, we can control for the popularity of the artist, it represents an index of fame: the more week the singer is present in Hit-parade, the more it is famous. The variable Finalists is statistically significant with a t-stat of 4.85 and a coefficient of 2.625. The variable Ranking in Sanremo maintains its relevance, with a t-stat of -5.36, and it is negatively related to the dependent variable, with a coefficient of -0.081. The control variable Foreign maintains its negative and low statistical significance.
25
Table 2: Regressions for the impact of the Sanremo Prize on Total Points in Hit-parade.
Dependent variable: (1) (2) (3) (4) (5) (6)
Total Points in Hit-parade
Finalists (First 3 Songs) 3.280*** 2.904*** 2.032*** 1.739*** 2.915*** 2.625*** (0.593) (0.567) (0.511) (0.507) (0.568) (0.541) Ranking in Sanremo -0.078*** -0.096*** -0.002 -0.021* -0.095*** -0.081***
(0.013) (0.016) (0.010) (0.012) (0.016) (0.015)
Previous Weeks in Hit-parade 0.039***
(0.006) Female -0.246 -0.182 (0.226) (0.220) Featuring -0.131 -0.168 (0.701) (0.705) Group 0.387 0.496 (0.383) (0.378) Foreign -0.895** -0.668* (0.375) (0.367) Constant 3.324*** 4.904*** 0.000 4.000*** 5.045*** 3.978*** (0.304) (0.676) (0.221) (0.796) (0.696) (0.826)
Time dummies NO YES NO YES YES YES
Hit-parade ranking dummies NO NO YES YES YES YES
Observations 1,651 1,651 1,651 1,651 1,651 1,651
R-squared 0.113 0.217 0.450 0.482 0.221 0.271
Robust standard errors in parentheses *** p<0.01, ** p<0.05, * p<0.1
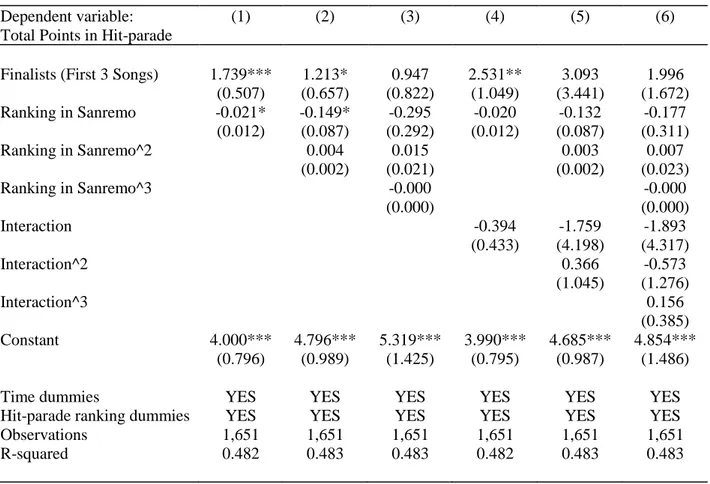
In Table 3 we show an in-depth analysis of our first model. We try to control one of the most important threats to the internal validity of RDD (we want to capture the possible discontinuity) with the adding of the second and the third degree of Sanremo Ranking, and with different degrees of the interaction term. We assume different polynomial form in our regression to test if the functional form between the outcome and the forcing variable is different. We use polynomials of second or third degree to capture possible existing non-linearities. Our aim is to avoid confusing these non-linearities for discontinuities. We also use interaction terms between Ranking and Finalists to model different functional forms on the two sides of the cutoff:
• in column (1) we control for time dummies and for Hit-Parade dummies. The coefficient on Finalists is large and highly statistically significant, with a t-stat of 3.43. The coefficient on Ranking in Sanremo is negative and statistically significant, with a t-stat of -1.75; as expected, the position in the Sanremo Ranking is negatively related to the Total points in Hit-parade and to the music market sales. Arriving to the first three positions in Sanremo ranking increases by 1.74 the points used as a proxy for sales;
26
• in column (2) we add the variable Ranking in Sanremo^2 with the aim of testing the significance at the second degree of our forcing variable. The statistical significance is respected, although not highly, for the second degree, with a t-stat of 1.85;
• in column (3) we add also the third degree of the variable Ranking in Sanremo. With the addition of the third degree in Ranking, we lose the statistical significance of the Finalists variable, even if the positive value of the coefficient is confirmed, but the t-value is 1.15; • in column (4) we add the interaction term: a variable that tests the interaction between the
ranking in Sanremo and the Finalists songs (first 3 positions) to control for different functional forms on the two sides of the cutoff. Like in column (1), it is respected the coefficient direction and the statistical significance of Finalists and Ranking in Sanremo; • in column (5) and (6) and we add the interaction term respectively squared and cubed. Here
the coefficient of the Finalist variable turns out to be not significant, whit a t-stat of respectively 0.90 and 1.19, anyway the coefficient is positive.
In these models, we notice high instability regard to the estimate of the coefficient of Finalists. The instability is accentuated in columns (3), (5) and (6) of Table 3, probably due to the fact that, inserting in the model different degrees of ranking and interaction terms, it is more difficult to respect the statistical significance if the effect is not strong. The situation will be the same in Table 6. In both cases, we consider columns (1), (2), (4) and (5) as the most affordable models, because we lose significance with the adding of third degree functional forms that corresponds to columns (3) and (6) of both the tables.
27
Table 3: Regressions for the impact of the Sanremo Prize on Total Points in Hit-parade: first, second and
third degree of Sanremo ranking. With the addition of the interaction term.
Dependent variable: (1) (2) (3) (4) (5) (6)
Total Points in Hit-parade
Finalists (First 3 Songs) 1.739*** 1.213* 0.947 2.531** 3.093 1.996 (0.507) (0.657) (0.822) (1.049) (3.441) (1.672) Ranking in Sanremo -0.021* -0.149* -0.295 -0.020 -0.132 -0.177 (0.012) (0.087) (0.292) (0.012) (0.087) (0.311) Ranking in Sanremo^2 0.004 0.015 0.003 0.007 (0.002) (0.021) (0.002) (0.023) Ranking in Sanremo^3 -0.000 -0.000 (0.000) (0.000) Interaction -0.394 -1.759 -1.893 (0.433) (4.198) (4.317) Interaction^2 0.366 -0.573 (1.045) (1.276) Interaction^3 0.156 (0.385) Constant 4.000*** 4.796*** 5.319*** 3.990*** 4.685*** 4.854*** (0.796) (0.989) (1.425) (0.795) (0.987) (1.486)
Time dummies YES YES YES YES YES YES
Hit-parade ranking dummies YES YES YES YES YES YES
Observations R-squared 1,651 0.482 1,651 0.483 1,651 0.483 1,651 0.482 1,651 0.483 1,651 0.483 Robust standard errors in parentheses
*** p<0.01, ** p<0.05, * p<0.1
The following plots offer a better explanation of our results. The aim of an RDD model is to find a jump on the threshold variable. We show now the graphs that confirm the validity of our research. Figure 1 expresses a transparent graphical analysis for our RDD model, showing the impact of the Sanremo Prize on the Total points in Hit-parade. It is a second-degree function, referred to the column (2) of Table 3. We clearly recognize a jump on the variable Ranking of Sanremo, corresponding to the threshold of the 3rd place. The predicted values refer to a regression of Total
Points in Hit-parade on a second order polynomial in Ranking of Sanremo. The clear jump showed in the figure represents the effect of the Sanremo Prize on the song sales.
The first three best ranked songs of Sanremo have a better placement in the Hit-parade, compared with the other ranked songs in the Sanremo ranking. This means that the first three songs that are in the Sanremo final each year have greater sales.
Figure 2 is the graphical representation of column (3) Table 3. It expresses the third-degree function of the model. Here the jump is less clear, related to the fact that the variable Finalists loses its statistical significance.
28
Figure 3 and Figure 4 express respectively the second and the third degree of the RDD model, with the addition of the interaction term. They are a graphical representation of column (5) and (6) Table 3. The jump is clear, despite the statistical significance of Finalists is not established.
30
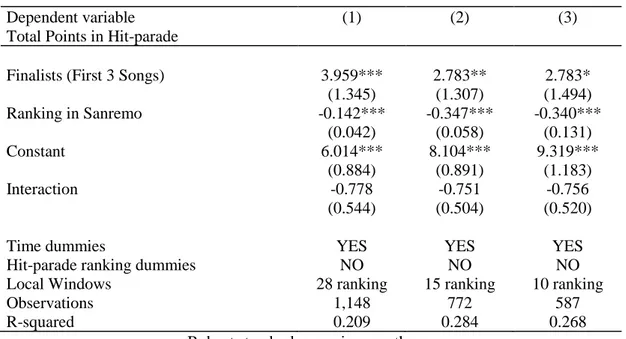
In Table 4 are expressed the local windows output of the regressions for the impact of the Sanremo Prize on Total Points in Hit-parade, with the addition of the interaction term. Local windows are used for control if, reducing the sample around the threshold, the effects remain the same or if it changes. If the jump is verified also in the local windows, our results gain a major robustness. In these regressions, local windows refer respectively to the first 28, 15 and 10 songs in the Ranking of Sanremo.
The statistical significance of Finalists is respected until column (3), that corresponds to the first 10 ranked songs, with a descending t-stat and a positive sign. The variable Ranking in Sanremo maintains his negative sign and it is also significant until column (3).
31
Table 4: Regressions for the impact of the Sanremo Prize on Total Points in Hit-parade. With the addition of
the interaction term. Local window for the first 28, 15, 10 and 6 songs in the ranking.
Dependent variable (1) (2) (3)
Total Points in Hit-parade
Finalists (First 3 Songs) 3.959*** 2.783** 2.783*
(1.345) (1.307) (1.494) Ranking in Sanremo -0.142*** -0.347*** -0.340*** (0.042) (0.058) (0.131) Constant 6.014*** 8.104*** 9.319*** (0.884) (0.891) (1.183) Interaction -0.778 -0.751 -0.756 (0.544) (0.504) (0.520)
Time dummies YES YES YES
Hit-parade ranking dummies NO NO NO
Local Windows 28 ranking 15 ranking 10 ranking
Observations 1,148 772 587
R-squared 0.209 0.284 0.268
Robust standard errors in parentheses *** p<0.01, ** p<0.05, * p<0.1
Here are the graphical RDD explanation of the four different local windows showed in Table 3.2. In Figures 5, 6, 7 and 8 the threshold remains stable at the 3rd place of the Sanremo Ranking, it
changes only the size of the Ranking because we cut the final tail. What is common in all the figures is that the slope of the line is different on the right and on the left of the cut-off: this confirms the significant effect of interaction term Finalists*Ranking in Sanremo. Local windows are a robustness check for the consistency on our hypothesis. We can affirm that the hypothesis that the First three ranked songs have more points in the Hit-parade ranking, then they sell more on the music market, is also confirmed by the restriction of our sample, until the first 10 ranked songs in the Sanremo Ranking.