Analysis of Fox genes in Schmidtea
mediterranea reveals new families
and a conserved role of Smed‑foxO
in controlling cell death
Eudald Pascual‑Carreras
1,2,3*, Carlos Herrera‑Úbeda
1,2,3, Maria Rosselló
1,2,
Pablo Coronel‑Córdoba
1,2, Jordi Garcia‑Fern ndez
1,2, Emili Saló
1,2& Teresa Adell
1,2* The forkhead box (Fox) genes encode transcription factors that control several key aspects of development. Present in the ancestor of all eukaryotes, Fox genes underwent several duplications followed by loss and diversification events that gave rise to the current 25 families. However, few Fox members have been identified from the Lophotrochozoa clade, and specifically from planarians, which are a unique model for understanding development, due to the striking plasticity of the adult. The aim of this study was to identify and perform evolutionary and functional studies of the Fox genes of lophotrochozoan species and, specifically, of the planarian Schmidtea mediterranea. Generating a pipeline for identifying Forkhead domains and using phylogenetics allowed us the phylogenetic reconstruction of Fox genes. We corrected the annotation for misannotated genes and uncovered a new family, the QD, present in all metazoans. According to the new phylogeny, the 27 Fox genes found in Schmidtea mediterranea were classified into 12 families. In Platyhelminthes, family losses were accompanied by extensive gene diversification and the appearance of specific families, the A(P) and N(P). Among the newly identified planarian Fox genes, we found a single copy of foxO, which shows an evolutionary conserved role in controlling cell death.Abbreviations
Amq Amphimedon queenslandica
Bla Branchiostoma lanceolatum Bose Bothrioplana semperi Cate Catenulia
Cgi Crassostrea gigas Cte Capitella teleta Djap Dugesia japonica Dlac Dendrocoelum lacteum Dme Drosophila melanogaster Emul Echinoccocus multiocularis
FHA Forkhead associated domain FKH Forkhead domain
Fox Forkhead Box
Geap Geocentrophora applanta Gsa Gyrodactylus salaris Hro Helobdella robusta
Hsa Homo sapiens
Ili Intoshia linei Lept Leptoplana tremellaris Lgi Lottia gigantea Lna Lingula anatine
OPEN
1Department of Genetics, Microbiology and Statistics and Institute of Biomedicine, Universitat de Barcelona, Barcelona, Catalunya, Spain. 2Institut de Biomedicina de la Universitat de Barcelona (IBUB), Universitat de Barcelona, Barcelona, Catalunya, Spain. 3These authors contributed equally: Eudald Pascual-Carreras and Carlos Herrera-Úbeda. *email: [email protected]; [email protected]
www.nature.com/scientificreports/
Meli Mesostoma lingua
Mli Macrostomum lignano
Mli Macrostumum lignano
Mosp Monocelis sp.
NES Nuclear exportation signal NLS Nuclear localization signal
Nve Nematostella vectensis Obi Octopus bimaculoides Pfl Ptychodera flava Pnig Polycelis nigra Pten Polycelis tenuis Ptor Planaria torva Sdo Suberites domuncula Sko Saccoglossus kowalevskii Sman Schistosoma mansoni
Smed Schmidtea mediterranea Asexual strain Smes Schmidtea mediterranea Sexual strain Spol Schmidtea polychroa
Spu Strongylocentrotus purpuratus
Tca Tribolium castaneum
TF Transcription Factor
Tsol Taenia solium
WGD Whole Genome Duplication
Xtr Xenopus tropicalis
Forkhead box (Fox) genes belong to the ‘winged helix’ superfamily of transcription factors (TF) with a specific DNA-binding domain referred to as the Forkhead domain (FKH), with approximately 100 Aa. In Metazoa, Fox genes are expressed in a specific spaciotemporal manner during development, and control essential processes as cell death, cell cycle and stem cell differentiation into specific cell lineages and populations1–3. Thus, Fox genes
play a major role during embryonic and postembryonic development, including: gastrulation, lifespan, immune system regulation or tissue differentiation and maintenance1. In humans, the lack of some Fox genes leads to
embryonic lethality or developmental diseases such as Parkinson’s, defects in the immune system, speech and language learning or cancer1,2,4,5.
Currently, over 2000 Fox proteins have been identified in 108 species of fungi and metazoans, including a vast number of Phyla, such as Choanoflagellata6, Ctenophora7, Placozoa8, Porifera9, Cnidaria10, Echinodermata11,
Hemichordata12, Cephalochordata13,14 and Chordata14,15. However, few Fox genes have been identified in
lopho-trochozoan species, and most functional studies have been only performed in few model organisms such as mice16–18, Drosophila melanogaster19,20 or C. elegans21. Planarians are Lophotrochozoans well known for their
astounding ability to regenerate any body part and change their size according to food availability. Such tissue plasticity is due to the presence of adult stem cells (neoblasts) that can give rise to all differentiated cell types, which is accompanied by the continuous activation of the intercellular signalling mechanisms22–24. Planarians’
phylogenetic position and plasticity makes them an interesting model for investigating the Fox family at an evolutionary and functional level.
Fox genes are currently phylogenetically classified and grouped into 25 families (A to S)2,25. The different
gains and losses of Fox families have shaped the history of Fox family evolution, such as the division of family Q into Q1 and Q2, N into N1/4 and N2/3, L into L1 and L2 or J into J1 and J2/314. Another example of gain is the
S family, which seems to evolve by duplication of the C family and is specifically found in vertebrates11,26. Fox
family losses have also been reported, such as the AB in vertebrates15 or E, H, I, J2/3, M and Q1 in Ecdysozoa14.
The aim of this study was to identify and classify the Fox genes of the planarian species Schmidtea
mediter-ranea (Smed), along with the Fox genes of other lophotrochozoan species whose genome or transcriptome is
currently available27–32. Previous studies of Fox genes expression and function in Smed showed that they were
tissue specific and participated in its maintenance. The essential role of foxA in the maintenance of the pharynx and endodermal tissue has already been identified in planarians33, similar to its role in early endoderm
devel-opment in vertebrates34–36, or the role of J1 paralogs in ciliogenesis37, similar to the one described in vertebrate
species as mice, chickens or frogs38,39. However, other important Fox families such as the O family, related with
metabolism, growth and aging40,41 had not been identified in planarias.
Through generating a pipeline for identifying Forkhead domains we identified and annotated 27 Fox genes in
Smed, 18 of which are firstly reported here. Phylogenetic analyses allowed us to classify Smed Fox in 12 families.
The integration of the newly identified Fox from Smed and other lophotrochozoans and Platyhelminthes with all reported Fox genes allowed for the identification of the QD family, a new family which appears to originate after the split of sponges from the rest of the eumetazoans. Most of the Fox families also originated during this period, which was followed by various loss events and some diversification. Specifically, Platyhelminthes suffered a huge gene family loss followed by gene diversification originating specific families: A(P) and N(P). Finally, we identi-fied a single copy of the foxO gene in planarians and demonstrated its conserved role in controlling cell death.
Results
Schmidtea mediterranea presents 27 Fox genes that can be classified in 12 families.
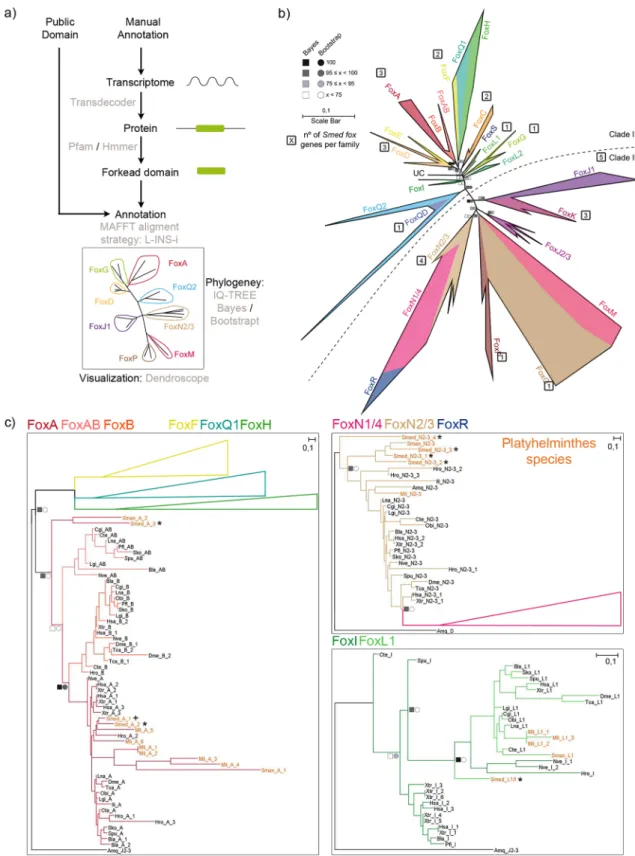
With the aim to identify all Fox genes of Smed, we developed a pipeline for identifying Forkhead domains (FKH) using the available FKH from Pfam in combination with TransDecoder and HMMER (Fig. 1a, see “Methods”). As a result, we found 27 distinct genes that contained this domain in the planarian genome27. To determine which familyeach of these genes belonged to, we performed a phylogenetic analysis using the FKH domain of the Fox genes of an additional 20 species across metazoans, including several lophotrochozoans, to better resolve the Smed Fox groups (Fig. 1a and “Methods”). The analysis resulted in the classification of the 27 FKH-containing Smed genes into 12 Fox families (Figs1b,c, S1, S2, S3). The complete information and new annotation regarding each FKH-containing gene identified is provided in the supplementary materials (S1 File), along with the raw tree (S2 File). The phylogenetic tree (Fig. 1b) shows that 5 out of these 12 families belong to Clade II, which is argued to be the ancestor clade42,43; and 7 belong to Clade I. To better visualise the different Fox genes in each cluster, we
inferred a series of new phylogenetic trees including only the genes from closely related families (Figs. 1c, S2, S3). Using this visualisation, we found some Smed Fox genes that were not properly classified: a Smed Fox gene that clusters between the L1 and the I families (Smed-foxL1/I) (Fig. 1c), a Smed Fox gene clustering as a sister group of the A, AB and B families (Smed-foxA3) (Figs. 1c, S2), and a Smed Fox clustering as a sister group of the N2/3 family (Smed-foxN2/3–4) (Fig. 1c, S3). Furthermore, we can observe how the Q2 family, widely described in many species12,44–46 has a branch populated with several genes that cluster with a divergent Q2 gene known as foxQD in
Saccoglossus kowalevskii (Sko)12. We consider this branch to be a new family (Fig. S2) which we called QD, due
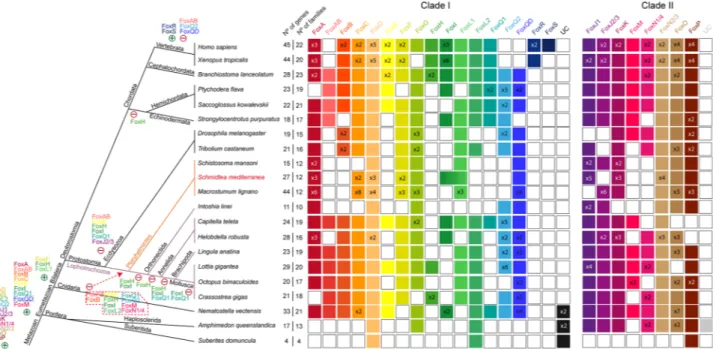
to the FKH-containing gene originally described in Sko. A Smed Fox gene belongs to this family (Smed-foxQD). Focusing on the presence of Fox genes in each family, we can observe that despite the number of Fox genes in Smed has remained similar to the rest of lophotrochozoans (see purple lines in Fig. 2), the number of fami-lies with representatives of Smed and the other two Platyhelminthes (Schistosoma mansoni and Macrostumum
lignano) has decreased. Particularly, Platyhelminthes seem to have lost the AB, B, E, H, I, Q1, Q2, M and N1/4
families (red dashed square in Fig. 2). This suggests a huge family loss at the base of Platyhelminthes phylum (orange lines in Fig. 2) coupled with an expansion of the Fox number in specific families.
Platyhelminthes present specific Fox subfamilies: FoxA(P) and FoxN(P).
To further investigate the phylogeny of the unclassified Smed Fox genes (Smed-foxL1/I, Smed-foxA3 and Smed-foxN2/3–4) we per-formed a second phylogenetic analysis focused on Platyhelminthes data. Repeating the same pipeline previously described, we identified the FKH-containing genes from a total of 19 Platyhelminthes species (including Smed), 8 of which belong to the Tricladida order, to which Smed belongs (Fig. 3a). Platyhelminthes Fox data can be found in the S3 File and the raw tree can be found in the S4 File. As previously, we also performed additional phylogenetic trees of close-related families to better visualize each family (Figs. S1, S3b, S4, S5). This analysis allowed us to properly classify the FoxL1/I gene into the L1 family (Fig. 3b), which seems to be slightly diver-gent in the Tricladida Order, and thus we renamed it as Smed-foxL1. Furthermore, the new analysis allowed the identification of two new subfamilies only present in Platyhelminthes to which the foxA3 and theSmed-foxN2/3–4 genes belonged. Thus, we renamed them as Smed-foxA(P) (Fig. 3b) and Smed-foxN(P), respectively (P meaning specific of Platyhelminthes) (Fig. S5). In this analysis the N subfamily was found to be specific to Triclads, while the A(P) subfamily was also found in other Platyhelminth orders.
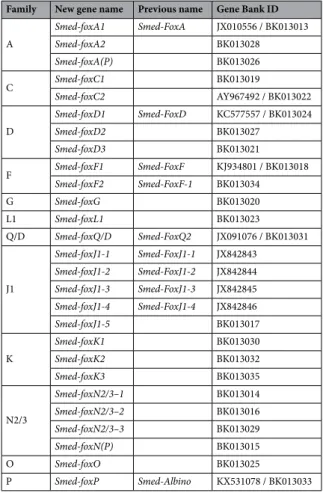
Based on these analyses we have identified and classified all FKH containing genes of Smed, including the ones already published, which in some cases have been reclassified according to our analysis. Thus, the previous
Smed-foxQ249 is now classified as Smed-foxQD, and the previous Smed-Albino50 gene is now renamed as
Smed-foxP. The new classification of all Smed Fox genes can be found in Table 1 (also in S1 Table). We did not to relate the subclassification of family genes between species, since it could cause a misleading annotation (i.e. foxD2 genes of Smed and Hsap are not directly homologs). The analysis of their protein domains shows that in addition to the FKH domain, the K family genes also contained the Forkhead associated domain (FHA) and the P family also showed a related coiled coil. Most of the proteins were enriched in nuclear localization signal (NLS) and/or nuclear export signal (NES), in accordance with their function as TFs (Fig. S6).
Thanks to this new analysis, we could also confirm the loss of several Fox families in planarians (the AB, B, E, H, I, Q1, Q2, M and N1/4 families) and we could determine that most of this family losses found in planarians predate the emergence of the Platyhelminthes phylum. Besides the family losses earlier mentioned (Fig. 2), Tri-cladida additionally lost the J2/3 family. Interestingly, TriTri-cladida (see turquoise lines in Fig. 4) have doubled the FKH-containing genes compared to the other Platyhelminthes, while the number of families remained constant, supporting an intrafamily diversification of Fox genes in this group (Fig. 4).
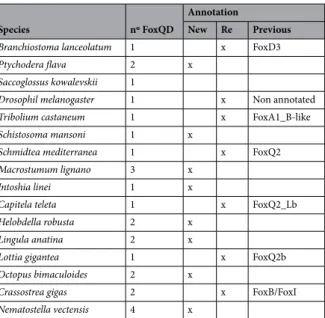
To note, the new QD family found in this study was found to be present in all Platyhelminthes, while the Q2 family is lost in all of them. To better decipher the relation between the new QD family and Q2 family, we performed a new phylogenetic analysis (Fig. 5). Increasing the number of species used outputted more confident Bayes and Bootstrap node values, supporting that a new Fox family has been uncovered, which is present in most Metazoa, including Platyhelminthes. Some genes misannotated in other families, such as Q2, B and I were reannotated as QD (Table 2, S1 File).
Schmidtea mediterranea Fox genes appear not to be linked in the genome and to have drifted
through evolution.
Regarding the relative position of Fox genes in the genomes of Metazoa, we can see how some of them typically present a linkage such as in the case of the families D-E or C-F-L1-Q1, which in other species is shown to cover different interval regions, from 20 to 300 kb26,52, 53. When comparing theirgenomic position relative to other coding genes, Irimia et al.54 demonstrated that some of the Fox genes had
www.nature.com/scientificreports/
Figure 1. Fox family evolution in Metazoa reveals 27 Fox genes in Schmidtea mediterranea divided in 12 families. (a) pipeline annotate Fox genes. (b) The ML phylogenetic trees based on FKH. Number of genes per family in Schmidtea mediterranea is indicated inside a square next to each family. At nodes, values for the approximate Bayes (square) and Likelihood (circle) ratio test are shown. Colour indicates % of confidence. Family tree branches were collapsed at the base of the common node. One gene was unclassified in any family (UC). Dashed line divides Clade I and Clade II Fox genes. (c) For each node-sharing families, a phylogenetic tree was created using an Amq gene from the opposite clade as out group. Family branches are painted with the same colour as they are represented in the trees. Platyhelminthes genes are coloured light orange. Dark crosses indicate previous characterized genes and dark asterisks indicate new fox characterized in Schmidtea
mediterranea (Smed). Aminoacidic sequences used are found in S1 File. Scale indicates expected aminoacidic
at chromosome level, we examined the genomic neighbourhood of Smed Fox genes. The only genes present in the same scaffold were foxD2 and foxA1 with ~ 187 kb of distance between them (S1 Table). Although the dis-tance is less than the 0.1% of genome size52 there are no other reports of A-D family linkage, meaning that no
canonical Fox genes linkages are found in this assembly version of Smed genome. In order to verify if, despite this, there was some level of microsynteny conservation, we took an orthology-based approach similar to the one used to identify orthologous lincRNAs between distant species55 using humans as a comparison, as well as
manually checking the existence of already described microsyntenic pairs. In both cases, we found no conserved microsynteny (S5 File). Additionally, we decided to perform whole-genome alignments between the different scaffolds to examine the inter-paralog syntenic relationships (Figs. 6, S7). However, the synteny seems to be bro-ken in all cases with most of the alignments falling exclusively into repeating elements such as LINEs.
Our data suggest that the Fox families found to be linked in other species (C-F-L1-Q1 and D-E)26,52 are not
linked in Smed, and Smed Fox genes show no microsynteny with described genes. However, this analysis should be repeated when the genome of Smed is completely assembled.
Smed‑foxO controls cell death in planarians.
The expression pattern and function of most Smed Fox genes remain unstudied. We performed an exhaustive analysis of their expression pattern by in situ hybridiza-tion and by an in-silico search in the SCSeq databases56,57, as well as a functional screening through RNAi. Theresults show a tissue-specific pattern of expression for most of the genes which could give clues about their func-tion (Figs. S8–S10, S1 Table). RNAi inhibifunc-tion produced regenerative defects that were mild in some of them (Fig. S11) but obvious in others, which could not regenerate proper eyes nor CNS (Fig. S12). For instance, foxD3 was expressed in GABAergic neurons according to the SCSeq databases (Fig. S8) and when inhibited produced strong regenerative defects in the brain (Fig. S12, S1 Table). Both Platyhelminthes/planarian specific foxA(P) and
foxN(P) showed strong phenotype after inhibition (Fig. S12). foxA(P) was expressed in ‘activated early epidermal
progenitors’ according to the SCSeq databases (Fig. S8) and when inhibited animals could hardly regenerate nor anterior or posterior wounds, giving rise to small animals (Fig. S12). foxN(P) was expressed in brain branches and epidermal cells (Fig. S9), and when silenced animals did not regenerate eyes and presented a smaller brain, suggesting that RNAi animals presented neural regenerative defects (Fig. S12).
We found particularly interesting the discovery of a unique copy of foxO, which is the homolog of daf-16 in C. elegans, known for its role in increasing longevity58. Nowadays foxO is known to be crucial in controlling
metabolism and oxidative stress and also participates in the regulation of genes related to tissue repair and homeostasis41. Thus, we wondered whether Smed-foxO could have a role in controlling tissue regeneration and
homeostasis as well in planarians. First, we found that Smed FOXO conserves the three specific sites (Fig. S13a), that under nutrient rich conditions are phosphorylated by AKT and lead to its ubiquitin degradation59, 60. To
Figure 2. Distribution of Fox homologs in Metazoan clade indicating gene and family losses and some gene duplications in Schmidtea mediterranea. Coloured boxes indicate the presence of an ortholog based on the phylogenetic analysis. When there were no evidences of ortholog, the box remained white. A number (x Nº) inside a box indicates paralogs per family and species. Families are divided in Clade I and II. Number of genes and number of families per species are indicated. Metazoan47 and Lophotrochozoa48 phylogenies were
used. Light purple lines indicate lophotrochozoan species and within light orange indicate Platyhelminthes superphylum species. Gains (+) and losses (−) of genes are placed next to each clade. Main Clade I Fox acquisition was at the base of Eumetazoa and different events of gains and losses happened through evolution. Specifically, many families were lost in Platyhelminthes (red dashed polygon).
www.nature.com/scientificreports/
Figure 3. Fox family evolution in Platyhelminthes indicates family diversification. (a) The ML phylogenetic trees based on FKH of Fox family evolution in Lophotrochozoan clade. Number of genes per family in
Schmidtea mediterranea is indicated inside a square next to each family. At nodes, values for the approximate
Bayes (square) and Likelihood (circle) ratio test are shown. Colour indicates % of confidence. Family tree branches were collapsed at the base of the common node. Dashed line divides Clade I and Clade II Fox genes. (b) For each node-sharing families, a phylogenetic tree was created using an Amq gene from the opposite clade as out group. Family branches are painted with the same colour as they are represented in the trees. Dark cross indicates previous characterized gene and dark asterisk indicates new fox characterized in Schmidtea
mediterranea (Smed). Aminoacidic sequences used are placed in S3 File. Scale indicates expected aminoacidic
check whether in planarians this mechanism is conserved, we quantified foxO levels in fed animals. qPCR quan-tification demonstrated that foxO was down-regulated in fed conditions (Fig. S13b). Altogether, suggested that the AKT-dependent mechanism of foxO regulation could be conserved in planarians. Then, we found Smed-foxO expressed ubiquitously and according to the SCSeq databases it was present in several cell types, such as neoblasts, neurons, parenchymal, secretory and epidermal cells (Fig. S9–S10, S1 Table). Trough RNAi inhibition, we found that in regenerating animals foxO RNAi inhibits the differentiation of the eyes and the proper regeneration of the brain (Fig. S13c).To gain insight into its function in tissue renewal, we inhibited it by RNAi in intact starving animals. qPCR demonstrates Smed-foxO mRNA downregulation in Smed-foxO (RNAi) animals (Fig. S13d). After two weeks of inhibition half of knockdown animals presented unpigmented zones, areas in which the brown pigment of epidermal or eye cells is lost (Fig. 7a). Analysis of the CNS (anti-synapsin) and the pharynx (DAPI) demonstrates that those structures are smaller and not properly maintained in Smed-foxO RNAi animals (Fig. 7b). The problems in tissue turnover could arise by unpaired cell proliferation and/or cell death. To test these pos-sibilities, we analysed M phase cells through PH3 staining, and apoptosis by TUNEL and caspase-3 assay. Cell proliferation was unaffected after two weeks of inhibition (Fig. S13e). However, both TUNEL and caspase-3 assays demonstrate that the apoptotic response that normally takes place in starved planarians, which are shrinking, was inhibited in Smed-foxO RNAi animals (Fig. 7c,d). To confirm the pro-apoptotic role of FoxO in planarians we quantified the levels of the pro-apoptotic gene bak, which is a reported target of foxO61. qPCR quantification
shows their downregulation in foxO (RNAi) animals (Fig. S13f). A decrease in cell death that is not balanced by an increase in cell proliferation must end up with an increase in the number of cells. We found that foxO (RNAi) planarians reduced their size equivalently to control animals (Fig. S13g). However, the quantification of cells in the epidermis demonstrates an increase in cell density in the RNAis (Fig. S13h). Furthermore, we observe that epidermal cells are disorganized.
Overall, these results demonstrate that Smed-foxO is necessary for planarian cell turnover through the control of cell death but not cell proliferation.
Discussion
The Fox genes in Metazoa: a story of early gains and specific losses.
The Fox genes evolution has been a field of interest since their discovery. Although quite rich in different families, it seems that the ancestral Fox gene was remarkably similar to the J1 family. This family has been proposed as the original Fox family, giving rise to the rest of families by gene expansion and duplication42. Few Fox genes have been identified inTable 1. Fox genes in Schmidtea mediterranea. New and previous names of Fox genes in Smed are shown, with their corresponding GeneBank Ids.
Family New gene name Previous name Gene Bank ID
A Smed-foxA1 Smed-FoxA JX010556 / BK013013 Smed-foxA2 BK013028 Smed-foxA(P) BK013026 C Smed-foxC1 BK013019 Smed-foxC2 AY967492 / BK013022 D Smed-foxD1 Smed-FoxD KC577557 / BK013024 Smed-foxD2 BK013027 Smed-foxD3 BK013021 F Smed-foxF1 Smed-FoxF KJ934801 / BK013018 Smed-foxF2 Smed-FoxF-1 BK013034 G Smed-foxG BK013020 L1 Smed-foxL1 BK013023 Q/D Smed-foxQ/D Smed-FoxQ2 JX091076 / BK013031 J1 Smed-foxJ1-1 Smed-FoxJ1-1 JX842843 Smed-foxJ1-2 Smed-FoxJ1-2 JX842844 Smed-foxJ1-3 Smed-FoxJ1-3 JX842845 Smed-foxJ1-4 Smed-FoxJ1-4 JX842846 Smed-foxJ1-5 BK013017 K Smed-foxK1 BK013030 Smed-foxK2 BK013032 Smed-foxK3 BK013035 N2/3 Smed-foxN2/3–1 BK013014 Smed-foxN2/3–2 BK013016 Smed-foxN2/3–3 BK013029 Smed-foxN(P) BK013015 O Smed-foxO BK013025 P Smed-foxP Smed-Albino KX531078 / BK013033
www.nature.com/scientificreports/
choanoflagellates and in sponges6,52 and, as seen in Fig. 2, an expansion of the families took place before the
origin of cnidarians, when most of the Clade II families and some Clade I families appeared. At the base of bila-terians, new families appeared: F, H and L1 (exclusive of bilaterians); R and S (vertebrate and mammal specific, respectively). This would mean that some of the Fox families are easily lost through evolution, as seems to be the case for H, I, and Q1 families. In agreement with other analysis43,62, those families would have appeared early
on the metazoans, and then were lost in a species-specific manner several times through evolution (Fig. 2). In addition, our findings support that some clades suffered massive losses, such as Ecdysozoa which has lost seven families, as it has been proposed by Mazes et al.14, although the losses in this clade could be less if more
organ-isms where used in the analyses. Nonetheless, the clade with the greatest number of specific losses seems to be Platyhelminthes with ten families lost (Fig. 4). This is in line with other studies that have analysed the evolution of different gene families in Platyhelminthes, such as the Wnt family, which demonstrated a great number of family losses in this clade63–65.
Uncovering the QD family.
In this study we identified a new Fox gene family not previously described, the QD, to which some genes misannotated in other families belong to, such as Q2, B and I (Table 2, S1 File). This family originated from a paralog duplication that gave rise to both the already known Q2 family and the new QD family. According to our data, the origin of the QD family could be prior to the eumetazoan radiation although to confirm this, analysis on placozoans and ctenophores would need to be carried out. The QD family is present in almost all taxa studied and is completely lost only in vertebrates (Fig. 2).Not only the phylogenetic data but also their different expression patterns support that QD and Q2 are dif-ferent families. While Fox Q2 genes show an evolutionary conserved role in anterior brain development44,66,
Sko foxQD shows a completely different spatiotemporal expression12. Smed foxQD, which was annotated as
foxQ2, is not expressed in nor has a role in anterior patterning49,67,68. We hope that, much like in the case of the
uncovering of the AB family by Yu et al.13, this new family can help to elucidate some of the inconsistencies in
annotation such as in the case of Smed and will also contribute to a better understanding of the function of the different Fox families.
Planarian‑specific Fox: FoxA(P) & FoxN(P).
When analysing the Platyhelminthes tree, we were able to properly classify the outgrouping L1/I Smed Fox into the L1 family (Fig. 3b). Furthermore, having more Platyhelminthes in the phylogeny resulted in two families grouping into a new branch (Figs. 3a,b, S4, S5). These were named foxA(P) and foxN(P) as they appeared to be divergent members of the A and N families. The L1 family also appeared to be divergent in all Tricladida and is the cause of FoxL1/I appearing as an outgroup in the metazoan tree (Fig. 1c). In contrast with the QD family, which was present all along the metazoan tree, these Figure 4. Distribution of Fox homologs reveals huge family loss and gene diversification in Platyhelminthes. Coloured boxes indicate the presence of an ortholog based on the phylogenetic analysis. When there were no evidences of ortholog, the box remained white. A number (x Nº) inside a box indicates paralogs per family and species. Families are divided in Clade I and II. Number of genes and number of families per species are indicated. Species were classified into Platyhelminthes and Tricladida phylogeny accordingly to28 and51,respectively. Light orange indicates Platyhelminthes species within turquoise lines indicate Tricladida species; grey box indicates Dugesiidae family. Species belonging to the Tricladida order show different losses, gains and specialization events. Gains (+) and losses (−) of genes are indicated. Specifically, many families were lost in Platyhelminthes (red dashed polygon). FoxA(P) and FoxN(P) origin seems to predate Proseriata and Tricladida order, respectively.
two new subfamilies were only present in the Platyhelminthes superphylum. We have considered them to be Platyhelminthes-specific subfamilies as they still cluster together with their main branch, but do not mix with the other members. In the case of the N(P), it appears to be Triclad-specific. However, a more exhaustive phy-logenetic analysis should be performed to support this observation. We propose that the huge losses that took place before the origin of this clade may have caused the duplication and divergence that ultimately lead to the formation of the A(P) and N(P) subfamilies. According to the SCSeq databases both genes are expressed in spe-cific cells populations; foxA(P) in ‘activated early epidermal progenitors’ and foxN(P) in epidermic, GABAergic and secretory 2 cells, which could agree with its functional specialization after duplication. The RNAi analysis demonstrates they have an important role during regeneration, but further studies are required to investigate their specific role during planarians regeneration.
Tricladida may have suffered a genome reorganisation.
Regardless of the extensive above-men-tioned variations in family numbers due to gains and losses, the number of Fox genes present across organisms seems to be constant. The conserved number is roughly 23 genes with some obvious exceptions such as humans or sponges (Fig. 2). This regularity may seem surprising, but as Fernandez and Gabaldon69 pointed out, familylosses are usually compensated by gene duplications of the remaining family members (as appears to be the case in Platyhelminthes). We cannot discard the possibility that family losses were compensated by the emergence of de novo genes, which could cluster in pre-existing families due to artefacts of the clustering methods65. Another
interesting aspect to examine is the relation between the number of Fox genes and the number of Fox families. When we study this connection in Platyhelminthes we find the opposite; the number of families remains con-stant while the number of Fox genes increases in Tricladida (Fig. 4). This could be explained in three ways: i) Figure 5. New family FoxQD is broadly found in Metazoa but missing in Vertebrata and Porifera. The ML phylogenetic trees based on FKH of Q2 and QD family evolution in all metazoan species studied in this work. At nodes, values for the approximate Bayes (square) and Likelihood (circle) ratio test are shown. Colour indicates % of confidence. An Amq-J2/3 from the opposite clade was used as out group. Family branches are painted with the same colour as they are represented in the trees. Dark asterisk indicates a new fox characterized in Schmidtea mediterranea (Smed). Red cross indicates Saccoglossus kowalewski foxQD gene. Platyhelminthes QD genes are coloured light orange. Aminoacidic sequences used are placed in S1 and S3 File. Scale indicates expected aminoacidic substitution per site.
www.nature.com/scientificreports/
several tandem duplications occurred before the branching of Tricladida, ii) a partial genome duplication event happened and affected the Fox genes, iii) a whole genome duplication (WGD) event happened. Currently, we do not have enough data to support any of these hypotheses. Other studies that have found gene duplications in Platyhelminthes species propose that WGD events could have occurred63,64,70,71. In Smed, we found every Fox
gene in a different scaffold (except for foxA1 and foxD1) and we could not find any trace of microsynteny retained in the Fox gene regions, not even within the Smed genome comparing paralogs-containing scaffolds. It must be Table 2. New annotation of QD genes in different metazoan species. Number of paralogs per species is indicated. They are classified as New or Re-annotated genes. In this case, the previous family is shown.
Species nº FoxQD
Annotation
New Re Previous
Branchiostoma lanceolatum 1 x FoxD3
Ptychodera flava 2 x
Saccoglossus kowalevskii 1
Drosophil melanogaster 1 x Non annotated
Tribolium castaneum 1 x FoxA1_B-like
Schistosoma mansoni 1 x
Schmidtea mediterranea 1 x FoxQ2
Macrostumum lignano 3 x
Intoshia linei 1 x
Capitela teleta 1 x FoxQ2_Lb
Helobdella robusta 2 x
Lingula anatina 2 x
Lottia gigantea 1 x FoxQ2b
Octopus bimaculoides 2 x
Crassostrea gigas 2 x FoxB/FoxI
Nematostella vectensis 4 x
Figure 6. Fox paralogs do not present syntenic relationships in Smed genome. Alignments between scaffolds containing same-family Fox genes are represented with Circos. The Circos representation is composed of two tracks: In the outer ring the scaffolds containing Fox genes are labelled with their name (each tick representing 150 kb); in the inner ring, the repeating elements29 coloured in green (LINEs), blue (TLR) and black (simple
repeats and other). Repeats are filtered to be shown only when greater than 1 kb. Grey lines connecting the scaffolds are the representation of the alignments, filtered to be shown only when greater than 1 Kb. In each scaffold, the region corresponding to the Fox gene (+ -5 Kb) is represented as a perpendicular darker region, and all the links that fall onto it are coloured accordingly.
noted that although the Smed genome is not completely assembled but is still fragmented in 481 scaffolds, most of the scaffolds interrogated were more than 3 Mb long and only two of them shorter than 1 Mb. Thus, in the
Smed genome we cannot observe any indicator of WGD although a massive reorganization, erasing any trace of
it, could have occurred. For clarification, we would need a number of Tricladida available genomes of sufficient quality. Regrettably, the Smed genome is the only high quality Tricladida genome currently accessible.
Figure 7. Starving foxO (RNAi) animals show tissue disruption and a reduction of cell death. (a) Schematic depicting RNAi procedure. (b) 50% of in vivo foxO knockdown animals presented unpigmented regions (white arrow), neural tissue disappearance (yellow arrow in synapsin immunoassayed animals, and pharynx size reduction, as shown by DAPI staining and relative size quantification (controls, n = 17; RNAi, n = 18; *P < 0.05). (c) Quantification of TUNEL + cells on transversal sections show a reduction of positive cells in foxO (RNAi) animals compared to controls (controls, n = 86; RNAi, n = 117; *P < 0.05). (d) Quantification of caspase-3 activity in foxO (RNAi) animals and controls shows cell death reduction (controls, n > 6; RNAi, n > 6; **P < 0.01). Scale bars: b up and mid = 100 µm and down = 10 µm; c = 100 µm.
www.nature.com/scientificreports/
Specificity of Fox genes families expression and function.
The identification of the complete set of Fox genes in Smed together with the analysis of the expression pattern and function of the newly identified genes provides a more complete view of the function of each fox gene and family. Some results agree with an evolution-ary conserved role of fox families and others do not. For instance, the A family mostly participates in endoderm specification during gastrulation, notochord formation in vertebrates or pharynx formation in cnidarians and planarians72–76. Accordingly, in Smed, Djap and Spol, foxA1 is expressed in the pharynx, and particularly inSmed it was demonstrated to be fundamental for its specification33,77,78. However, we found foxA2 expression
in neuronal cells in de dorsoventral margin and foxA(P) in epidermal cells. Families C-F-L1-Q1 usually cluster together in the genome and participate in the development of mesoendodermal tissues in many organisms43,79.
We found no gene cluster arrangement of C-F-L1 families, but those genes might conserve their function deter-mining mesoendodermal tissues in Smed, since their expression correlates with muscle cells and, particularly,
foxF2 regulates a specific pharynx muscle type80,81. The D family is expressed in notochord and neural crest in
chordates, in intestinal precursors in C.elegans82 and in the nervous system in Drosophila melanogaster83. In
Smed and Djap, foxD1 is expressed in anterior muscle cells and participates in the anterior face decision84–86.
foxD2 and foxD3 were found in neurons and muscle cells, respectively. Accordingly, after knocking down foxD2,
planarians presented strong regenerative defects in the SNC. The J1 family was broadly found in ciliated cells in different animals and tissues87,88. In Smed, foxJ1-4 were found expressed in ciliated cells in different
epider-mal patterns37; and the new foxJ1-5 is found in the epidermis, neuronal and protonephridia cells, suggesting a
conserved function of the family in ciliated cells. In vertebrates, the K family has been found expressed in meso-dermal and ectomeso-dermal tissues89,90. In Smed, foxK1-3 were found in the nervous system and in parenchymal or
secretory cells. Interestingly, after the inhibition of three K genes, planarians presented regenerative defects in the nervous system, suggesting that all three genes have maintained a role controlling neurogenesis.
Overall, the integration of the current data regarding Fox families suggests that the expansion of families often results in expression and functional diversification.
Cell death regulation by Smed‑foxO is conserved in planarians.
Several Fox families have been lost or have been expanded in Platyhelminthes. Interestingly, the FoxO family is one of the few that shows a unique family member. FoxO has crucial roles in controlling molecular process related with aging and cancer41,69.FoxO senses oxidative stress and responds through regulating cell motility, stress resistance, or cell death91.
FoxO also has a conserved role in maintaining cellular energy homeostasis by coordinating cellular supplies and demands39. When nutrients are available, InsulinR is activated and FoxO is phosphorylated by AKT, which
inhibits its entrance into the nucleus59,60. Under conditions of growth factor limitation or other stresses, FoxO
enters the nucleus and inhibits mTORC1. Our data shows that Smed-foxO is probably regulated by AKT, since it conserves the phosphorylation domains and, furthermore, Smed-foxO RNAi inhibition impairs the apop-totic response, which is the opposite phenotype described after AKT RNAi in planarians77. Thus, it could be
proposed that in starved planarians, the limitation of nutrients inhibits the insulin pathway and AKT, allowing for the increase in levels of unphosphorylated Smed-foxO that can enter the nucleus. In the nucleus, Smed-foxO activates the apoptotic response required in starved planarians to trigger degrowth93–98. In Smed-foxO (RNAi)
animals this transcriptional activity cannot take place and neither can the apoptotic response. The reduction of cell death after foxO inhibition appears to be evolutionarily conserved as it has been also observed in Hydra99,
C.elegans100,101, Drosophila melanogaster20,102 and in various mammal tissue types103–106. Although the mRNA
expression of foxO is found in specific cell types its regulation can take place post-transcriptionally107, thus with
the present data we cannot discern about the contribution of specific tissues to the RNAi phenotype observed in this study. Since we have observed that epidermal cells are disorganized, and this is one of the cell lineages where foxO is expressed, we could hypothesize that a decrease in cell death in this cell type could contribute to the phenotype observed.
Smed-foxO could also be regulated by other pathways as the Sirtuin family108, which senses cellular metabolic
state and acetylates FoxO (activation). Recently, Ziman et al. have demonstrated in planarians that upon starva-tion and after sirtuin-1 inhibistarva-tion (foxO inhibistarva-tion) animals display a reducstarva-tion in cell death97.
The cellular REDOX state is not only essential for cellular homeostasis but it is necessary to activate the regenerative response in several models, as well as in planarians109. In this study we have shown that Smed-FoxO
is also required for proper regeneration, but further studies are required to test whether it also senses ROS levels both in regenerating and in intact planarians.
Conclusions
As we acquire more information on the presence of the TF Fox family across metazoan species, it becomes clearer that some Fox genes originated at the base of metazoans followed by different events of gene loss and diversification as proposed by42,69,110. Following this thread, as the number of annotated Fox genes increase,
our ability to classify them also improves up until the point where ideally no Fox would be misannotated. In the past, these errors in the annotation led to a misunderstanding of the evolution of conserved functions in different Fox families.
In this study, the new annotation allowed for the proposal of a new family present in most metazoans, the FoxQD, as well as specific families exclusively found in Platyhelminthes. The appearance of phylum-specific families might not be unique to Platyhelminthes and could have happened several times throughout evolution. To prove this theory, there is a need of a better Fox gene annotation from all across the metazoan spe-cies. Besides, the proper phylogeny of these genes is not the only benefit. Having better annotated Fox genes in different key species will also help us to understand how different gene regulatory networks and developmental processes could have evolved.
Schmidtea mediterranea is a unique model that raises developmental questions in an evolutionary context
due to its position in lophotrochozoans, an under-studied clade, and due to its stem cell-based plasticity. The identification of 27 genes divided into 12 families will give us the bases from which to understand how the TFs take part in the regulation of key molecular pathways that control major developmental roles. In particular, in this study we proved that Smed-foxO, which in contrast to other families is constantly present in metazoans, is evolutionary conserved to regulate cell death.
Finally, the identification of complete gene families in Smed will also help to understand the evolution of pla-narians and Platyhelminthes. Here we have seen how in the order Tricladida the number of Fox genes increased while the number of families was retained. However, we could not find traces of neither a genome (whole or partial) duplication event nor tandem duplications of the Fox genes. This indicates that in planarian ancestors a genomic reorganisation could have occurred. A larger amount of Platyhelminthes and Tricladida genomes are needed to clarify these evolutionary scenarios.
Methods
All methods were carried out in accordance with relevant guidelines and regulations.
Experiments were performed with planarians, flatworms that do not require specific approvals.
Sequence and phylogenetic analyses.
For generating the phylogenetic trees, we first obtained the FOX protein sequences from several different sources. In some of the cases we were able to collect them from the public databases, like in the case of Hsa or Xtr (S2 Table). For the rest of the organisms a manual annotation was required. If the only resource available was a transcriptome, like in the case of Tsol, we used Transdecoder (v5.5.0) to obtain the translated proteins. Using HMMER with default parameters and a cutoff e-value of 1e-4 (v3.1b2) and the Pfam111 motive of the Forkhead domain (PF00250.13), we extracted the Forkhead-containingproteins.
The whole set of translated proteins was aligned again using MAFFT112 with the L-INS-i strategy and the
aligning Forkhead domain was selected. This alignment was the input used for IQ-TREE113 to generate the
phylogenetic tree. The options used to run the webserver of IQ-TREE were the ones by default, including the automatic substitution model selector and the ultrafast bootstrap analysis, except for the number of bootstrap alignments (set at 2500), the single branch test number of replicates (set at 2000) and the approximate Bayes test option (selected). The trees were visualized using Dendroscope3 v3.6.3114 with the default parameters.
For Smed FOX domains disposition architecture the NCBI web server was used (http://www.ncbi.nlm.nih. gov/Struc ture/cdd/wrpsb .cgi) to identify FKH, FHA and FOXP coiled coil;115 and116 were used to identify NLS
and NES, respectively.
Paralog analysis.
The homology relationships between Smed and human was assessed with the best hit in a two-way blast (v2.6.0) search against human RefSeq transcripts. For the analysis of Smed scaffolds, a blast of the whole genome against the whole genome with the parameters “-evalue 1e-20 -word_size 100” was performed, and then the data was visualized using Circos (v0.69-9), adding a track for repeating elements. Both, the links and the repeats were filtered for only rendering those greater than 1 Kb.Animal maintenance.
Asexual clonal strain of Smed BCN-10 biotype were maintained in PAM water117 aspreviously described118. To keep planarian population, animals were fed twice per week with liver, and starved
for a week before being used in any experiment.
Isolation of Fox genes and quantitative real‑time PCR.
In any experiment, TRIzol reagent (Invitro-gen) was used to extract total RNA from intact planarians, and cDNA was synthesized as previously described in98. Fox genes PCR fragments were cloned into pGEM-T Easy (Promega) vector for dsRNA synthesis or pCRII(Life Technologies) vector to ssRNA synthesis. Nucleotide sequence data reported are available in the Third Party Annotation Section of the DDBJ/ENA/GenBank databases under the accession numbers TPA: BK010973-BK010987. Quantitative real-time PCRs were performed on 7500 Fast PCR System (Applied Biosystems), exper-iments were conducted using 3 biological and 3 technical replicates for each condition. Expression levels were normalized to that of the housekeeping gene ura4. All primers used in this study are shown at S6 File.
Whole‑mount in situ hybridization.
SP6 or T7 polymerase and DIG- or FITC- modified (Roche) were used to synthesise RNA probes in vitro. For colorimetric whole-mount in situ hybridization (WISH) the previ-ously described119 protocol was followed. Animals were sacrificed with 5% N-acetyl-l-cysteine (NAC), fixedwith 4% formaldehyde (FA), and permeabilized with Reduction Solution.
RNAi experiments.
Double strand RNA (dsRNA) was synthesised by in vitro transcription (Roche) as pre-viously described120. Injections of dsRNA (3 × 32.2 nl) were carried into the digestive system of each animal on3 consecutive days per week using Nanoject II injector (Drummond Scientific Company). Experiments in intact animals were conducted with starved animals undergoing 2 consecutive weeks of injection, without amputation. In regenerating experiments, animals underwent two weeks of inhibition and amputation. gfp was injected as a control.
Immunohistochemistry staining.
Whole-mount immunohistochemistry staining was performed aswww.nature.com/scientificreports/
1% bovine serum albumin (BSA) in 1X PBSTx 0,3% (Blocking Solution) for 2 h at RT. Primary antibodies were diluted in blocking solution and incubated 16 h rocking at 4 °C. Then, washes were per performed for at least 4 h. Secondary antibodies were diluted in blocking solution for 16 h rocking at 4 °C.
The following antibodies were used in these experiments: mouse anti-synapsin (anti-SYNORF1, 1:50; Devel-opmental Studies Hybridoma Bank, Iowa City, IA, USA), rabbit anti-phospho-histone H3 (Ser10) (D2C8) (PH3) (1:500; Cell Signaling Technology) and mouse anti-VC1 (anti-arrestin, 1:15,000, kindly provided by Professor K. Watanabe). The secondary antibody used was Alexa 488-conjugated goat anti-mouse (1:400; Molecular Probes, Waltham, MA, USA) and Alexa 568-conjugated goat anti-rabbit (1:1000: Molecular Probes, Waltham, MA, USA). Nuclei were stained with DAPI (1:5000; Sigma).
Caspase 3 activity assay.
At the end of the second week of RNAi inhibition, protein extraction was per-formed. BioRad protein reagent was used to obtain protein concentration of the cell lysates. Fluorometric analy-sis of caspase-3 activity was performed as described previously122. Fluorescence was measured in alumines-cence spectrophotometer (Perkin- Elmer LS-50) using Fluostar Optima microplate fluoreslumines-cence reader (BMG Labtech), applying the following settings: excitation, 380 nm; emission, 440 nm. 20 mg of protein extract was used to determine enzyme activity, incubating for 2 h at 37 °C with 20 µM caspase-3 substrate Ac-DEVD-AMC or 2 ml from a stock of 1 mg/ml for a final volume of 150 µl. Three technical replicates were analysed per condi-tion.
TUNEL assay on paraffin sections.
Animals were sacrificed with 2%HCl and fixed with 4%PFA. Paraffin embedding and sectioning were carried out as previously described in123. Slides were de-waxed and re-hydratedas previously described in124. Sections were treated as described previously in125 and after the dewaxing step, they
were incubated with Proteinase K (20 µg/ml for 10 min at room temperature). Finally, the ApopTag Red In situ Apoptosis Detection Kit (CHEMICON, S7165) was used, following manufacturer’s protocol. Nuclei were stained with DAPI (1:5000; Sigma).
Imaging and quantification.
WISH images were captured with a ProgRes C3 camera from Jenoptik (Jena, TH, Germany). In vivo images were obtained using Scmex 3.0 camera in a Zeiss Stemi SV 6 binocular loupe and measured suing Fiji Y. A Zeiss LSM 880 confocal microscope (Zeiss, Oberkochen, Germany) was used to obtain confocal images of whole-mount immunostainings, TUNEL staining and epidermal sections. Representative confocal stacks for each experimental condition are shown. Cell counting of PH3 + and TUNEL staining was carried out by eye quantification in a previous defined area of each animal. Areas are schematically indicated in each figure. The total number of PH3 + cells was divided by the animal area. For TUNEL quantification, TUNEL positive cells were counted in at least 30 representative transversal sections per animal. The number of positive cells were divided by the mean area of the all sections in each animal. For epidermal cell density, the number of nuclei were manually counted and divided per the total image area. Images were blind analysed and later grouped according to each genotype. At least two animals were analysed per condition.Statistical analysis and presentation.
Statistical and presentation analyses were performed using GraphPad Prism 8. Two-sided Student’s t-tests (α = 0.05) were performed to compare the means of 2 popula-tions. To compare 2 populations, we used box plots depicting the median, the 25th and 75th percentiles (box), and all included data points (black dots). Whiskers extend to the largest data point within the 1.5 interquartile range of the upper quartile and to the smallest data point within the 1.5 interquartile lower ranges of the quartile.Received: 2 September 2020; Accepted: 18 December 2020
References
1. Golson, M. L. & Kaestner, K. H. Fox transcription factors: From development to disease. Development 143, 4558–4570 (2016). 2. Ré, B., Benayoun, A., Caburet, S. & Veitia, R. A. Forkhead transcription factors: key players in health and disease. Trends Genet.
https ://doi.org/10.1016/j.tig.2011.03.003 (2011).
3. Jackson, B. C., Carpenter, C., Nebert, D. W. & Vasiliou, V. Update of human and mouse forkhead box (FOX) gene families.
Human Genom. 4, 345–352 (2010).
4. Hannenhalli, S. & Kaestner, K. H. The evolution of Fox genes and their role in development and disease. Nat. Rev. Genet. 10, 233–240 (2009).
5. Enard, W. et al. Molecular evolution of FOXP2, a gene involved in speech and language. Nature 418, 869–872 (2002). 6. King, N. et al. The genome of the choanoflagellate Monosiga brevicollis and the origin of metazoans. Nature 451, 783–788 (2008). 7. Yamada, A. & Martindale, M. Q. Expression of the ctenophore Brain Factor 1 forkhead gene ortholog (ctenoBF-1) mRNA is
restricted to the presumptive mouth and feeding apparatus: Implications for axial organization in the Metazoa. Dev. Genes Evol. 212, 338–348 (2002).
8. Srivastava, M. et al. The Trichoplax genome and the nature of placozoans. Nature 454, 955–960 (2008).
9. Adell, T. & Müller, W. E. G. Isolation and characterization of five Fox (Forkhead) genes from the sponge Suberites domuncula.
Gene 334, 35–46 (2004).
10. Magie, C. R., Pang, K. & Martindale, M. Q. Genomic inventory and expression of Sox and Fox genes in the cnidarian Nematostella
vectensis. Dev. Genes Evol. 215, 618–630 (2005).
11. Tu, Q., Brown, C. T., Davidson, E. H. & Oliveri, P. Sea urchin Forkhead gene family: Phylogeny and embryonic expression. Dev.
12. Fritzenwanker, J. H., Gerhart, J., Freeman, R. M. & Lowe, C. J. The Fox/Forkhead transcription factor family of the hemichordate Saccoglossus kowalevskii. Evodevo 5, 17 (2014).
13. Yu, J. K. et al. The Fox genes of Branchiostoma floridae. Dev. Genes Evol. 218, 629–638 (2008).
14. Mazet, F., Yu, J. K., Liberles, D. A., Holland, L. Z. & Shimeld, S. M. Phylogenetic relationships of the Fox (Forkhead) gene family in the Bilateria. Gene 316, 79–89 (2003).
15. Paps, J., Holland, P. W. H. & Shimeld, S. M. A genome-wide view of transcription factor gene diversity in chordate evolution: Less gene loss in amphioxus?. Brief. Funct. Genom. 11, 177–186 (2012).
16. Saló, E. The power of regeneration and the stem-cell kingdom: freshwater planarians (Platyhelminthes). BioEssays 28, 546–559 (2006).
17. Wang, X., Kiyokawa, H., Dennewitz, M. B. & Costa, R. H. The Forkhead Box m1b transcription factor is essential for hepatocyte DNA replication and mitosis during mouse liver regeneration. Proc. Natl. Acad. Sci. USA 99, 16881–16886 (2002).
18. Wang, P. et al. Generation of mouse for conditional expression of forkhead box A2. Endocrinology 159, 1897–1909 (2018). 19. Lee, H.-H. & Frasch, M. Survey of forkhead domain encoding genes in the Drosophila genome: Classification and embryonic
expression patterns. Dev. Dyn. 229, 357–366 (2004).
20. Zhang, S. et al. DFoxO promotes Wingless signaling in Drosophila. Sci. Rep. 6, 22348 (2016).
21. Hope, I. A., Mounsey, A., Bauer, P. & Aslam, S. The forkhead gene family of Caenorhabditis elegans. Gene 304, 43–55 (2003). 22. Baguna, J., Salo, E. & Auladell, C. Regeneration and pattern formation in planarians. III. Evidence that neoblasts are totipotent
stem cells and the source of blastema cells. Development 107, 77–86 (1989).
23. Wagner, D. E., Wang, I. E. & Reddien, P. W. Clonogenic neoblasts are pluripotent adult stem cells that underlie planarian regen-eration. Science 332, 811–816 (2011).
24. Baguñà, J. The planarian neoblast: The rambling history of its origin and some current black boxes. Int. J. Dev. Biol. 56, 19–37 (2012).
25. Kaestner, K. H., Knochel, W. & Martinez, D. E. Unified nomenclature for the winged helix/forkhead transcription factors. Genes
Dev. 14, 142–146 (2000).
26. Wotton, K. R. & Shimeld, S. M. Comparative genomics of vertebrate Fox cluster loci. BMC Genom. 7, 271 (2006).
27. Grohme, M. A. et al. The genome of Schmidtea mediterranea highlights the plasticity of cellular core mechanisms. Nat. Publ.
Gr. https ://doi.org/10.1038/natur e2547 3 (2018).
28. Egger, B. et al. A transcriptomic-phylogenomic analysis of the evolutionary relationships of flatworms. Curr. Biol. 25, 1347–1353 (2015).
29. Rozanski, A. et al. PlanMine 3.0-improvements to a mineable resource of flatworm biology and biodiversity. Nucleic Acids Res. 47, D812–D820 (2019).
30. Albertin, C. B. et al. The octopus genome and the evolution of cephalopod neural and morphological novelties. Nature 524, 220–224 (2015).
31. Luo, Y. J. et al. The Lingula genome provides insights into brachiopod evolution and the origin of phosphate biomineralization.
Nat. Commun. 6, 8301 (2015).
32. Simakov, O. et al. Insights into bilaterian evolution from three spiralian genomes. Nature 493, 526–531 (2013).
33. Adler, C. E., Seidel, C. W., McKinney, S. A. & Sánchez Alvarado, A. Selective amputation of the pharynx identifies a FoxA-dependent regeneration program in planaria. Elife 3, e02238 (2014).
34. Cirillo, L. A. et al. Opening of compacted chromatin by early developmental transcription factors HNF3 (FoxA) and GATA-4.
Mol. Cell 9, 279–289 (2002).
35. Gaudet, J. & Mango, S. E. Regulation of organogenesis by the Caenorhabditis elegans FoxA protein PHA-4. Science 295, 821–825 (2002).
36. Eeckhoute, J. et al. Cell-type selective chromatin remodeling defines the active subset of FOXA1-bound enhancers. Genome
Res. 19, 372–380 (2009).
37. Vij, S. et al. Evolutionarily ancient association of the FoxJ1 transcription factor with the motile ciliogenic program. PLoS Genet. 8, e1003019 (2012).
38. Cruz, C. et al. Foxj1 regulates floor plate cilia architecture and modifies the response of cells to sonic hedgehog signalling.
Development 137, 4271–4282 (2010).
39. Stubbs, J., Oishi, I., Belmonte, J. C. I. & Kintner, C. The Forkhead protein, FoxJ1, specifies node-like cilia in Xenopus and Zebrafish embryos. Nat. Genet. 40, 1454 (2008).
40. Martins, R., Lithgow, G. J. & Link, W. Long live FOXO: Unraveling the role of FOXO proteins in aging and longevity. Aging Cell 15, 196–207 (2016).
41. Carter, M. E. & Brunet, A. Quick guide FOXO transcription factors. Curr. Biol. 17, 113–114 (2007).
42. Larroux, C. et al. Genesis and expansion of metazoan transcription factor gene classes. Mol. Biol. Evol. 25, 980–996 (2008). 43. Shimeld, S. M., Boyle, M. J., Brunet, T., Luke, G. N. & Seaver, E. C. Clustered Fox genes in lophotrochozoans and the evolution
of the bilaterian Fox gene cluster. Dev. Biol. 340, 234–248 (2010).
44. Yaguchi, S., Yaguchi, J., Angerer, R. C. & Angerer, L. M. A Wnt-FoxQ2-nodal pathway links primary and secondary axis speci-fication in sea urchin embryos. Dev. Cell 14, 97–107 (2008).
45. Chevalier, S., Martin, A., Leclère, L., Amiel, A. & Houliston, E. Polarised expression of FoxB and FoxQ2 genes during develop-ment of the hydrozoan Clytia hemisphaerica. Dev. Genes Evol. 216, 709–720 (2006).
46. Yu, J. K., Holland, N. D. & Holland, L. Z. AmphiFoxQ2, a novel winged helix/forkhead gene, exclusively marks the anterior end of the amphioxus embryo. Dev. Genes Evol. 213, 102–105 (2003).
47. Telford, M. J., Budd, G. E. & Philippe, H. Phylogenomic insights into animal evolution. Curr. Biol. 25, R876–R887 (2015). 48. Paps, J., Baguñà, J. & Riutort, M. Lophotrochozoa internal phylogeny: New insights from an up-to-date analysis of nuclear
ribosomal genes. Proc. R. Soc. B Biol. Sci. 276, 1245–1254 (2009).
49. Lapan, S. W. & Reddien, P. W. Transcriptome analysis of the planarian eye identifies ovo as a specific regulator of eye regenera-tion. Cell Rep. 2, 294–307 (2012).
50. Wang, C. et al. Forkhead containing transcription factor Albino controls tetrapyrrole-based body pigmentation in planarian.
Cell Discov. 2, 16029 (2016).
51. Sluys, R. & Riutort, M. Planarian diversity and phylogeny. Planarian Regener. 1774, 1–56 (2018).
52. Shimeld, S. M., Degnan, B. & Luke, G. N. Evolutionary genomics of the Fox genes: Origin of gene families and the ancestry of gene clusters. Genomics 95, 256–260 (2010).
53. Mazet, F., Amemiya, C. T. & Shimeld, S. M. An ancient Fox gene cluster in bilaterian animals. Curr. Biol. 16, R314–R316 (2006). 54. Irimia, M. et al. Extensive conservation of ancient microsynteny across metazoans due to cis-regulatory constraints. Genome
Res. 22, 2356–2367 (2012).
55. Herrera-Úbeda, C. et al. Microsyntenic clusters reveal conservation of lncRNAs in chordates despite absence of sequence con-servation. Biology (Basel). 8, 61 (2019).
56. Plass, M. et al. Cell type atlas and lineage tree of a whole complex animal by single-cell transcriptomics. Science 1723, eaaq723 (2018).
57. Zeng, A. et al. Prospectively isolated tetraspanin + neoblasts are adult pluripotent stem cells underlying planaria regeneration.
www.nature.com/scientificreports/
58. Lin, K., Hsin, H., Libina, N. & Kenyon, C. Regulation of the Caenorhabditis elegans longevity protein DAF-16 by insulin/IGF-1 and germline signaling. Nat. Genet. 28, 139–145 (2001).
59. Wang, X., Hu, S. & Liu, L. Phosphorylation and acetylation modifications of FOXO3a: Independently or synergistically?. Oncol.
Lett. 13, 2867–2872 (2017).
60. Obsil, T. & Obsilova, V. Structure/function relationships underlying regulation of FOXO transcription factors. Oncogene 27, 2263–2275 (2008).
61. Song, K.-H. et al. REP1 inhibits FOXO3-mediated apoptosis to promote cancer cell survival. Cell Death Dis. 8, e2536–e2536 (2018).
62. Yang, M. et al. Phylogeny of forkhead genes in three spiralians and their expression in Pacific oyster Crassostrea gigas. Chin. J.
Oceanol. Limnol. 32, 1207–1223 (2014).
63. Riddiford, N. & Olson, P. D. Wnt gene loss in flatworms. Dev. Genes Evol. 221, 187–197 (2011).
64. Olson, P. D. Hox genes and the parasitic flatworms: New opportunities, challenges and lessons from the free-living. Parasitol.
Int. 57, 8–17 (2008).
65. Guijarro-Clarke, C., Holland, P. W. H. & Paps, J. Widespread patterns of gene loss in the evolution of the animal kingdom. Nat.
Ecol. Evol. 4, 519–523 (2020).
66. Koziol, U., Jarero, F., Olson, P. D. & Brehm, K. Comparative analysis of Wnt expression identifies a highly conserved develop-mental transition in flatworms. BMC Biol. 14, 10 (2016).
67. Scimone, M. L., Kravarik, K. M., Lapan, S. W. & Reddien, P. W. Neoblast specialization in regeneration of the planarian Schmidtea
mediterranea. Stem Cell Rep. 3, 339–352 (2014).
68. Ong, T.-H. et al. Mass spectrometry imaging and identification of peptides associated with cephalic ganglia regeneration in
Schmidtea mediterranea. J. Biol. Chem. https ://doi.org/10.1074/jbc.M115.70919 6 (2016).
69. Fernández, R. & Gabaldón, T. Gene gain and loss across the metazoan tree of life. Nat. Ecol. Evol. https ://doi.org/10.1038/s4155 9-019-1069-x (2020).
70. Cho, S. J., Vallès, Y., Giani, V. C., Seaver, E. C. & Weisblat, D. A. Evolutionary dynamics of the wnt gene family: A lophotrochozoan perspective. Mol. Biol. Evol. 27, 1645–1658 (2010).
71. Olson, P. D., Zarowiecki, M., Kiss, F. & Brehm, K. Cestode genomics: Progress and prospects for advancing basic and applied aspects of flatworm biology. Parasite Immunol. 34, 130–150 (2012).
72. Fritzenwanker, J. H., Saina, M. & Technau, U. Analysis of forkhead and snail expression reveals epithelial–mesenchymal transi-tions during embryonic and larval development of Nematostella vectensis. Dev. Biol. 275, 389–402 (2004).
73. Olsen, C. L. & Jeffery, W. R. A forkhead gene related to HNF-3β is required for gastrulation and axis formation in the ascidian embryo. Development 124, 3609–3619 (1997).
74. Taguchi, S. et al. Characterization of a hemichordate fork head/HNF-3 gene expression. Dev. Genes Evol. 210, 11–17 (2000). 75. Boyle, M. J. & Seaver, E. C. Developmental expression of foxA and gata genes during gut formation in the polychaete annelid
Capitella sp. I. Evol. Dev. 10, 89–105 (2008).
76. Mango, S. E., Lambie, E. J. & Kimble, J. The pha-4 gene is required to generate the pharyngeal primordium of Caenorhabditis
elegans. Development 120, 3019–3031 (1994).
77. Martín-Durán, J. M., Amaya, E. & Romero, R. Germ layer specification and axial patterning in the embryonic development of the freshwater planarian Schmidtea polychroa. Dev. Biol. 340, 145–158 (2010).
78. Koinuma, S., Umesono, Y., Watanabe, K. & Agata, K. Planaria FoxA (HNF3) homologue is specifically expressed in the pharynx-forming cells. Gene 259, 171–176 (2000).
79. Mazet, F., Amemiya, C. T. & Shimeld, S. M. An ancient Fox gene cluster in bilaterian animals. Curr. Biol. 16, 314–316 (2006). 80. Scimone, M. L. et al. foxF-1 controls specification of non-body wall muscle and phagocytic cells in planarians. Curr. Biol. 28,
3787-3801.e6 (2018).
81. He, X. et al. FOX and ETS family transcription factors regulate the pigment cell lineage in planarians. Development https ://doi. org/10.1242/dev.15634 9 (2017).
82. Kersey, R. K., Brodigan, T. M., Fukushige, T. & Krause, M. W. Regulation of UNC-130/FOXD-mediated mesodermal patterning in C. elegans. Dev. Biol. 416, 300–311 (2016).
83. Lacin, H. et al. Genome-wide identification of Drosophila Hb9 targets reveals a pivotal role in directing the transcriptome within eight neuronal lineages, including activation of Nitric oxide synthase and Fd59a/Fox-D. Dev. Biol. 388, 117–133 (2014). 84. Vogg, M. C. et al. Stem cell-dependent formation of a functional anterior regeneration pole in planarians requires Zic and
Forkhead transcription factors. Dev. Biol. 390, 136–148 (2014).
85. Koinuma, S., Umesono, Y., Watanabe, K. & Agata, K. The expression of planarian brain factor homologs. DjFoxG and DjFoxD.
https ://doi.org/10.1016/s1567 -133x(02)00097 -2 (2003).
86. Scimone, M. L., Lapan, S. W. & Reddien, P. W. A forkhead transcription factor is wound-induced at the planarian midline and required for anterior pole regeneration. PLoS Genet. 10, e1003999 (2014).
87. Yu, X., Ng, C. P., Habacher, H. & Roy, S. Foxj1 transcription factors are master regulators of the motile ciliogenic program. Nat.
Genet. 40, 1445–1453 (2008).
88. Sinigaglia, C., Busengdal, H., Leclère, L., Technau, U. & Rentzsch, F. The bilaterian head patterning gene six3/6 controls aboral domain development in a cnidarian. PLoS Biol. 11, e1001488 (2013).
89. Pohl, B. S. & Knöchel, W. Isolation and developmental expression of Xenopus FoxJ1 and FoxK1. Dev. Genes Evol. 214, 200–205 (2004).
90. Casas-Tinto, S., Gomez-Velazquez, M., Granadino, B. & Fernandez-Funez, P. FoxK mediates TGF-β signalling during midgut differentiation in flies. J. Cell Biol. 183, 1049–1060 (2008).
91. Storz, P. Forkhead homeobox type O transcription factors in the responses to oxidative stress. Antioxid. Redox Signal. 14, 593–605 (2011).
92. Tatebe, H. & Shiozaki, K. Evolutionary conservation of the components in the tor signaling pathways. Biomolecules 7, 77 (2017). 93. Bagunyà, J. & Romero, R. Quantitative analysis of cell types during growth, degrowth and regeneration in the planarians Dugesia
mediterranea and Dugesia tigrina. Hydrobiologia 84, 181–194 (1981).
94. Thommen, A. et al. Body size-dependent energy storage causes Kleiber’s law scaling of the metabolic rate in planarians. Elife 8, 1–29 (2019).
95. Pascual-Carreras, E. et al. Planarian cell number depends on blitzschnell, a novel gene family that balances cell proliferation and cell death. Development 147, 1–14 (2020).
96. de Sousa, N., Rodríguez-Esteban, G., Rojo-Laguna, J. I., Saló, E. & Adell, T. Hippo signaling controls cell cycle and restricts cell plasticity in planarians. PLoS Biol. 16, e2002309 (2018).
97. Ziman, B., Karabinis, P., Barghouth, P. & Oviedo, N. J. Sirtuin-1 regulates organismal growth by altering feeding behavior and intestinal morphology in planarians. J. Cell Sci. https ://doi.org/10.1242/jcs.23946 7 (2020).
98. Almuedo-Castillo, M. et al. JNK controls the onset of mitosis in planarian stem cells and triggers apoptotic cell death required for regeneration and remodeling. PLoS Genet. 10, e1004400 (2014).
99. Lasi, M., David, C. N. & Böttger, A. Apoptosis in pre-Bilaterians: Hydra as a model. Apoptosis 15, 269–278 (2010).