FAST INDOOR MAPPING TO FEED AN INDOOR DB FOR BUILDING AND FACILITY
MANAGEMENT
Stefano Cantoni1, Giorgio Vassena 1
1DICATAM, University of Brescia, Brescia Italy, ([email protected], [email protected])
Commission II
KEY WORDS: 3D Survey, Mobile Mapping System,SLAM, Laser Scanner, Spherical Images, Point Cloud, Facility Management ABSTRACT:
Facility Management activities require to collect and organize a large amount of information about a building as, for example, geometry, MEP structures, lighting and antifire devices, typologies of furniture, paving characteristics, structures and more. Nowadays the data acquisition procedures for indoor environments are usually still carried on with old style approach, where surveyors have to manually map and acquire the data, walking along the sites with a poor level of digitalization The success story presented in the paper describes how using an Indoor Mobile Mapping approach (Zlot et al., 2014), it is possible to satisfy the need to acquire plant views of a large parts of buildings and, simultaneously, to record a 3D+Full resolution RGB images. Thanks to this fast acquisition it is later possible to feed a 2D/3D database, identifying the main objects needed to support a facility management process..The iMMS that has been used is based on SLAM approach, that allows the user to map and survey large sites also indoor, that means without the presence of GNSS signal and without the use of accurate and expense IMU devices. The data acquired in the field has been process with standard/commercial software that is usually used to create DB for outdoor mobile mapping.
1. INTRODUCTION
Facility Management is becoming more and more important in the phases of buildings renovation and maintenance industry, for the reason of its capability to significantly reduce the total costs. In order to be more effective, Facility Management procedures require large amount of information to be acquired at reasonable costs and in a short period of time. The acquisition of main sites geometry and to catalogue the large number of different data has been usually done, until now, simply by using a laser distance meter and a notepad, with an important impact in terms of working hours and costs. Moreover this approach limits also the number and density of data that can reasonably be acquired and managed. In this paper the focus is to evaluate an alternative procedure that takes advantages of the last technologies and allows to acquire geometrical information combined with 3D+Full resolution RGB images just by walking along the sites. This approach can be carried on using innovative iMMS, where the 3D point cloud obtain by the surveying system is enriched by a synchronized high resolution camera (Barsanti, et al, 2012). The instrument used to carry out the test is Gexcel Heron AC-2 that is a Mobile Mapping System that has all the main characteristics of an innovative SLAM iMMS, developed by Gexcel in agreement with the Research Laboratories of the European Commission (JRC) (Ceriani et al., 2015). It is important to notice that the main goal of this application, it is not to obtain the best mapping accuracy, but to be able to feed with a sustainable approach, a large object documentation where the positioning of each element can be defined also with medium accuracy of several centimetres. The Heron system is composed by a light backpack that allows the surveyor to easily walk inside every site, to climb stairs and to free move in an effective way both in large and narrow areas. The instrument uses a Velodyne HDL 32 laser scanner (Velodyne LiDAR. HDL-32, 2018) and the images are acquired using a Garmin VIRB 360 camera are integrated in the system. The system output is composed by a 3D point cloud with synchronized images that can be used to give colour to the point cloud or can be visualized independently. The instrument is
based on a SLAM algorithm that uses also the data coming from an Inertial Measurement Unit positioned under the laser scanner head, to increase the trajectory evaluation. In this way is possible also to access indoor environments, always critical for the GNSS based instruments because of the absence of satellite signal. The data is acquired simply by walking through the rooms and once the acquisition is finished the raw data (coming from the laser scanner and from the IMU (Xsens, 2018) ) are transferred to a workstation where a dedicated software process the data, evaluate the trajectory of the surveyor and minimize the typical drifts of the SLAM approach (Corso and Zakhor, 2013; Nocerino et al, 2017; Zhang and Singh, 2015). The software is capable to, clean the noise coming from moving objects and, finally, returns an unstructured point cloud associated to the spherical images. This kind of mapping systems allows to visualize in real time, during the acquisition process both the acquired point cloud and the images taken on the field. The possibility to see in real time the images acquired on the field, opens to innovative various scenarios not already fully investigated. The surveyor during the mapping process, can directly introduce notes and tags about interesting features or objects observed on the field. Some data can be categorized already on the field, reducing the time and costs of post processing procedures. Not only. Moreover new services and application can be implemented. For example considering that the data acquired depicts the building state of affairs at the survey time, the dataset provided with these SLAM indoor mapping approach is becoming probative, and comparisons between consecutive acquisitions can prove if and when a maintenance activity has been done or to monitor the quality and characteristics of the work. It is time to evaluate the characteristics and quality of these iMMS not just looking and the accuracy obtained by these approaches, compared to a classical static scanner mapping approach. It is time to consider these technology for the benefits of large site fast mapping and fast data acquisition, as a link between classical surveying and innovative geospatial world (Lauterbachet al, 2015).
The case study reported in this paper is the result of four tests carried out in different public sites in North of Italy aimed to
The International Archives of the Photogrammetry, Remote Sensing and Spatial Information Sciences, Volume XLII-2/W9, 2019 8th Intl. Workshop 3D-ARCH “3D Virtual Reconstruction and Visualization of Complex Architectures”, 6–8 February 2019, Bergamo, Italy
evaluate how Mobile Mapping Systems can be useful in order to provide digital documentation exploitable in facility management applications. Different buildings have been chosen in order to better evaluate the peculiarities of each typology and consequently to define a common standard approach during the survey. Restoration interventions have recently interested one of this buildings and new sensors as smoke detectors, motion sensor and emergency lighting devices have been installed, making more challenging to feed the building indoor database. 1.1 Case studies
The buildings are located in the Milan and Brescia (North Italy). The buildings are different in dimension and typology. In the Table 1 the main characteristics of the surveyed sites have been reported.
ID Typology N° Rooms Average surface [m2]
1 Reception Area 24 680
2 Public Office 29 806
3 Public Office 60 1900
4 Hospital 95 2500
Table 1: Sites surveyed during the tests 1.2 Instrument Used
As already mentioned the tests have been carried out using Heron AC-2 Color by Gexcel srl, see figure 1. The Velodyne HDL 32 LiDAR head acquires 700.000 points per second for 32 laser lines, with a range up to 100 m with an angular field of view of 360 degree horizontal and 40 degree vertical. Figure 1 shows how is organized the instrumented surveying head, with the camera a Garmin Virb 360 installed on the topo of the laser head and with an acquisition frame rate of 60 FPS. The data coming from the IMU and the LiDAR sensor are instantaneously processed and visualized in the Control Unit. Also the acquired images are displayed in the Control Unit screen.
1.3 Software Used
Specific software have been used during the tests and the main features later described. The Heron Live application manages the instrument and the data acquisition of the data in the field work. It allows to start, manage and review the acquisition in real time, helping the operator to directly check on site the recorded data. Unfortunately at the moment it is not possible to fill up a DB already on the field. The images and the point cloud is displayed in real time on the Control Unit, but it is not possible to insert tags or notes connected to objects observed in the images. It is possible only to insert tags connected to the position of the sensor. It means that by now it is not already possible to fill a DB already on the field.
The raw data acquired in the field by the three sensors (Camera, Laser Scanner and IMU) have to be moved after the mapping process to a post processing software that manages the raw data post processing. In this software trajectory is evaluated and several tools are available to process and improve the quality of the result provided by the SLAM algorithm. From this process a 3D point cloud in PLY format is provided, with a directory with synchronized panorama images and an easy readable image site map the extracted 2D maps (called Blueprint - Figure 3).
Figure 1: Particular of the Heron iMMS
To define a reference system for the point cloud, or to produce a data format compatible with Orbit software, a point cloud software manager has to be used (provided with the instrument). Orbit is a well worldwide know platform to recognize features and object from images synchronized with point clouds. Mainly used in Outdoor Mobile Mapping System project, have been tested in this project for indoor projects too. Orbit Feature Extraction in fact allows to visualize, overlap and simultaneously visualize point cloud and images in more than one windows. In this application the catalogue of the features and the data base have to be created and organized.
2. DEVELOPED METHODOLOGY
The tests helped us to define a complete workflow that has to followed to allows to go from the on the field survey to final deliverables production. We defined five consecutive steps. 1. At first it is necessary to organization the "on the field" survey;
2. As second the data acquisition of the data has to be carried on;
3. As third the surveyed raw data have to be moved from the instrument to a workstation for a post processing phase. This step can be avoided in some instruments, even if the more advanced ones need this data elaboration step to improve and check the data quality and robustness;
4. As fourth step the point cloud data and images have to be moved to a lidar data software capable to define the reference system (if necessary), to filter and "clean the 3D data", if necessary, and to transform the data into needed different formats.
5. The fifth step is to organized the structure and the organization of the database, to be able to provide the deliverables need in the facility management application software.
For the tests here described a portable Dell Inspiron 7566 workstation have been used, with processor Intel Core
i7-The International Archives of the Photogrammetry, Remote Sensing and Spatial Information Sciences, Volume XLII-2/W9, 2019 8th Intl. Workshop 3D-ARCH “3D Virtual Reconstruction and Visualization of Complex Architectures”, 6–8 February 2019, Bergamo, Italy
6700HQ quad core 3.5 GHz, 16 GB DDR4 installed, graphic card Nvidia GTX 960M and 4 GB GDDR5 installed.
2.1 Survey organization
It is undoubtedly the most important step. The tests have shown that a well done organization of the movements of the surveyor along the site it is essential for a good result. In particular the images are acquired to extract features and to recognize objects. For this reason, the surveyor have to avoid obstacles that create problems in the quality and completeness of the images. It sound like obvious, but it crucial to organize the mapping work in the way to avoid the downtime for simple operations as the opening or unlock the doors, in offices and/or hospitals. The real problem it is not the time lost, but in the test it was possible verify that the post processing time increase exponentially with the surveying time. If a mapping phase last 10 minutes instead of 5 minutes, the problems created are not the "5 minutes" but double of the size of the data acquired (with no reason), the increase of time for data downloading and the big increase of time for data processing.
For this reason a good organization of the on the field survey allows to significantly reduce the global time for data post processing. A well-organized survey means less time on the field, reduce the mistakes and lighter datasets. It is always necessary to remember that these 3D indoor mapping approaches are now technically; the problem is not only to define a working process workflow, but to define a process that must required sustainable costs. For this reason, in our tests, some simple precautions have been adopted. A continuous path has been studied and an assistant have been walking with the surveyor, opening doors and removing obstacles where they are present, before the starting of the mapping phase. This helps to save up to the 50 per cent of the survey time. The personnel present in the offices have been previously informed about the mapping activity, so to avoid to be required to explain the activity,
If the acquisition has to be carried out during the working hours, it is often necessary to work with several people moving around the instrument. For this problem it is was possible to test the "moving object filter" present in the Heron post processing software, capable to produce a point cloud where moving objects, as person (in indoor), or vehicles (in outdoor) can be automatically filtered. Nevertheless, the tests have shown that acquiring the data at the end of the working day, when the workers have already left the offices, helps to save up to 15% of the time needed during the post processing, because the "moving object removal tool" required a long data processing procedure.
2.2 Acquisition of the data
It is important to remember, that in several Facility Management applications the surveyed sites are in use. An easy portable instrument as Heron or GeoSlam has a minimum impact and for this reason it is possible to work also in "critical" sites as hospitals and offices. The possibility to easily pass stairs and steps make this category of instruments very productive. The trolley based solutions could not be applied in these sites (Schmitz et al 2015). On the other side, the easy portable mapping devices, as Heron, cannot provide at the moment the same image resolution and quality of the trolley based solutions. With the Heron Mobile Mapping System, the acquisition is translated simply in a walk through the environments. Table 2 shows the results of the acquisition steps for each of the four
tests here described (see Figure 2), using Heron as mapping system.
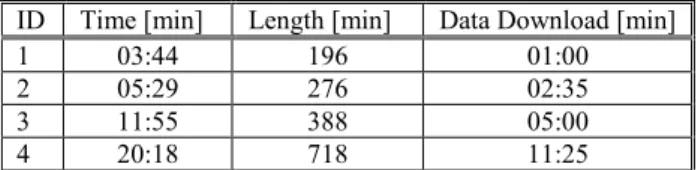
ID Time [min] Length [min] Data Download [min]
1 03:44 196 01:00
2 05:29 276 02:35
3 11:55 388 05:00
4 20:18 718 11:25
Table 2: Report of the acquisition step
As the results of the tests it was observed that to organized a mapping procedure with very short acquisition phases it is very productive. The point clouds can be easily overlap in the post processing software. The process, fast/short mapping and fast/short post processing data elaboration, allow to immediately check the quality of the work, to immediately provide a fast BluePrint map to the technicians working on the site. For this reason it was decided to avoid long acquisition phases, even if technically possible.
Figure 2: Particular of the acquisition procedure 2.3 Post processing of the raw data
In the most professional instruments, as the one tested in this experiment, the raw data have to be moved to a workstation for a post processing elaboration phase. In Table 3 it is possible to check, for each test, the time needed to process the raw data, divided in the post processing elaboration phases of the Gexcel Heron post processing software.
ID Odometer Create
Maps Optimiz. Global Clean Data Export 1 03:39 01:44 00:17 01:42 02:47 2 04:38 02:55 00:24 03:20 04:30 3 08:54 05:16 00:30 05:11 08:32 4 18:15 12:25 01:19 10:50 17:15 Table 3: Particular of the processing time
It is not interesting to go in the details of every elaboration phases, but it is clear that the elaboration time dramatically increase with the mapping time. For this reason it is interesting to organize the work, as mentioned, in short mapping phases, to be easily overlapped in post processing.
The first deliverable of the mapping process can be visualized as a fast map (see Figure 3 where is reported the blueprint obtained from the Test 3). In this test the data obtained from Heron, available in PLY, trajectory and images formats, have
The International Archives of the Photogrammetry, Remote Sensing and Spatial Information Sciences, Volume XLII-2/W9, 2019 8th Intl. Workshop 3D-ARCH “3D Virtual Reconstruction and Visualization of Complex Architectures”, 6–8 February 2019, Bergamo, Italy
been moved to JRC 3D Recostructor for Heron software where a coordinate transformation has been done just to avoid negative values in the point clouds coordinates. Once moved in a local coordinate reference system, the data have been organized to be transferred to Orbit software platform. In particular, the absolute position and orientation information for each camera (image) at time of recording have exported as .csv file. Point clouds have been moved to .las standard format and the images as .jpg equirectangular panoramas.
Figure 3: Test 3, particular of the Blueprint 2.4 Data Base organization
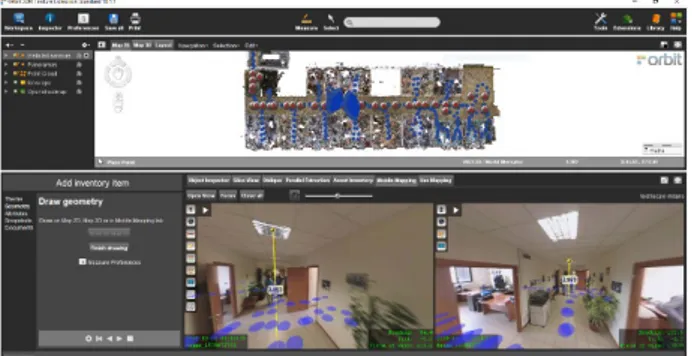
The 3D dataset of the survey, correctly organized as described in 2.3 and in a format of a template loadable in Orbit Feature Extraction software (Orbit, Geospatial Thechnologies, 2018), a database to manage the data have to be created or an existing one have to be imported in Orbit. For these tests a new database has been created. The database contains standard information as the ID, geometric information as the position of the object and the vertical distance between the centre of the object and the floor, or snapshots and annotations. Thanks to Orbit it is possible to create a new theme in the asset inventory tools consistently to the database structure. The cataloguing operation starts by selecting the theme from the theme list created and by adding new inventory items while navigating the 3D Model.
Figure 4: Particular of the Orbit cataloguing procedure
Figure 5: Particular of the Database created
2.5 Sharing
The dataset created in Orbit Feature Extraction (Orbit, Geospatial Technologies, 2018) are saved and exported as shape file. A compatibility test has been carried out and the datasets have been successfully imported and integrated both in ArcGIS and QGIS platforms.
3. CONCLUSIONS
The tests carried out in this case study have shown how the large amount of information obtained from an indoor Mobile Mapping System can be very usefully in Facility Management activities. If the iMMS is provided with a RGB camera capable to acquire Full resolution images, the instruments moves from a 3D mapping system to a 3D mapping system for geospatial application. This dramatically enlarge the field of applications of these instruments. In fact, with respect to the point cloud, from the images it is possible to recognize features and properties, making possible the cataloguing works and the data base creation.. This case study has shown that the problems related to the big data storage and the hardware limits can be reduced by adopting some precautions, as to organize the work in fast and short data acquisition that can be easily aligned in post processing.
ACKNOWLEDGEMENTS
The authors would like to acknowledge Gexcel for providing the used instrument, software licences and technical support during the data processing.
REFERENCES
Barsanti, S.G.; Remondino, F.; Visintini, D., 2012,
Photogrammetry and laser scanning for archaeological site 3D modeling—Some critical issues. CEUR Workshop
Proc.2012, 948, B1–B10.
Ceriani, S.; Snchez, C.; Taddei, P.; Wolfart, E.; Sequeira, V.; 2015, “Pose interpolation slam for large maps using moving 3d sensors,” in 2015 IEEE/RSJ International Conference on Intelligent Robots and Systems (IROS), pp. 750–757.
Corso, N.; Zakhor, A., 2013, Indoor localization algorithms for an ambulatory Human operated 3D mobile mapping system. Remote Sens. 5, 6611–6646.
Lauterbach, H.A.; Borrmann, D.; Heß, R.; Eck, D.; Schilling, K.; Nüchter, A., 2015, Evaluation of a backpack-mounted 3D mobile scanning system. Remote Sens., 7, 13753–13781. Nocerino, E.; Menna, F.; Remondino, F.; Toschi, L.; Rodriguez-Gonzalvez, P., 2017, Investigation of indoor and outdoor performance of two portable mobile mapping systems. In Proceedings of the SPIE Vol. 10332 Videometrics, Range Imaging, and Applications XIV, Munich, Germany, 25–29 June.
Orbit, Geospatial Technologies, 2018,. https://orbitgt.com/
Schmitz, L.; Schroth, G.; Reinshagen, F., 2015, Mapping Indoor Spaces with an Advanced Trolley Equipped with Laser
The International Archives of the Photogrammetry, Remote Sensing and Spatial Information Sciences, Volume XLII-2/W9, 2019 8th Intl. Workshop 3D-ARCH “3D Virtual Reconstruction and Visualization of Complex Architectures”, 6–8 February 2019, Bergamo, Italy
Scanners, Cameras and Advanced Software. GIM International, 12 October 2015.
Velodyne LiDAR. HDL-32., visit July 2018, http://www.gexcel.it/en/solutions/velodyne-lidar-sensors/velodyne-hdl-32e
Xsens. The leading innovator in 3D motion tracking technology, visit 2018,. https://www.xsens.com
Zhang, J.; Singh, S., 2015, Visual-lidar Odometry and Mapping: Low-drift, Robust, and Fast. In Proceedings of the 2015 IEEE International Conference on Robotics and Automation (ICRA), Seattle, WA, USA, 26–30 May 2015; pp. 2174–218.
Zlot, R.; Bosse, M.; Greenop, K.; Jarzab, Z.; Juckes, E.; Roberts, J., 2014, Efficiently capturing large, complex cultural heritage sites with a handheld mobile 3D laser mapping system. J. Cult. Herit., 15, 670–678.
The International Archives of the Photogrammetry, Remote Sensing and Spatial Information Sciences, Volume XLII-2/W9, 2019 8th Intl. Workshop 3D-ARCH “3D Virtual Reconstruction and Visualization of Complex Architectures”, 6–8 February 2019, Bergamo, Italy