Data in Brief 34 (2021) 106635
ContentslistsavailableatScienceDirect
Data
in
Brief
journalhomepage:www.elsevier.com/locate/dib
Data Article
ECG
waveform
dataset
for
predicting
defibrillation
outcome
in
out-of-hospital
cardiac
arrested
patients
✩
Sergio Benini
a
, Marija D. Ivanovic
b
, Mattia Savardi
a
, Jelena Krsic
b
,
Ljupco Hadžievski
b
,
c
, Fabio Baronio
a
,
∗
a Department of Information Engineering, University of Brescia, Via Branze 38, Brescia 25123, Italy b Vinca Institute of Nuclear Scientists, University of Belgrade, Belgrade, Serbia
c Diasens, Belgrade, Serbia
a
r
t
i
c
l
e
i
n
f
o
Article history:
Received 16 November 2020 Revised 4 December 2020 Accepted 7 December 2020 Available online 9 December 2020
Keywords: Ventricular fibrillation (VF) Defibrillation Shock outcome Prediction resuscitation cardiac arrest ECG waveform
a
b
s
t
r
a
c
t
Theprovideddatabaseof260ECGsignalswascollectedfrom patientswithout-of-hospitalcardiacarrestwhiletreatedby the emergency medical services. Each ECG signal contains a 9 second waveform showing ventricular fibrillation, fol-lowedby1minofpost-shockwaveform.Patients’ECGsare madeavailableinmultipleformats. AllECGs recorded dur-ingtheprehospital treatmentareprovided inPFDfiles, af-ter being anonymized, printed in paper, and scanned. For eachECG,thedatasetalsoincludesthewholedigitized wave-form(9spre-and1minpost-shockeach)andnumerous fea-turesintemporalandfrequencydomainextractedfromthe 9sepisodeimmediatelypriortothefirstdefibrillationshock. Basedonthe shockoutcome,eachECG filehasbeen anno-tatedbythreeexpertcardiologists,-usingmajoritydecision -, as successful (56 cases), unsuccessful (195cases), or in-determinable(9 cases).Thecode forpreprocessing,for fea-tureextraction,andforlimitingtheinvestigationtodifferent temporalintervals beforethe shock isalsoprovided.These datacouldbereused todesignalgorithmstopredict shock outcome basedonventricularfibrillation analysis,with the
✩ Data Availability: Cardially - ECG waveform dataset for predicting defibrillation outcome in out- of- hospital cardiac
arrested patients (Original data) (Mendeley Data) DOI of original article: 10.1016/j.artmed.2020.101963
∗ Corresponding author.
E-mail address: [email protected] (F. Baronio). https://doi.org/10.1016/j.dib.2020.106635
2352-3409/© 2020 Published by Elsevier Inc. This is an open access article under the CC BY-NC-ND license ( http://creativecommons.org/licenses/by-nc-nd/4.0/ )
Subject Cardiology and Cardiovascular Medicine
Specific subject area Quantitative analysis of ECG waveform in out-of-hospital cardiac arrested patients to guide and optimize resuscitation protocols
Type of data Table (.TXT format, .XLS format)
Graph (.PDF format)
How data were acquired Semiautomatic Heartstart 30 0 0 defibrillator (Laerdal Medical, Stavanger, Norway)
Data format Raw
Analysed Filtered
Parameters for data collection ECG and all relevant demographic information were recorded according to the Utstein guidelines [1] .
Description of data collection The ECG data were collected from 260 patients with out-of-hospital cardiac arrest treated by the emergency medical services according to the 2005 European CPR guidelines [2] . The defibrillation electrodes were placed onto the patient’s torso to comply with a standard lead II configuration.
Data source location Institution: University of Brescia City/Town/Region: Brescia Country: Italy
Data accessibility Repository name: Mendeley Data
Data identification number: DOI: https://doi.org/10.17632/wpr5nzyn2z.1
Direct URL to data: https://doi.org/10.17632/wpr5nzyn2z.1
Related research article Author’s name
Marija D. Ivanovi ´c, Julius Hannink, Matthias Ring, Fabio Baronio, Vladan Vuk ˇcevi ´c, Ljupco Hadžievski, and Bjoern Eskofier
Title
Predicting defibrillation success in out-of-hospital cardiac arrested patients: Moving beyond feature design [4]
Journal
Artificial Intelligence in Medicine (ISSN: 0933–3657)
DOI
https://doi.org/10.1016/j.artmed.2020.101963 .
Value
of
the
Data
•
The
data
can
be
used
by
both
computer
scientists
and
physicians
to
perform
quantitative
analysis
of
ECG
waveform.
•
The
data
are
useful
to
develop
models
and
classification
strategies
to
predict
the
defibrillation
outcome
of
out-of-hospital
cardiac
arrested
patients.
•
By
evaluating
the
likelihood
of
a
successful
defibrillation
outcome
the
optimal
timing
of
de-livering
the
shock
can
be
determined
avoiding
defibrillation
attempts
with
low
probability
of
success
in
favour
of
CPR
and
chest
compression.
•
The
developed
models
and
algorithms
could
be
made
available
in
the
current
automated
external
defibrillators
to
guide
resuscitation
protocols
with
respect
to
the
condition
of
the
patient.
S. Benini, M.D. Ivanovic and M. Savardi et al. / Data in Brief 34 (2021) 106635 3
Fig. 1. ECG waveform of subject 12,999 in ventricular fibrillation which returns to ROEA after the defibrillation. In ev- idence the arming (first row), the delivery of the first shock (second row), and the return of an organized electrical activity (third row).
1.
Data
Description
1.1.
ECG
original
files
The
260
patients’
ECGs
recorded
during
prehospital
treatment
by
the
emergency
medical
ser-vices
have
been
first
anonymized,
then
printed
in
paper,
scanned,
and
finally
converted
to
elec-tronic
files.
These
data
contain
9
s
of
pre-shock
waveform
and
1
min
of
post-shock
signal.
As
one
of
the
novelties
with
respect
to
data
used
in
our
previous
publication
[3
,
4]
,
we
make
here
available
all
the
260
original
ECG
signals
as
electronic
files.
Out
of
the
260
ECGs,
56
have
been
categorized
by
expert
cardiologists,
using
majority
voting,
as
successful
(ROEA,
i.e.,
re-turn
of
an
organized
electrical
activity),
195
as
unsuccessful
(NoROEA),
and
9
as
intederminable.
An
example
of
a
file
containing
the
ECG
waveform
with
ROEA
is
presented
in
Fig.
1
.
1.2.
Digitized
ecg
waveforms
We
make
also
available
the
260
patients’
ECGs
in
digitized
forms,
with
ECG
amplitude
time-courses
reported
in
textual
files
(.txt).
As
for
the
electronic
PDFs,
each
ECG
signal
contains
9
s
of
pre-shock
and
1
min
of
post-shock
ECGs.
However,
the
textual
file
of
different
patients
may
have
different
number
of
samples
since
the
Findgraph
software
[5]
,
used
to
convert
the
graphs
in
textual
form,
non-uniformly
samples
traces
in
the
temporal
coordinate.
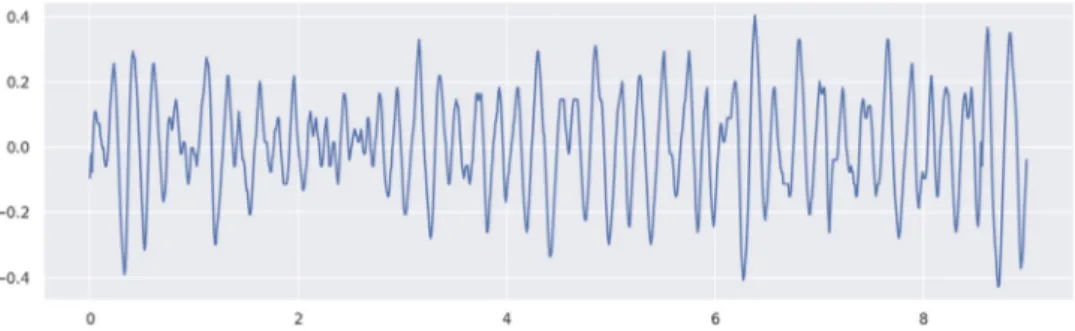
As
example
of
the
digitized
version
of
a
pre-shock
ECG
waveform
(which
is
the
digitized
version
of
Fig.
1
,
first
row)
is
given
in
Fig.
2
.
1.3.
Extracted
features
Features
have
been
extracted
from
the
9
s
episode
immediately
prior
to
the
first
defibrillation
shock
on
each
patient,
whereas
in
our
previous
publication
[3]
,
feature
were
computed
on
a
4
s
episode
prior
to
the
first
shock.
The
code
used
for
preprocessing
and
feature
extraction
is
Fig. 2. Digitized pre-shock ECG waveform of patient 12,999 (same patient as in Fig. 1 ).
Table 1
Extracted features and the references where they are defined, when available.
Time Domain Frequency Domain Wavelet Domain Non-linear Dynamic
RMS [7] AMSAabs [6] LBEn [11] PSDR [n.a.]
SA [8] PSA [6] MBEn [11] PAREA [n.a.]
MA [6] ENRG [6] HBEn [11] MSI [12]
WA [8] CF [6] ApEn [13]
AmpMax [n.a.] CP [6] ShEn [7]
AmpMin [n.a.] DF [7] H [9] PTT [6] EF [10] DFA [11] PPA [6] SFM [6] MedS [6] MS [6] Table 2
Average values of features in the time domain for ROEA vs. NoROEA patients.
NoROEA ROEA RMS (mV) 0 .152898 0 .233713 SA (
μ
V) 9 .256636 10 .347003 MA (mV) 0 .120922 0 .184623 WA (mV) 0 .314829 0 .468969 AmpMax (mV) 0 .447482 0 .686967 AmpMin (mV) −0 .465381 −0 .698427 PTT (mV) 0 .912863 1 .385395 PPA (mV) 0 .612459 0 .927987 MS (mV/s) 0 .019300 0 .025711 MedS (mV/s) 0 .164 4 40 0 .623704also
available,
and
can
be
parameterized
to
different
temporal
intervals.
The
features
we
provide
can
be
categorized
in
four
groups.
With
respect
to
time
domain,
we
have
features
of
waveform
amplitude,
phase,
and
slope:
•
root
mean
square
(RMS)
•
average
segment
amplitude
(SA)
•
mean
amplitude
(MA)
•
wave
amplitude
(WA)
•
maximum
amplitude
(AmpMax)
•
minimum
amplitude
(AmpMin)
•
amplitude
range,
or
peak-to-through
(PTT)
•
average
peak-to-peak
amplitude
(PPA)
•
median
slope
(MedS)
S. Benini, M.D. Ivanovic and M. Savardi et al. / Data in Brief 34 (2021) 106635 5
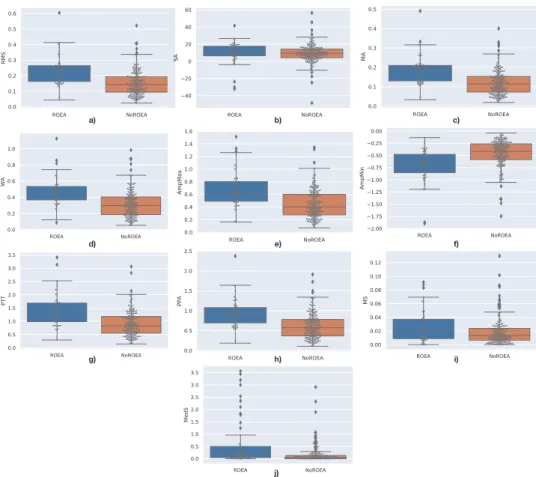
Fig. 3. Distribution of samples measured for the time-domain features, distinct for the two groups ROEA and NoROEA: a) RMS, b) SA, c) MA, d) WA, e) AmpMax, f) AmpMin, g) PTT, h) PPA i) MS, and j) MedS.
Table 3
Average values of features in the frequency domain for ROEA vs. NoROEA patients.
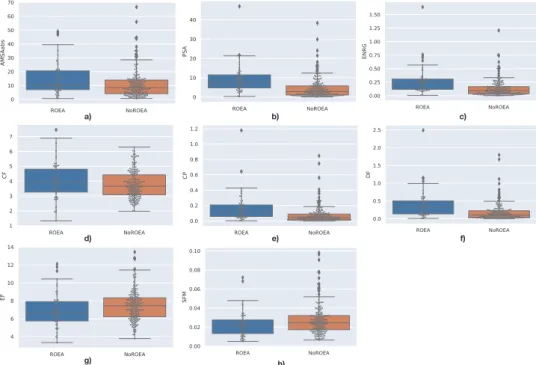
NoROEA ROEA AMSAabs 10.994175 14.699355 PSA 4.529459 9.270766 ENRG 0.133344 0.282428 CF 3.763439 3.995125 CP 0.074070 0.167588 DF 0.175819 0.397635 EF 7.447815 6.927589 SFM 0.027667 0.023053
Frequency
domain
features
used
for
description
of
the
frequency
characteristics
of
VF
wave-forms
are:
•
amplitude
spectrum
area
(AMSAabs)
•
power
spectrum
analysis
(PSA)
•
energy
(ENRG)
•
centroid
frequency
(CF)
•
centroid
power
(CP)
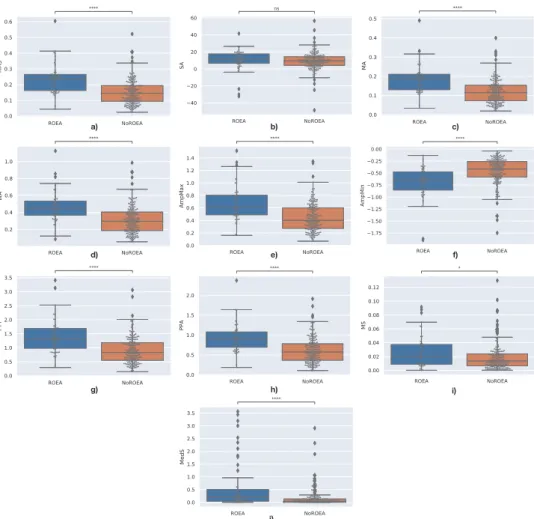
Fig. 4. Mann–Whitney–Wilcoxon test results on the time-domain features, distinct for the two groups ROEA and NoROEA: a) RMS, b) SA, c) MA, d) WA, e) AmpMax, f) AmpMin, g) PTT, h) PPA i) MS, and j) MedS. P-value annota- tion legenda: ns: 5.00e-02 < p < = 1.00e + 00; ∗: 1.00e-02 < p < = 5.00e-02; ∗∗: 1.00e-03 < p < = 1.00e-02; ∗∗∗: 1.00e-04
< p < = 1.00e-03; ∗∗∗∗: p < = 1.00e-04.
•
dominant
frequency
(DF)
•
edge
frequency
(EF)
•
spectral
flatness
measure
(SFM)
The
third
group
of
features
computed
by
the
continuous
wavelet
transform
provides
con-comitant
spectral
and
temporal
information:
•
total
energy
in
the
low-band
1–3
Hz
(LBEn)
•
total
energy
in
the
mid-band
3–10
Hz
(MBEn)
•
total
energy
in
the
high-band
10–32
Hz
energy
(HBEn)
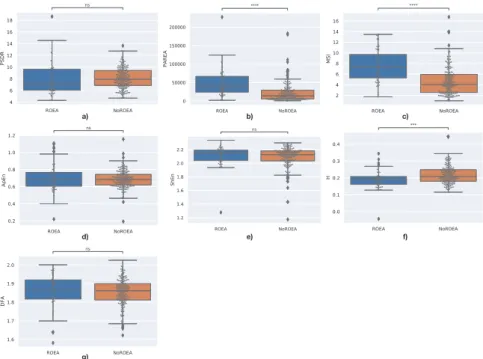
The
fourth
group
of
features
indicates
the
non-linear
dynamical
nature
of
VF
waveforms:
•
standard
deviation
of
the
ellipse
fitted
in
the
Poincare
scatter
plot
(PSDR)
•
area
of
the
ellipse
fitted
in
the
Poincare
plot
(PAREA)
•
median
stepping
increment
of
the
Poincare
plot
(MSI)
•
approximate
entropy
(ApEn)
S. Benini, M.D. Ivanovic and M. Savardi et al. / Data in Brief 34 (2021) 106635 7
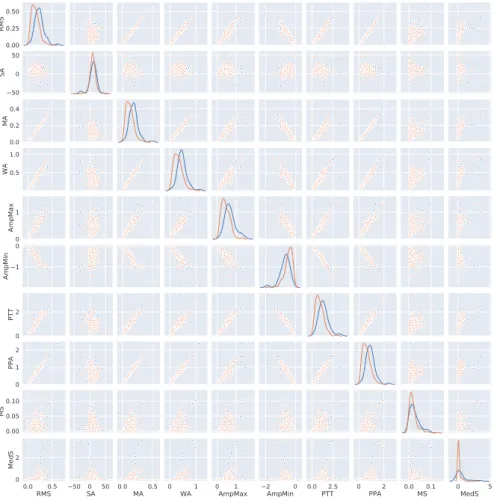
Fig. 5. Joint distribution of all pairs of time-domain features.
•
shannon
entropy
(ShEn)
•
hurst
exponent
(H)
•
detrended
fluctuation
analysis
(DFA)
As
another
difference
with
respect
to
[3]
,
we
make
here
available
the
data
extracted
fea-tures
computed
from
the
9
s
episode
immediately
prior
to
the
first
defibrillation
shock
on
each
patient.
For
preprocessing
purpose,
each
9
s
episode
was
uniformly
resampled
to
250
Hz
and
band-pass
filtered
between
0.5–48
Hz
to
suppress
residual
baseline
drift,
power
line
interference
and
high
frequency
noise.
The
features
were
then
extracted
following
the
definitions
given
in
the
references
in
Table
1
.
In
Table
2
we
show
the
average
values
of
the
features
belonging
to
time
domain,
for
both
ROEA
and
NoROEA
outcomes.
In
Figs.
3
we
show
the
distributions
of
the
time
domain
features
for
both
ROEA
and
NoROEA
outcomes.
The
box
plots
show
the
min
and
max
values,
-
outliers
excluded
-,
(upper
and
lower
black
lines),
the
median
value
(mid
black
line),
and
the
inter-quartile
range
(blue
and
orange
boxes).
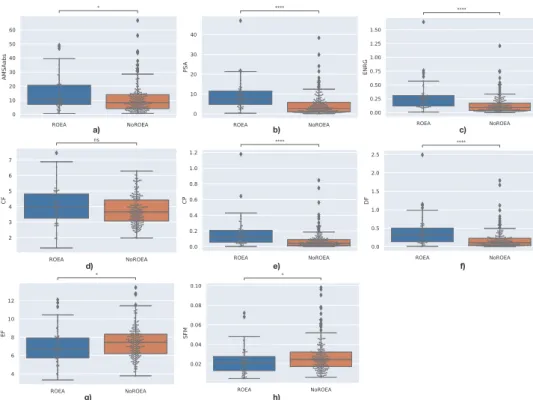
In
Fig.
4
,
we
show
for
each
time
feature,
the
results
of
the
Mann-Whitney-Wilcoxon
test
on
class
separability,
while
in
Fig.
5
we
plot
the
joint
distributions
of
all
pairs
of
features.
Fig. 6. Distribution of samples measured for the frequency-domain, distinct for the two groups ROEA and NoROEA: a) AMSAabs, b) PSA, c) ENRG, d) CF, e) CP, f) DF, g) EF, and h) SFM.
Table 4
Average values of features in the wavelet domain for ROEA vs. NoROEA patients.
NoROEA ROEA
LBEn 0.003593 0.006895
MBEn 0.005152 0.009774
HBEn 0.004783 0.009427
Table 5
Average values of features of the non-linear dynamical nature of VF waveforms for ROEA vs. NoROEA patients.
NoROEA ROEA PSDR 8.154644 8.034484 PAREA 22,836.241321 49,338.242941 MSI 4.707945 7.547057 ApEn 0.686185 0.709989 ShEn 2.086623 2.108529 H 0.219007 0.189328 DFA 1.853557 1.858302
Similarly
to
what
done
for
time-domain
features,
Table
3
,
Figs.
6
,
7
,
and
8
present
the
same
information
for
frequency
features,
i.e.,
the
average
values
of
features,
the
distribution
of
sam-ples,
the
Mann–Whitney–Wilcoxon
test,
and
the
joint
distributions
of
feature
pairs.
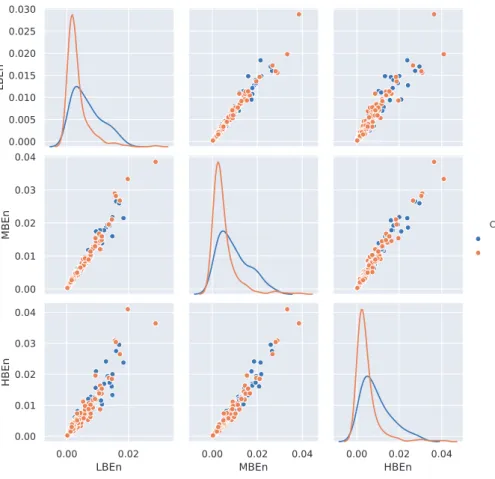
In
Table
4
,
Figs.
9
,
10
,
and
11
the
same
data
are
expressed
for
wavelet
domain
features;
eventually
Table
5
,
S. Benini, M.D. Ivanovic and M. Savardi et al. / Data in Brief 34 (2021) 106635 9
Fig. 7. Mann–Whitney–Wilcoxon test results on the frequency-domain, distinct for the two groups ROEA and NoROEA: a) AMSAabs, b) PSA, c) ENRG, d) CF, e) CP, f) DF, g) EF, and h) SFM. P-value annotation legenda: ns: 5.00e-02 < p < = 1.0 0e + 0 0; ∗: 1.0 0e-02 < p < = 5.0 0e-02; ∗∗: 1.0 0e-03 < p < = 1.00e-02; ∗∗∗: 1.00e-04 < p < = 1.00e-03; ∗∗∗∗: p < =
1.00e-04.
2.
Experimental
Design,
Materials
and
Methods
This
database
provides
the
ECG
recordings
immediately
prior
to
the
first
countershock
in
260
adult
patients
(
>
18
yo.)
with
sudden
out-of-hospital
cardiac
arrest
in
Brescia,
Italy.
The
data
were
collected
between
2006
and
2009
following
the
2005
European
CPR
guidelines
[2]
.
The
ECG
data
and
all
relevant
demographic
information
were
recorded
according
to
the
Utstein
guidelines
[1]
and
by
using
a
semiautomatic
Heartstart
30
0
0
defibrillator
(Laerdal
Medical,
Sta-vanger,
Norway).
The
electrodes
were
placed
onto
the
patients’
torso
to
comply
with
a
standard
lead
II
configuration.
Ethical
approval
of
this
study
was
obtained
through
the
ethical
committee
of
Brescia
(application
number
NP2753).
2.1.
ECG
original
files
and
ROEA
annotations
Patient
ECGs
recorded
during
prehospital
treatment
were
first
anonymised,
then
printed
in
paper,
scanned,
and
finally
converted
to
electronic
files.
These
data
contain
9
s
of
pre-shock
and
1
min
of
post-shock
ECGs,
for
a
total
length
of
9
s
and
1
min
each.
As
a
difference
with
respect
to
the
data
used
in
[3]
,
we
make
here
available
also
the
original
ECG
signals
as
electronic
files.
Three
experienced
cardiologists
were
independently
examining
1
min
post-shock
ECGs
and
annotated
each
as
successful,
unsuccessful
,
or
indeterminable.
A
shock
was
considered
successful
if
the
defibrillation
returned
organized
electrical
activity
(ROEA)
that
was
confirmed
by
ECG
with
Fig. 8. Joint distribution of pairs of frequency-domain features.
Fig. 9. Distribution of samples measured for the wavelet-domain features, distinct for the two groups ROEA and NoROEA: a) LBEn, b) MBEn, and c) HBEn.
the
heart
rate
between
40
and
150
beats/min
commencing
within
1
min
post-shock
and
persist-ing
at
least
15
s
without
continuing
CPR.
An
unsuccessful
shock
was
confirmed
if
VF,
ventricular
tachycardia,
asystole,
low
heart
rate
(
<
40
beats/min)
or
pulseless
electrical
activity
occurred
af-ter
defibrillation.
Based
on
the
cardiologists’
annotations,
9
signals
were
considered
indeterminable
and
dis-carded
from
the
analysis.
The
other
251
valid
first
shocks
were
categorized
as
successful
(ROEA)
or
unsuccessful
(NoROEA)
based
on
the
majority
of
doctors’
decisions.
S. Benini, M.D. Ivanovic and M. Savardi et al. / Data in Brief 34 (2021) 106635 11
Fig. 10. Mann–Whitney–Wilcoxon test results on the wavelet-domain features, distinct for the two groups ROEA and NoROEA: a) LBEn, b) MBEn, and c) HBEn. P-value annotation legenda: ns: 5.00e-02 < p < = 1.0 0e + 0 0; ∗: 1.0 0e-02 < p
< = 5.00e-02; ∗∗: 1.00e-03 < p < = 1.00e-02; ∗∗∗: 1.00e-04 < p < = 1.00e-03; ∗∗∗∗: p < = 1.00e-04.
Fig. 11. Joint distribution of pairs of wavelet-domain features.
2.2.
Digitized
ECG
waveforms
The
electronic
files
containing
9
s
of
pre-shock
and
1
min
of
post-shock
ECGs
were
after-wards
digitized
by
the
commercial
software
FindGraph
[5]
for
storage
and
offline
analysis.
Fig. 12. Distribution of samples measured for the non-linear dynamical nature of VF features, distinct for the two groups ROEA and NoROEA: a) PSDR, b) PAREA, c) MSI, d) ApEn, e) ShEn, f) H, and g) DFA.
Fig. 13. Mann–Whitney–Wilcoxon test results on the non-linear dynamical features, distinct for the two groups ROEA and NoROEA: a) PSDR, b) PAREA, c) MSI, d) ApEn, e) ShEn, f) H, and g) DFA. P-value annotation legenda: ns: 5.00e-02
< p < = 1.0 0e + 0 0; ∗: 1.0 0e-02 < p < = 5.0 0e-02; ∗∗: 1.0 0e-03 < p < = 1.0 0e-02; ∗∗∗: 1.0 0e-04 < p < = 1.00e-03; ∗∗∗∗: p
S. Benini, M.D. Ivanovic and M. Savardi et al. / Data in Brief 34 (2021) 106635 13
Fig. 14. Joint distribution of all pairs of non-linear dynamical features.
Ethics
Statement
Ethical
approval
of
this
study
was
obtained
through
the
Ethical
Committee
of
University
of
Brescia
(application
number
NP2753).
In
particular,
all
patients’
personal
information
has
been
anonymized,
and
cannot
be
retrieved
starting
from
the
published
data.
Declaration
of
Competing
Interest
All
authors
declare
that
there
is
no
conflict
of
interest.
Acknowledgments
The
data
were
collected
in
the
context
of
the
study
EC-WAVES,
at
the
University
of
Bres-cia
(Ethical
approval
granted
by
the
ethical
committee
of
ASST
Spedali
Civili
Brescia).
The
data
processing
was
supported
partially
by
European
Union’s
Horizon
2020
research
and
innovation
programme
under
the
Marie
Sklodowska-Curie
grant
agreement
No.
691051
and
the
Ministry
of
Education,
Science
and
Technological
Development
of
Serbia
(
III45010
).
[5] Findgraph, Curve Fitting Software FindGraph. http://www.findgraph.com (accessed 13 February 2020), 2020. [6] R. Firoozabadi , M. Nakagawa , E.D. Helfenbein , S. Babaeizadeh , Predicting defibrillation success in sudden cardiac
arrest patients, J. Electrocardiol. 46 (2013) 473–479 .
[7] M. He , Y. Gong , Y. Li , T. Mauri , F. Fumagalli , M. Bozzola , G. Cesana , R. Latini , A. Pesenti , G. Ristagno , Combining multiple ECG features does not improve prediction of defibrillation outcome compared to single features in a large population of out-of-hospital cardiac arrests, Crit. Care 19 (2015) 425 .
[8] C.G. Brown , R. Dzwonczyk , Signal analysis of the human electrocardiogram during ventricular fibrillation: frequency and amplitude parameters as predictors of successful countershock, Ann. Emerg. Med. 27 (1996) 184–188 . [9] M. Podbregar , M. Kovacic , A. Podbregar-Mars , M. Brezocnik , Predicting defibrillation success by ‘genetic’ program-
ming in patients with out-of-hospital cardiac arrest, Resuscitation 57 (2003) 153–159 .
[10] H.U. Strohmenger , K.H. Lindner , C.G. Brown , Analysis of the ventricular fibrillation ECG signal amplitude and fre- quency parameters as predictors of countershock success in humans, Chest 111 (1997) 584–589 .
[11] H. Endoh , S. Hida , S. Oohasi , Y. Hayashi , H. Kinoshita , T. Honda , Prompt prediction of successful defibrillation from 1-s ventricular fibrillation waveform in patients with out-of- hospital sudden cardiac arrest, J. Anesth. 25 (2011) 34–41 .
[12] Y. Gong , Y. Lu , L. Zhang , H. Zhang , Y. Li ,2015. Predict defibrillation outcome using stepping increment of poincare plot for out- of-hospital ventricular fibrillation cardiac arrest, BioMed. Res. Int (2015) 493472 .
[13] B. Chicote , U. Irusta , R. Alcaraz , J.J. Rieta , E. Aramendi , I. Isasi , D. Alonso , K. Ibarguren , Application of entropy- based features to predict defibrillation outcome in cardiac arrest, Entropy 18 (2016) 313 .