Covariation of the 3’ regulatory region of Ig heavy chain and Gm haplotypes across human continental populations
Journal: American Journal of Physical Anthropology Manuscript ID Draft
Wiley - Manuscript type: Research Article Date Submitted by the
Author: n/a
Complete List of Authors: Frezza, Domenico; Universita di Roma, Tor Vergata, Dipartimento di Biologia
Martinez-Labarga, Cristina; Universita di Roma, Tor Vergata, Dipartimento di Biologia
Giambra, Vincenzo; IRCCS Ospedale Casa Sollievo della Sofferenza Serone, Eliseo; IRCCS Ospedale Casa Sollievo della Sofferenza Scano, Giuseppina; Universita di Roma, Tor Vergata, Dipartimento di Biologia
Rickards, Olga; University of Rome Tor Vergata, Centro di antropologia molecolare per lo studio del DNA antico Dipartimento di Biologia D'Addabbo, Pietro; University of Bari, Biology
Novelletto, Andrea; University of Rome "Tor Vergata", Dept. of Biology Key Words: Ig allotypes, Linkage Disequilibrium, 3'RR1, IGHG3, IGHG1
Subfield: Please select 2 subfields. Select the main subject first.:
Genetics [primate and human], Human biology [living humans; behavior, ecology, physiology, anatomy]
Covariation of the 3’ regulatory region of Ig heavy chain and Gm haplotypes across human continental populations
Domenico Frezza1, Cristina Martinez Labarga1, Vincenzo Giambra2, Eliseo Serone2, Giuseppina
Scano1, Olga Rickards1, Pietro D'Addabbo3, Andrea Novelletto1
1. Dept. of Biology, University of Rome Tor Vergata, Italy
2. Fondazione IRCCS "Casa Sollievo della Sofferenza", San Giovanni Rotondo (FG), Italy 3. Center for Outcomes Research and Clinical Epidemiology, Pescara, Italy
4. Dept. of Biology, University of Bari, Italy
Corresponding author: Cristina Martinez Labarga Department of Biology,
University of Rome Tor Vergata, Via della Ricerca Scientifica, 1 00133 Rome, Italy
Ph. +390672594348 Fax +39062023500
e-mail: [email protected] Running title: HS1.2 and IGH
Keywords: Ig allotypes; LD; 3'RR1; IGHG3; IGHG1; SNPs; 4 5 6 7 8 9 10 11 12 13 14 15 16 17 18 19 20 21 22 23 24 25 26 27 28 29 30 31 32 33 34 35 36 37 38 39 40 41 42 43 44 45 46 47 48 49 50 51 52 53 54 55 56 57 58 59 60
Abstract
Objectives. The 3' Regulatory Region of the human immunoglobulin heavy chain complex
includes the HS1.2 enhancer, which displays length polymorphism, with 4 known alleles. The goal of the research was to provide an overview and interpretation of its variation across human
populations.
Materials and Methods. We compiled published and original data on this polymorphism in 3100
subjects from 26 human populations. Moreover, we imputed the haplotypic arrangement of the HS1.2 region in the 1,000 Genomes project (1KGP). In this dataset a precise imputation could also be obtained for the IGHG1G3 phenotype, by virtue of the precise correspondence between
serological types and amino acid (and DNA) substitutions in IGHG1 and IGHG3.
Results. Allele frequency distributions and extreme population differentiation at HS1.2 covaried
with those reported in the literature for the physically neighbouring IGHG1G3 system. The 1KGP data revealed that Linkage Disequilibrum (LD) can explain the spread of joint HS1.2-IGHG1-IGHG3 associations across continents and within continental populations, with stronger LD out of Africa.
Discussion. Strong population structuring involves at least the entire 70 kb genomic region here
considered, due to the tight LD which has maintained HS1.2, IGHG1 and IGHG3 in non-random arrangements. We then conclude that HS1.2 alleles are evolutionarily stable and, together with IGHG1 and IGHG3 take part in a genomic block which underwent positive natural selection. This might be key to a better understanding of the evolutionary path of the entire genomic region during the formation of continental gene pools, also in terms of susceptibility to autoimmune diseases. 4 5 6 7 8 9 10 11 12 13 14 15 16 17 18 19 20 21 22 23 24 25 26 27 28 29 30 31 32 33 34 35 36 37 38 39 40 41 42 43 44 45 46 47 48 49 50 51 52 53 54 55 56 57 58 59
Introduction
The human Ig heavy-chain complex maps on the chromosomal region 14q32. The interest in the whole locus derives from its involvement in mammalian immune response and human
autoimmune disease (Birshtein 2014).
The locus was subjected to a large tandem duplication in the common ancestor of primates. In humans, the telomeric duplicated member harbours, among others, the active gene units IGHG3, IGHG1 and IGHA1, whereas the centromeric one contains IGHG2, IGHG4, IGHE and IGHA2. All these gene units encode for the heavy-chain constant domains of different Ig classes. A 3'RR (Regulatory Region) is present in each of the duplicated blocks, with the telomeric and centromeric paralogs named 3'RR1 and 3'RR2, respectively [Fig. 1A in (D'Addabbo et al. 2018)]. Despite its relevance in human pathology, there are aspects and details of inter-individual variation in this large region that are still to be fully investigated. In particular, several polymorphisms cannot be easily attributed to a specific copy of the two duplicated blocks, especially those mapping in the highly similar 3`RR copies (D'Addabbo et al. 2011).
In mouse, the syntenic Ig heavy-chain complex maps in 12qF1, and the single-copy 3'RR has been also called 3' enhancer complex or super enhancer (Mills et al. 1997; Le Noir et al. 2017). The 3`RR has been widely studied in this model organism, showing that relevant functions for B cell and Ig maturation are associated with this regulatory region (Pinaud et al. 2001; Pinaud et al. 2005; Dunnick et al. 2009; Volpi et al. 2012). In humans, ChIP-seq data analysis on 86 cell types, has revealed that the 3'RR1 should be considered a B cell-specific super-enhancer (Hnisz et al. 2013). The same study showed that disease-associated SNPs occur in super-enhancers of disease-relevant cells and that this occurs more frequently for super-enhancers than for typical enhancers. Recent evidence for a role of this region in the so-called locus suicide recombination which occurs during B cells maturation has also been provided (Dalloul et al. 2019).
Studies of the 3'RRs polymorphisms in human population and of mouse physiology gave new insights on the regulation of Ig production and B cell maturation (Giambra et al. 2009; Serone et al. 2014; Ghazzaui et al. 2019). Association studies demonstrated increased frequencies of a specific allele of HS1.2, belonging to 3'RR1, in autoimmune disease (Frezza et al. 2004; Tolusso et al. 2009) and of a specific haplotype in psoriasis (D'Addabbo et al. 2018).
The human 3'RR1 harbours 3 enhancers (from centromere to telomere: HS4, HS1.2 and HS3) (Sepulveda et al. 2005). Two elements of a palindromic sequence are located between HS4 and HS1.2 and between HS1.2 and HS3, respectively, in opposite directions [Fig. 1B in (D'Addabbo et 4 5 6 7 8 9 10 11 12 13 14 15 16 17 18 19 20 21 22 23 24 25 26 27 28 29 30 31 32 33 34 35 36 37 38 39 40 41 42 43 44 45 46 47 48 49 50 51 52 53 54 55 56 57 58 59 60
al. 2018)]. Interestingly, this feature is conserved across 8 amniote species, despite considerable divergence in the nucleotide sequence of the palindrome (D'Addabbo et al. 2011) suggesting long term purifying selection for the conservation of the structural properties.
In non-human primate species the length of HS1.2 is not constant, due to Copy Number variation of an internal 40bp element, with up to 12 tandem copies in chimpanzees, 8 in baboons, 6 in macaque, 5 in gibbons, and 4 in orangutan (D'Addabbo et al. 2011). At present, in humans, 4 alleles (HS1.2*1, *2, *3, *4) are known (Giambra et al. 2005; Martínez-Labarga et al. 2007). Recent analyses on sequence polymorphisms in the region delimited by HS1.2 and HS3 showed strong linkage disequilibrium (LD) between SNPs and the main HS1.2 alleles in patients with psoriasis, and putatively in world populations (D'Addabbo et al. 2018). Accordingly, the two main alleles HS1.2*1 and *2 could be potentially tagged by several SNPs, and in particular by a 4-SNP sub-haplotype (rs12896746-rs12896897-rs7144089-rs7143677), located 4.5 kb telomerically from the enhancer.
In this work we compile published and original data on the HS1.2 length polymorphism and the surrounding SNPs in diverse human populations. We find that LD can explain the spread of joint HS1.2-IGHG1-IGHG3 associations across continents and within continental populations, with stronger LD out of Africa. This might be key to a better understanding of the evolutionary path of the entire genomic region during the formation of continental gene pools, in terms of immune response capabilities. In fact, in previous studies this region showed signals of recent positive selection (Palamara et al. 2018). In this context, adaptation to the local environments (Hancock et al. 2011; Iskow et al. 2012) may have been a major driver of divergence. Also, our results may help in the understanding of differences in susceptibility to autoimmune diseases among populations. 4 5 6 7 8 9 10 11 12 13 14 15 16 17 18 19 20 21 22 23 24 25 26 27 28 29 30 31 32 33 34 35 36 37 38 39 40 41 42 43 44 45 46 47 48 49 50 51 52 53 54 55 56 57 58 59
Materials & Methods The subjects.
In this study a total of 3100 unrelated and apparently healthy subjects of both sexes
belonging to 26 different populations, who gave their informed consent, were included. Each donor was asked to supply his/her birthplace, language and ethnicity for three generations, in order to exclude recent admixture.
As far as the proposed research did not involve any issue relevant for the donor's health, only a subset of the WMA Declaration of Helsinki and COE Oviedo Convention prescriptions were applicable and obeyed. For these reasons written consent was requested in most cases but, in some series collected before 1995, oral consent was considered sufficient and simply recorded in the corresponding log sheets (filed at the collecting Institutions). In all cases the consent included also storage and future use of the sample. The usage of the samples for investigations on genetic diversity was approved by the local Ethics Committee (Comitato Etico Policlinico Tor Vergata protocol numbers 88/11, 90/11, 92/11).
In addition to population samples reported previously (Table 1), the following population samples were originally typed: 95 north Africans from Morocco (Baassi et al. 2009) and 110 from Libya (Galgani et al. 2013); 56 Oromo from Asela, Oromia Region, central Ethiopia (Messina et al. 2016); 148 donors from two Ecuadorian communities of African ancestry living in the Esmeraldas province: 100 along Rio Cayapas and 48 in Viche village (Martínez-Labarga et al. 1999; Rickards et al. 2005); 52 samples from China; 179 Ecuadorian Native Americans: 99 Cayapa Indians (Rickards et al. 1999) and 80 Tsáchila Indians (Babalini et al. 2005); 86 individuals from the Ladakh region of northern India; 1204 Europeans [74 individuals from Albania, 100 Spaniards sampled in Vera and Bejar valleys, Sierra de Gredos, central Spain (Varano et al. 2018); 1030 Italians from different geographical regions (S1 Table)], and 203 individuals of European ancestry living in Busselton, Western Australia.
HS1.2 genotyping
Genomic DNA was isolated from whole blood or from mouth swab by standard methods. The allelic analysis of HS1.2 was performed by a double PCR amplification. A first selective PCR genomic DNA generated a 5.4 kb fragment, called IgH3'EC-1 (Giambra et al. 2005). The reaction contained 0.04 units of Taq Polimerase Platinum High Fidelity (Invitrogen, Carlsbad, CA, USA), Platinum High Fidelity buffer 1x (200 mM Tris-HCl, pH8.4, 500 mM KCl), dNTPS 0.2mM, 4 5 6 7 8 9 10 11 12 13 14 15 16 17 18 19 20 21 22 23 24 25 26 27 28 29 30 31 32 33 34 35 36 37 38 39 40 41 42 43 44 45 46 47 48 49 50 51 52 53 54 55 56 57 58 59 60
MgSO4 2.0 mM, 0.4pmol of each primer, and water for final volume of 25 l. The thermal profile
was 94 °C for 2 min, followed by 10 cycles at 94 °C for 30 s, 60 °C for 30 s, 68 °C for 5 min, followed by 20 more cycles at 94 °C for 30 sec, 58 °C for 30 sec, 68 °C for 5 min and one final extension at 72 °C for 10 min. The product of the first PCR was used as template in a second PCR to amplify specifically only one of the homologous enhancers of the duplicated 3'RR regions using primers P3Frw and D3Rev (Giambra et al. 2005). The product of this nested PCR was analysed by gel electrophoresis and the molecular size of the allele determined as described in Giambra et al. (2005).
Sequencing
A different nested PCR with primers SA2.5F (5'-GGATCCCTGTTCCTGATCACTG-3') and P2R3 (5'-TGTGAGAGGGGCTTGCAGCT-3') was used to obtain from IgH3'EC-1 an internal 1.1 kb fragment encompassing positions Chr14:106166847-106167949. The amplification used 1/50 of the volume of the selective PCR, to minimize the genomic DNA carryover, with 0.04 units of Taq Polimerase Platinum (Invitrogen); buffer 1x Platinum; dNTPS 0.2mM; MgSO4 2.0 mM; primers 0.4
pmol, adding water to 25 l. The thermal profile was: 94 °C for 2 min followed by 30 cicles at 94 °C for 30 s, 57 °C for 30 s, 72 °C for 1 min and one final extension at 72 °C for 5 min.
Amplification products were purified using HT ExoSAP-ITVR (Affymetrix), in accordance with the supplier’s protocol. The purified products were sequenced on both strands, using primers SA2.5F and P2R3 by the BigDye Terminator v1.1 Cycle Sequencing kit (Applied Biosystems by Life Technologies, Foster City, CA) following the manufacturer’s protocols, and run on an ABI PRISM 3130 Genetic Analyzer (Applied Biosystems by Life Technologies). Sequences were
visually inspected and reading of the two homologous copies accounted for the 2 bp shift in subjects heterozygotes at rs10556547.
Data analysis
Allele frequencies and departures from Hardy–Weinberg equilibrium were evaluated using Arlequin package software v. 3.5 (Excoffier and Lischer 2010). The apportionment of genetic variation between and within populations was estimated by analysis of molecular variance (AMOVA) using the same program, and assigning the investigated populations to 8 groups
according to their geographical provenance (Sub-Saharan Africa, North Africa, Europe, Near East, India, Central Asia, Northern Asia and South America; Table 1). The statistical significance of F 4 5 6 7 8 9 10 11 12 13 14 15 16 17 18 19 20 21 22 23 24 25 26 27 28 29 30 31 32 33 34 35 36 37 38 39 40 41 42 43 44 45 46 47 48 49 50 51 52 53 54 55 56 57 58 59
values was estimated using 10,000 permutations. Multidimensional scaling (MDS) based on the matrix of pairwise Fst values was performed using STATISTICA package software (StatSoft 1995). 1,000 Genomes Project data analysis
Phased Phase 3 genotypes (The 1000 Genomes Project Consortium 2015) (1KGP) for the genomic region 14:106,100,001-106,300,000 (GRCh37/hg19) were downloaded separately for each of the five ancestry groups (EAS, SAS, AFR, EUR and AMR) in ped/info format. SNP positions with >2 alleles were removed with an R script. LD heat plots were obtained with Haploview (Barrett et al. 2005) by selecting the positions of interest. The 4-gamete rule was used to define LD blocks and the strength of disequilibrium was measured by the D' metrics.
The same ped/info files were combined into a spreadsheet and used to count haplotypes at selected positions in pivot tables for each ancestry group and population within it.
Gm allotypes were imputed using 4 and 3 variable (missense) positions in IGHG1 and IGHG3, respectively, and the published correspondences between amino acid states and allotypes [(Dard et al. 2001), http://www.imgt.org/IMGTrepertoire/]. Imputation was performed only for the 6 Gm haplotypes tabulated in fig 2.10.2 of Cavalli-Sforza et al. (1994) for at least 6 of the 8
continental regions: Europe, North Africa, Sub Saharan Africa, Near East, Central Asia, India, North Asia, South America. Affiliation of our populations with these groupings is as reported in Table 1.
The null hypothesis of no LD between the 4-SNP haplotype predictive of HS1.2 alleles and Gm haplotypes was tested by contingency chi-square (R package STATS) on the 6 imputed
allotypes, with p-values obtained by Monte Carlo simulation (10,000 replicates).
Genomic positions refer to the GRCh37/hg19 assembly and amino acid positions to the IMGT unique system (Lefranc et al. 2005).
4 5 6 7 8 9 10 11 12 13 14 15 16 17 18 19 20 21 22 23 24 25 26 27 28 29 30 31 32 33 34 35 36 37 38 39 40 41 42 43 44 45 46 47 48 49 50 51 52 53 54 55 56 57 58 59 60
Results
HS1.2 length allele frequency distributions
Table 1 reports the allele frequencies for the 26 populations samples (details for Italian subregions in S1 Table). None of the populations departed from the Hardy-Weinberg equilibrium. In the majority of populations allele *1 was the most frequent. Allele *2 reached the highest frequencies among Europeans, followed by Near Easterners, Indians and other Asians. Allele *3 characterized populations of Sub-Saharan African ancestry, decreasing in North Africa and dropping in Europeans. Conversely, allele *4 had the highest frequencies in Sub-Saharan African populations but maintained frequencies of the order of 0.1 in North Africa and Europe.
Heterozygosity was highest in Africa, with 6 out of 9 values above 0.6, and minimal in South America (below 0.45).
The above results denote a remarkable degree of partitioning of HS1.2 alleles across continental population groups, which anticipates large fixation indexes (Table 2). In fact Fct, the index measuring the proportion of genetic variance among the 8 groups (see Materials & Methods) as compared to the total variance, reached 0.117, an unusually high figure for both bi-allele (The 1000 Genomes Project Consortium 2012) and multi-allele markers (Rosenberg et al. 2002). By contrast Fsc, which measures the proportion of genetic variance among population within the 8 groups, accounted for only 0.024.
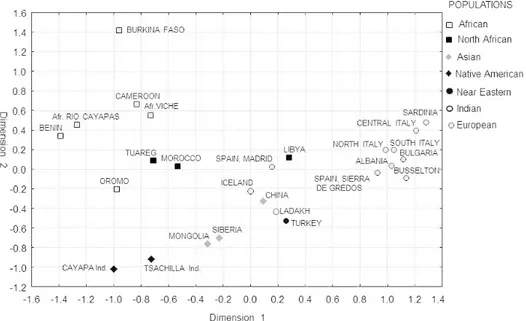
The allele frequency distributions are also predictive of continental ancestry. Figure 1 reports the two-dimensional plot of the MDS analysis based on the matrix of pairwise FST genetic distances
(Stress = 0.0496). The first dimension clearly separates the Europeans (right side of the graph) to the exception of Spaniards and Icelanders, from the rest of populations. The second axis, adds to this distinction, leaving the populations of Sub-Saharan African ancestry on the top-left and the Asians and Southern Americans on the bottom of the plot. The mixed populations from North and Eastern Africa are placed in an intermediate position.
Correlation with IGHG1G3 allotypes
Two competing hypotheses can be put forward concerning the strong population structuring at HS1.2 outlined above. The first is that the repetitive internal structure of HS1.2 is evolutionarily stable over time spans comparable with the human peopling of continents. Thus, the current
structuring simply descends from the structuring in the initial settlers (possibly potentiated by drift), 4 5 6 7 8 9 10 11 12 13 14 15 16 17 18 19 20 21 22 23 24 25 26 27 28 29 30 31 32 33 34 35 36 37 38 39 40 41 42 43 44 45 46 47 48 49 50 51 52 53 54 55 56 57 58 59
without relevant changes in allele states due to recurrent mutations. The main alternative is that the current HS1.2 frequencies are the result of active directional selection, which favours different HS1.2 alleles in each continent irrespective of their stability. Any intermediate situation between these two extremes is viable. Though our data alone do not allow to affirm or exclude natural selection, we could nevertheless indirectly test the evolutionary stability of HS1.2, by examining its association with neighbouring genomic regions. In doing this we reasoned that polymorphic
markers in the IGHG1 and IGHG3 genes (located 75 and 105 kb telomerically from HS1.2, respectively) were long known serologically, producing the so-called G1m-G3m system
(IGHG1G3), for which a wealth of population data have been compiled (Cavalli-Sforza et al. 1994). We then considered 6 IGHG1G3 allotype frequencies tabulated in fig 2.10.2 of Cavalli-Sforza et al. (1994) for at least 6 of the 8 continental regions which could be considered geographical proxies of ours, searching for correlations with HS1.2 allele frequencies (Supplemental Fig. 1). Among the 24 correlations between the two genetic systems, 5 turned out to be significant at nominal p<0.05. In particular HS1.2*1 positively correlated with allotype za;g, both with maxima in Northern Asia and South America (S1 Fig A); HS1.2*3 and *4 positively correlated with allotype za;b, with a maximum in Sub-Saharan Africa (S1 Fig C); HS1.2*2 positively correlated with allotype f;b, with a maximum in Europe (S1 Fig F). The QQplot of the 24 p-values (S1 Fig G). showed a general trend towards non-random covariation of HS1.2 and IGHG1G3 frequencies.
For these 5 statistically significant relationships the IGHG1G3 allotype frequencies (x axis) were larger than HS1.2 frequencies (y axis), indicating that HS1.2 alleles accounted for only a subset of IGHG1G3-bearing haplotypes.
LD between HS1.2 and IGHG1G3 variants in the 1KGP data
In order to work out the arrangement of this genomic region across human populations we considered the robust disequilibrium between 4 SNPs of the 3'RR1 and HS1.2 alleles *1 and *2. In Europeans, alleles *1 and *2 are associated with the alternative sub-haplotypes rs12896746(A)-rs12896897(C)-rs7144089(G)-rs7143677(A) and G-T-C-G, respectively (D'Addabbo et al. 2018). We complemented this information with novel sequencing data from HS1.2 *1/*1, *3/*3 and *4/*4 homozygotes of African ancestry. We found that 5 out of 6 HS1.2*3-bearing chromosomes also carried the A-C-C-G sub-haplotype, whereas the same sub-haplotype was found only in 3/6 and 2/4 *1- and *4-bearing chromosomes. In this search, we found variation at rs10556547, with the -- (CT deletion, this site not included in the 1KGP data) allele tagging the A-C-C-G sub-haplotype.
4 5 6 7 8 9 10 11 12 13 14 15 16 17 18 19 20 21 22 23 24 25 26 27 28 29 30 31 32 33 34 35 36 37 38 39 40 41 42 43 44 45 46 47 48 49 50 51 52 53 54 55 56 57 58 59 60
Conversely, variation at rs7143643, falling within the sub-haplotype, was poorly associated with SNPs on either side.
On the basis of these associations we could infer the physical arrangements of alleles at HS1.2 and IGHG1G3, leveraging the 1KGP data. The rationale for this analysis was that common
occurrence of mutational events changing HS1.2 allele states over evolutionary times is expected to result in an LD maintained only over short genomic distances. Thus, we imputed the haplotypic arrangement of the HS1.2 region in the 1KGP subjects. Moreover, a precise imputation could be obtained for the IGHG1G3 phenotype, by virtue of the precise correspondence between serological types and amino acid (and DNA) substitutions in IGHG1 and IGHG3 [(Lefranc et al. 2005)
http://www.imgt.org/IMGTrepertoire/].
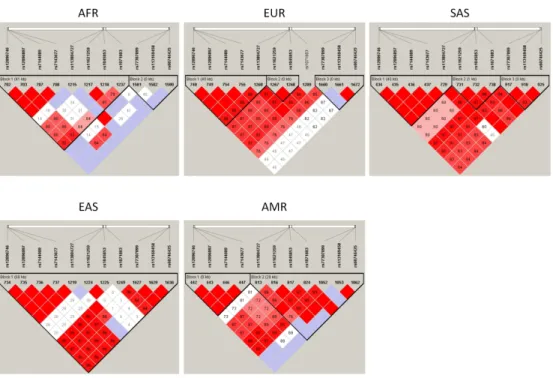
We then generated pairwise LD heat plots (Figure 2) for 11 SNPs, including the four above and 4 and 3 coding SNPs in the IGHG1 and IGHG3 gene units (S2 Table), respectively, which are key determinants of the IGHG1G3 allotypes. The entire region spans 68,903 bp in GRCh37/hg19, and the particular method is insensitive to phasing. The heat plots showed a trend toward increasing LD as one moves farther from Africa. The four 3'RR1 SNPs were in strong LD in all continental groups and invariably fell in a single LD block. LD was lowest within Africa, but still with a single block embracing the 3'RR1 and all IGHG1 SNPs. Outside Africa strong LD extended up to IGHG3, especially in Asians. LD appeared to be broken within IGHG3 in Africans, Europeans and
Americans.
The above result favoured the hypothesis of a common cause for the continental population structuring at both HS1.2 and IGHG1G3, consisting mainly in the physical association between HS1.2 and the sites responsible for allotypic variation. They also pointed to stability of HS1.2 over the evolutionary times relevant for the peopling of continents.
We next wanted to determine the 11-SNP haplotypes over the region on an individual basis, to test more precisely whether they replicated the bivariate associations reported above for the population level. We then imputed six allotypes in the 1KGP data, based on the responsible amino acid substitutions, and cross-tabulated them with the 3'RR1 sub-haplotypes (S3 Table). The frequencies of 3'RR1 sub-haplotypes A-C-C-G, A-C-G-A and G-T-C-G in the 1KGP ancestry groups paralleled those of HS1.2 alleles *3, *1 and *2 of our original data, respectively. Also, the inferred allotype frequencies broadly paralleled those reported for comparable continental groups (Cavalli-Sforza et al. 1994). In all continental groups, allotypes characterized by the IGHG1 za determinant were strongly associated with the sub-haplotype predictive of HS1.2*1, whereas 4 5 6 7 8 9 10 11 12 13 14 15 16 17 18 19 20 21 22 23 24 25 26 27 28 29 30 31 32 33 34 35 36 37 38 39 40 41 42 43 44 45 46 47 48 49 50 51 52 53 54 55 56 57 58 59
allotypes characterized by the IGHG1 f determinant were strongly associated with the
sub-haplotype predictive of HS1.2*2. In Africa, the sub-sub-haplotype predictive of HS1.2*3 was found at high frequencies and associated with the IGHG1G3 za;b imputed allotype (see also S1 Fig C).
The IGHG1G3 f;b allotype, known to peak in Eastern Europe and the Middle East [p. 334-335 in Cavalli-Sforza et al. (1994)], was found to form an imputed compound haplotype *2-f;b predominating in the European and South Asian ancestry groups. Also, the IGHG1G3 za;b allotype, known to peak in Central and Western Sub-Saharan Africa [p. 337 in Cavalli-Sforza et al. (1994)], was found to form a compound haplotype with predicted alleles HS1.2*1 and *3 predominating in Nigerians (ESN) and Gambians (GWD). Finally, the IGHG1G3 za;g allotype, known to peak in North Eastern Asia and the Americas [p. 325 in Cavalli-Sforza et al. (1994)], was found to form an imputed compound haplotype *1-za;g predominating in the Han Chinese (CHS, CHB), Japanese (JPN) and the Peruvians (PEL). The associations between the 2 most frequent 3'RR1
sub-haplotypes and the 6 imputed allotypes were highly significant in all continental groups. In order to exclude that these result were due to spurious LD caused by intra-continental structuring, we repeated the analysis for each population of the 1KGP dataset (n=26). For all populations outside Africa the association between 3'RR1 sub-haplotypes predictive of HS1.2 alleles *1 and *2 and IGHG1G3 haplotypes were highly significant (in all cases p<0.0001). Conversely, within Africa the associations between 3'RR1 sub-haplotypes predictive of HS1.2 alleles *1 and *3 and IGHG1G3 haplotypes were not significant in individual populations, which displayed large variations of frequencies at both systems.
4 5 6 7 8 9 10 11 12 13 14 15 16 17 18 19 20 21 22 23 24 25 26 27 28 29 30 31 32 33 34 35 36 37 38 39 40 41 42 43 44 45 46 47 48 49 50 51 52 53 54 55 56 57 58 59 60
Discussion
Gene-geography of the HS1.2-IGHG1G3 region
We reported allele frequencies at the HS1.2 length polymorphism in 26 populations representing 8 broad continental or subcontinental regions. A higher diversity in Africa and populations of African descent was observed, with at least 3 HS1.2 length alleles at frequencies exceeding 8%. Both alleles HS1.2*3 and *4 occur at higher frequencies in Africa than in other continents, which display a corresponding decrease in heterozygosity.
This arrangement of HS1.2 diversity replicates genome-wide observations (Li et al. 2008) , consistent with a mainly out-of-Africa model of anatomically modern human dispersal,
accompanied by a serial founder effect. This framework would identify the high frequencies of HS1.2*2 in Europe and *1 in Asia and South America as derived features. However, the modular structure of HS1.2 prevents to safely infer the ancestral length allele by comparison with a non-human primate.
By comparing our results with immunoglobulin allotype occurrence in three main ancestry groups (Jefferis and Lefranc 2009), we observed clear patterns of co-variation between the two systems. When correlating our HS1.2 frequencies with IGHG1G3 frequencies compiled for
subcontinental groups (Cavalli-Sforza et al. 1994), we found a clear trend to covary. We then asked more directly whether the preferential occurrence of HS1.2 alleles and IGHG1G3 allotypes in continental human populations has to be considered coincidental or a direct consequence of the physical association of the three elements in approximately 74 kb of 14q, through LD. To this aim, we imputed the HS1.2 and IGHG1G3 status in the 1KGP data (The 1000 Genomes Project
Consortium 2015), considering the missense substitutions in the IGHG1 and IGHG3 gene units responsible for the allotype specificities. We verified that the individual haplotypes over the region replicate the association across populations.
Thus the entire region displays an increase of LD with increasing distance from Africa. This observation, too, is in agreement with the out-of-Africa model (Ramachandran et al. 2005), though in our case a precise measurement of the dependence on geography is complicated by the presence of HS1.2*3 at high frequencies in Africa only.
Population differentiation
We observed a remarkable degree of population differentiation at HS1.2 between continents, higher than other DNA systems, as contrasted with a relatively low intra-continental differentiation 4 5 6 7 8 9 10 11 12 13 14 15 16 17 18 19 20 21 22 23 24 25 26 27 28 29 30 31 32 33 34 35 36 37 38 39 40 41 42 43 44 45 46 47 48 49 50 51 52 53 54 55 56 57 58 59
(Barbujani et al. 1997). In parallel, IGHG1G3 in world populations produced the top Fst values as compared to the expectations for comparable allele frequencies [Table 2.12.1 in Cavalli-Sforza et al. (1994)]. We thus show that population structuring involves the entire genomic region here considered, due to the tight linkage disequilibrium which has maintained HS1.2, IGHG1 and IGHG3 in a limited number of adjacent blocks (Wall and Pritchard 2003).
It has long been realized that loci displaying extremely high population differentiation might be under positive selection (Lewontin and Krakauer 1973; Cavalli-Sforza et al. 1994). We notice that the extreme Fst values reported for the IGHG1G3 system worldwide implicitly favours
directional selection over simple genetic drift (Biswas and Akey 2006), and this is further supported by LD extending to HS1.2. We then conclude that HS1.2 alleles are evolutionarily stable and, together with IGHG1 and IGHG3 take part in a genomic block which underwent positive natural selection.
The particular geographic distributions of HS 1.2 allele and IGHG1G3 allotypes predict covariation with continental climates. In fact, allotype za;b, common in Africa and uncommon elsewhere, turned out to correlate strongly with PC1 of climate variables [Table 2.13.2 in Cavalli-Sforza et al. (1994)], which summarizes mostly maximum temperatures. However, distinguishing between a causal relationship and a coincidental spatial variation remains difficult.
As far as recent selection is concerned, Palamara et al. (2018) analysed the UK Biobank data and identified a region enriched in recent coalescence events in the immunoglobulin complex, which was attributable to positive selection over the past 20,000 years. While this signal is centered telomerically to IGHG3, the resolution of the method is of the order of megabases and may imply that the genomic region here considered is also involved. In fact, Western Europe is where HS1.2*2 and the associated IGHG1G3 allotype f;b have risen to the highest frequencies.
An important regulatory role for HS1.2 with potential selective value has been suggested by the dynamics of immunoglobulin/antibody production in healthy children carriers of different length alleles. A follow-up study of the Ig serum levels (within non-pathologic limits) in healthy children aged 5-8 years indeed showed that in the first 5 years the presence of allele HS1.2*2 is robustly associated with higher levels (Serone et al. 2014).
Furthermore, the genomic region encompassing HS1.2 and IGHG3 overlaps entirely with a slightly larger region (90 kb, chr14:106,150,000-106,240,000) densely populated with a number of variable SNP sites associated to different phenotypes (Buck et al. 2012; Goris et al. 2015; Hawcutt et al. 2018; Sun et al. 2018). In particular, two of them were found to be associated with increased 4 5 6 7 8 9 10 11 12 13 14 15 16 17 18 19 20 21 22 23 24 25 26 27 28 29 30 31 32 33 34 35 36 37 38 39 40 41 42 43 44 45 46 47 48 49 50 51 52 53 54 55 56 57 58 59 60
levels of Ig G in the cerebrospinal fluid as compared to serum, a hallmark of Multiple Sclerosis (Buck et al. 2012). Moreover, an even larger number of SNP behaving as eQTL of plasma proteins, led to the classification of the region as a highly pleiotropic one (Sun et al. 2018).
All the above results were obtained in subjects of mainly if not exclusively European ancestry, and hence refer to a gene pool enriched in HS1.2*2. The strong continental structuring urges their replication in other populations, and predicts that other associations may be found.
Suggestions for long-term evolutionary forces acting on HS1.2 derive from the structural conservation of two head-to-head palindromes. The nucleotide sequence of the palindrome is not conserved among evolutionary distant species, suggesting pressures for the maintenance of two self-matching regions driving a three-dimensional structure despite of the inter-specific divergence at sequence level (D'Addabbo et al. 2011).
Finally, results obtained in the mouse (Giambra et al. 2008; Garot et al. 2016) indicate that the 3'RR exerts its effects a long way upstream (telomerically in humans), up to the variable region-encoding gene units. In particular, "the IgH 3′RR plays a pivotal role in early B-cell receptor expression, germ-line transcription preceding class switch recombination, interactions between targeted switch (S) regions, variable region transcription before somatic hypermutation, and antibody heavy chain production, but the functional ranking of its different elements is still
inaccurate, especially that of its evolutionarily conserved quasi-palindromic structure" (Garot et al. 2016). This certainly imposes a number of constraints far to be understood, yet. This opens the possibility that these important regulatory functions of 3'RRs contributed to drive the frequencies to the divergent figures observed today, not only for the IGH genes, but for a larger and more complex cluster of genes. It is not unlikely the LD and haplotype arrangements here described result from a limited number of functionally efficient solutions.
4 5 6 7 8 9 10 11 12 13 14 15 16 17 18 19 20 21 22 23 24 25 26 27 28 29 30 31 32 33 34 35 36 37 38 39 40 41 42 43 44 45 46 47 48 49 50 51 52 53 54 55 56 57 58 59
Acknowledgements
We thank the following colleagues/collaborators for providing the indicated population samples: Italy: Palermo (A. Orlando); Reggio Emilia (M. Vigotti); Aosta (G. Raimondi, P. Passerin
d’Entreves); Varese (M. Cosentino, M. Cavagna); Udine (B. Tolusso); Pavia (A. Achilli); Reggio Emilia (R. Benevelli, C. Benasse); Brescia (S. Plebani); Bari ( N. Archidiacono, M. Rocchi); Ancona (T. Cacciamani); Massa Carrara (P. Antonelli); L’Aquila (A. Poma); Frosinone (C. d’Amico); Firenze (R. Fani, M. Bazzicalupo); Sardinia (V. Cordeddu); Bulgaria and Morocco (M. Amicosante); Ladakh (P. Steffenoni); China (P. Pelosi); Bengasi, Libya (C. Montesano); Albania (I. A. Rubino); Busselton (P. Price, in collaboration with the Busselton Population Medical Research Institute, Medical School of the University of Perth, Western Australia.).
Research supported by MIUR-PRIN grants n. prot. 2010EL8TXP_001 to O.R. and n. prot. 2012JA4BTY_003 to A.N. 4 5 6 7 8 9 10 11 12 13 14 15 16 17 18 19 20 21 22 23 24 25 26 27 28 29 30 31 32 33 34 35 36 37 38 39 40 41 42 43 44 45 46 47 48 49 50 51 52 53 54 55 56 57 58 59 60
Declaration
The authors declare no competing interest. 4 5 6 7 8 9 10 11 12 13 14 15 16 17 18 19 20 21 22 23 24 25 26 27 28 29 30 31 32 33 34 35 36 37 38 39 40 41 42 43 44 45 46 47 48 49 50 51 52 53 54 55 56 57 58 59
References
Baassi, L., Sadki, K., Seghrouchni, F., Contini, S., Cherki, W., Nagelkerke, N., Benjouad, A., Saltini, C., Colizzi, V., El Aouad, R. et al. . (2009). Evaluation of a multi-antigen test based on B-cell epitope peptides for the serodiagnosis of pulmonary tuberculosis. Intl J Tuberc Lung Dis, 13, 848-854.
Babalini, C., Tarsi, T., Martínez-Labarga, C., Scano, G., Pepe, G., De Stefano, G. F., & Rickards, O. (2005). COL1A2 (Type 1 Collagen) polymorphism in the Colorado Indians of Ecuador. Ann Hum Biol, 32, 666-678. doi: 10.1080/03014460500175355
Barbujani, G., Magagni, A., Minch, E., & Cavalli-Sforza, L. L. (1997). An apportionment of human DNA diversity. Proc Natl Acad Sci USA, 94, 4516-4519.
Barrett, J. C., Fry, B., Maller, J., & Daly, M. J. (2005). Haploview: analysis and visualization of LD and haplotype maps. Bioinformatics, 21, 263-265. doi: 10.1093/bioinformatics/bth457
Birshtein, B. K. (2014). Epigenetic regulation of individual modules of the immunoglobulin heavy chain locus 3' Regulatory Region. Front Immunology, 5, 163-163. doi:
10.3389/fimmu.2014.00163
Biswas, S., & Akey, J. M. (2006). Genomic insights into positive selection. Trends Genet, 22, 437-446. doi: 10.1016/j.tig.2006.06.005
Buck, D., Albrecht, E., Aslam, M., Goris, A., Hauenstein, N., Jochim, A., International Multiple Sclerosis Genetics Consortium, Wellcome Trust Case Control Consortium, Cepok, S., Grummel, V. et al. . (2012). Genetic variants in the immunoglobulin heavy chain locus are associated with the IgG index in multiple sclerosis. Ann Neurol, 73, 86-94. doi:
10.1002/ana.23749
Cavalli-Sforza, L. L., Menozzi, P., & Piazza, A. (1994). The history and geography of human genes. Princeton, N.J.: Princeton University Press.
D'Addabbo, P., Scascitelli, M., Giambra, V., Rocchi, M., & Frezza, D. (2011). Position and sequence conservation in Amniota of polymorphic enhancer HS1.2 within the palindrome of IgH 3'Regulatory Region. BMC Evol Biol, 11, 71. doi: 10.1186/1471-2148-11-71
D'Addabbo, P., Serone, E., Esposito, M., Vaccari, G., Gargioli, C., Frezza, D., & Bianchi, L. (2018). Association between Psoriasis and haplotypes of the IgH 3' Regulatory Region 1. Gene, 669, 47-51. doi: 10.1016/j.gene.2018.05.090
Dalloul, I., Boyer, F., Dalloul, Z., Pignarre, A., Caron, G., Fest, T., Chatonnet, F., Delaloy, C., Durandy, A., Jeannet, R. et al. . (2019). Locus suicide recombination actively occurs on the functionally rearranged IgH allele in B-cells from inflamed human lymphoid tissues. PLoS Genet, 15, e1007721-e1007721. doi: 10.1371/journal.pgen.1007721
Dard, P., Lefranc, M.-P., Osipova, L., & Sanchez-Mazas, A. (2001). DNA sequence variability of IGHG3 alleles associated to the main G3m haplotypes in human populations. Eur J Hum 4 5 6 7 8 9 10 11 12 13 14 15 16 17 18 19 20 21 22 23 24 25 26 27 28 29 30 31 32 33 34 35 36 37 38 39 40 41 42 43 44 45 46 47 48 49 50 51 52 53 54 55 56 57 58 59 60
Genet, 9, 765. doi: 10.1038/sj.ejhg.5200700
Dunnick, W. A., Collins, J. T., Shi, J., Westfield, G., Fontaine, C., Hakimpour, P., & Papavasiliou, F. N. (2009). Switch recombination and somatic hypermutation are controlled by the heavy chain 3' enhancer region. J Exp Med, 206, 2613-2623. doi: 10.1084/jem.20091280
Excoffier, L., & Lischer, H. E. (2010). Arlequin suite ver 3.5: a new series of programs to perform population genetics analyses under Linux and Windows. Mol Ecol Resour, 10, 564-567. doi: 10.1111/j.1755-0998.2010.02847.x
Frezza, D., Giambra, V., Cianci, R., Fruscalzo, A., Giufrè, M., Cammarota, G., Martìnez-Labarga, C., Rickards, O., Scibilia, G., Sferlazzas, C. et al. . (2004). Increased frequency of the immunoglobulin enhancer HS1,2 allele 2 in coeliac disease. Scand J Gastroenterology, 39, 1083-1087. doi: 10.1080/00365520410007999
Galgani, A., Mancino, G., Martínez-Labarga, C., Cicconi, R., Mattei, M., Amicosante, M.,
Bonanno, C. T., Di Sano, C., Gimil, G. S., Salerno, A. et al. . (2013). HLA-A, -B and -DRB1 allele frequencies in Cyrenaica population (Libya) and genetic relationships with other populations. Human immunology, 74, 52-59. doi:
https://doi.org/10.1016/j.humimm.2012.10.001
Garot, A., Marquet, M., Saintamand, A., Bender, S., Le Noir, S., Rouaud, P., Carrion, C., Oruc, Z., Bébin, A.-G., Moreau, J. et al. . (2016). Sequential activation and distinct functions for distal and proximal modules within the IgH 3' regulatory region. Proceedings of the National Academy of Sciences of the United States of America, 113, 1618-1623. doi:
10.1073/pnas.1514090113
Ghazzaui, N., Issaoui, H., Boyer, F., Martin, O. A., Saintamand, A., & Denizot, Y. (2019). 3′RR and 5′Eμ immunoglobulin heavy chain enhancers are independent engines of locus
remodeling. Cell Mol Immunol, 16, 198-200. doi: 10.1038/s41423-018-0171-3
Giambra, V., Cianci, R., Lolli, S., Mattioli, C., Tampella, G., Cattalini, M., Kilic, S. S., Pandolfi, F., Plebani, A., & Frezza, D. (2009). Allele *1 of HS1.2 enhancer associates with selective IgA deficiency and IgM concentration. Journal of immunology, 183, 8280-8285. doi:
10.4049/jimmunol.0902426
Giambra, V., Fruscalzo, A., Giufre', M., Martinez-Labarga, C., Favaro, M., Rocchi, M., & Frezza, D. (2005). Evolution of human IgH3'EC duplicated structures: both enhancers HS1,2 are polymorphic with variation of transcription factor's consensus sites. Gene, 346, 105-114. doi: 10.1016/j.gene.2004.10.009
Giambra, V., Volpi, S., Emelyanov, A. V., Pflugh, D., Bothwell, A. L. M., Norio, P., Fan, Y., Ju, Z., Skoultchi, A. I., Hardy, R. R. et al. . (2008). Pax5 and linker histone H1 coordinate DNA methylation and histone modifications in the 3′ regulatory region of the immunoglobulin heavy chain locus. Mol Cell Biol, 28, 6123. doi: 10.1128/MCB.00233-08
Goris, A., Pauwels, I., Gustavsen, M. W., van Son, B., Hilven, K., Bos, S. D., Celius, E. G., Berg-4 5 6 7 8 9 10 11 12 13 14 15 16 17 18 19 20 21 22 23 24 25 26 27 28 29 30 31 32 33 34 35 36 37 38 39 40 41 42 43 44 45 46 47 48 49 50 51 52 53 54 55 56 57 58 59
Hansen, P., Aarseth, J., Myhr, K.-M. et al. . (2015). Genetic variants are major determinants of CSF antibody levels in multiple sclerosis. Brain, 138, 632-643. doi: 10.1093/brain/awu405 Hancock, A. M., Witonsky, D. B., Alkorta-Aranburu, G., Beall, C. M., Gebremedhin, A., Sukernik,
R., Utermann, G., Pritchard, J. K., Coop, G., & Di Rienzo, A. (2011). Adaptations to climate-mediated selective pressures in humans. PLoS Genet, 7, e1001375. doi:
10.1371/journal.pgen.1001375
Hawcutt, D. B., Francis, B., Carr, D. F., Jorgensen, A. L., Yin, P., Wallin, N., O'Hara, N., Zhang, E. J., Bloch, K. M., Ganguli, A. et al. . (2018). Susceptibility to corticosteroid-induced adrenal suppression: a genome-wide association study. Lancet Respir Med, 6, 442-450. doi:
10.1016/S2213-2600(18)30058-4
Hnisz, D., Abraham, Brian J., Lee, Tong I., Lau, A., Saint-André, V., Sigova, Alla A., Hoke, Heather A., & Young, Richard A. (2013). Super-Enhancers in the control of cell identity and disease. Cell, 155, 934-947. doi: 10.1016/j.cell.2013.09.053
Iskow, R. C., Gokcumen, O., & Lee, C. (2012). Exploring the role of copy number variants in human adaptation. Trends Genet, 28, 245-257. doi: 10.1016/j.tig.2012.03.002
Jefferis, R., & Lefranc, M.-P. (2009). Human immunoglobulin allotypes. MAbs, 1, 332-338. doi: 10.4161/mabs.1.4.9122
Le Noir, S., Boyer, F., Lecardeur, S., Brousse, M., Oruc, Z., Cook-Moreau, J., Denizot, Y., & Cogné, M. (2017). Functional anatomy of the immunoglobulin heavy chain 3΄ super-enhancer needs not only core enhancer elements but also their unique DNA context. Nucl Acids Res, 45, 5829-5837. doi: 10.1093/nar/gkx203
Lefranc, M.-P., Pommié, C., Kaas, Q., Duprat, E., Bosc, N., Guiraudou, D., Jean, C., Ruiz, M., Da Piédade, I., Rouard, M. et al. . (2005). IMGT unique numbering for immunoglobulin and T cell receptor constant domains and Ig superfamily C-like domains. Dev Comp Immunol, 29, 185-203. doi: 10.1016/j.dci.2004.07.003
Lewontin, R. C., & Krakauer, J. (1973). Distribution of gene frequency as a test of the theory of the selective neutrality of polymorphisms. Genetics, 74, 175.
Li, J. Z., Absher, D. M., Tang, H., Southwick, A. M., Casto, A. M., Ramachandran, S., Cann, H. M., Barsh, G. S., Feldman, M., Cavalli-Sforza, L. L. et al. . (2008). Worldwide human relationships inferred from genome-wide patterns of variation. Science, 319, 1100-1104. doi: 10.1126/science.1153717
Martínez-Labarga, C., Lelli, R., Tarsi, T., Babalini, C., De Angelis, F., Ottoni, C., Giambra, V., Pepe, G., Azzebi, E., Frezza, D. et al. . (2007). Polymorphisms of the COL1A2, CYP1A1 and HS1,2 Ig enhancer genes in the Tuaregs from Libya. Ann Hum Biol, 34, 425-436. doi:
10.1080/03014460701362356
Martínez-Labarga, C., Rickards, O., Scacchi, R., Corbo, R. M., Biondi, G., Peña, J. A., Varas De Vieira, C., Guevara, A. E. B., Mesa Santurino, M. S., & De Stefano, G. F. (1999). Genetic 4 5 6 7 8 9 10 11 12 13 14 15 16 17 18 19 20 21 22 23 24 25 26 27 28 29 30 31 32 33 34 35 36 37 38 39 40 41 42 43 44 45 46 47 48 49 50 51 52 53 54 55 56 57 58 59 60
population structure of two African-American communities of Esmeraldas (Ecuador). Am J Phys Anthrop, 109, 159-174. doi: 10.1002/(SICI)1096-8644(199906)109:2<159::AID-AJPA2>3.0.CO;2-4
Messina, F., Scano, G., Contini, I., Martìnez-Labarga, C., De Stefano, G. F., & Rickards, O. (2016). Linking between genetic structure and geographical distance: Study of the maternal gene pool in the Ethiopian population. Ann Hum Biol, 44, 53-69. doi: 10.3109/03014460.2016.1155646 Mills, F. C., Harindranath, N., Mitchell, M., & Max, E. E. (1997). Enhancer complexes located
downstream of both human immunoglobulin Calpha genes. J Exp Med, 186, 845-858. Palamara, P. F., Terhorst, J., Song, Y. S., & Price, A. L. (2018). High-throughput inference of
pairwise coalescence times identifies signals of selection and enriched disease heritability. Nat Genet, 50, 1311-1317. doi: 10.1038/s41588-018-0177-x
Pinaud, E., Aupetit, C., Chauveau, C., & Cogné, M. (2005). Identification of a homolog of the Cα3′/hs3 enhancer and of an allelic variant of the 3′IgH/hs1,2 enhancer downstream the human immunoglobulin α1 gene. Eur J Immunol, 27, 2981-2985. doi:
10.1002/eji.1830271134
Pinaud, E., Khamlichi, A. A., Le Morvan, C., Drouet, M., Nalesso, V., Le Bert, M., & Cogné, M. (2001). Localization of the 3′ IgH locus elements that effect long-distance regulation of class switch recombination. Immunity, 15, 187-199. doi:
https://doi.org/10.1016/S1074-7613(01)00181-9
Ramachandran, S., Deshpande, O., Roseman, C. C., Rosenberg, N. A., Feldman, M. W., & Cavalli-Sforza, L. L. (2005). Support from the relationship of genetic and geographic distance in human populations for a serial founder effect originating in Africa. Proc Natl Acad Sci USA, 102, 15942-15947. doi: 10.1073/pnas.0507611102
Rickards, O., Martínez-Labarga, C., Lum, J. K., De Stefano, G. F., & Cann, R. L. (1999). Mitochondrial DNA history of the Cayapa Amerinds of Ecuador: detection of additional founding lineages for the native American populations. Am J Hum Genet, 65, 519-530. doi: 10.1086/302513
Rickards, O., Martínez-Labarga, C., Trucchi, E., Renzi, F., Casalotti, R., Babalini, C., Biondi, G., Pepe, G., & De Stefano, G. F. (2005). Restriction fragment length polymorphisms of the type I collagen locus 2 (COL1A2) in two communities of African ancestry and other mixed populations of northwestern Ecuador. Human biology, 77, 115-123.
Rosenberg, N. A., Pritchard, J. K., Weber, J. L., Cann, H. M., Kidd, K. K., Zhivotovsky, L. A., & Feldman, M. W. (2002). Genetic structure of human populations. Science, 298, 2381-2385. doi: 10.1126/science.1078311
Sepulveda, M. A., Garrett, F. E., Price-Whelan, A., & Birshtein, B. K. (2005). Comparative analysis of human and mouse 3' Igh regulatory regions identifies distinctive structural features. Mol Immunol, 42, 605-615. doi: 10.1016/j.molimm.2004.09.006
4 5 6 7 8 9 10 11 12 13 14 15 16 17 18 19 20 21 22 23 24 25 26 27 28 29 30 31 32 33 34 35 36 37 38 39 40 41 42 43 44 45 46 47 48 49 50 51 52 53 54 55 56 57 58 59
Serone, E., Daleno, C., Principi, N., Porretti, L., Iacoacci, V., Gargioli, C., Magrini, A., Massoud, R., D'Addabbo, P., Cattalini, M. et al. . (2014). The change in Ig regulation from children to adults disconnects the correlation with the 3'RR hs1.2 polymorphism. BMC Immunol, 15, 45-45. doi: 10.1186/s12865-014-0045-0
StatSoft. (1995). STATISTICA for windows. StatSoft Inc.
Sun, B. B., Maranville, J. C., Peters, J. E., Stacey, D., Staley, J. R., Blackshaw, J., Burgess, S., Jiang, T., Paige, E., Surendran, P. et al. . (2018). Genomic atlas of the human plasma proteome. Nature, 558, 73-79. doi: 10.1038/s41586-018-0175-2
The 1000 Genomes Project Consortium. (2012). An integrated map of genetic variation from 1,092 human genomes. Nature, 491, 56-65. doi: 10.1038/nature11632
The 1000 Genomes Project Consortium. (2015). A global reference for human genetic variation. Nature, 526, 68-74. doi: 10.1038/nature15393
Tolusso, B., Frezza, D., Mattioli, C., Fedele, A. L., Bosello, S., Faustini, F., Peluso, G., Giambra, V., Pietrapertosa, D., Morelli, A. et al. . (2009). Allele *2 of the HS1,2A enhancer of the Ig regulatory region associates with rheumatoid arthritis. Annals of the rheumatic diseases, 68, 416-419. doi: 10.1136/ard.2008.095414
Varano, S., Gaspari, L., De Angelis, F., Scano, G., Contini, I., Martínez-Labarga, C., & Rickards, O. (2018). Mitochondrial characterisation of two Spanish populations from the Vera and Bejar valleys (Central Spain). Ann Hum Biol, 17, 1-24. doi: 10.1080/03014460.2018.1559355 Volpi, S. A., Verma-Gaur, J., Hassan, R., Ju, Z., Roa, S., Chatterjee, S., Werling, U., Hou, H., Will,
B., Steidl, U. et al. . (2012). Germline deletion of Igh 3′ regulatory region elements hs 5, 6, 7 (hs5–7) affects B Cell-specific regulation, rearrangement, and insulation of the Igh locus. Journal of immunology, 188, 2556. doi: 10.4049/jimmunol.1102763
Wall, J. D., & Pritchard, J. K. (2003). Haplotype blocks and linkage disequilibrium in the human genome. Nat Rev Genet, 4, 587. doi: 10.1038/nrg1123
4 5 6 7 8 9 10 11 12 13 14 15 16 17 18 19 20 21 22 23 24 25 26 27 28 29 30 31 32 33 34 35 36 37 38 39 40 41 42 43 44 45 46 47 48 49 50 51 52 53 54 55 56 57 58 59 60
Legends to figures
Figure 1. MDS plot of the 26 population samples based on the pairwise FST matrix.
Figure 2. Heat maps of pairwise linkage disequilibrium (D'/LOD) among 11 SNPs in the region spanning HS1.2 to IGHG3, in the 5 main ancestry groups of the 1KGP. The top bar displays SNP positions proportionally to their physical distance. From left to right (centromere-to-telomere) the three groups correspond to 3'RR1, IGHG1 and IGHG3, respectively (see S2 Table). Colour scheme: D'<1,LOD<2 - white; D'<1,LOD2 - shades of pink/red; D'=1,LOD<2 - light violet; D'=1,LOD2 - bright red.
Supporting Fig. 1. Linear correlations (and p values) between HS1.2 allele frequencies (top to bottom in each panel) and frequencies of 6 IGHG1G3 allotypes
(A=za;g/B=zax;g/C=za;b/D=za;bst/E=fa;b/F=f;b) reported in Fig 2.10.2 of Cavalli-Sforza et al. (1994) for continental regions (Europe=EUR; North Africa=NAF; Sub-Saharan Africa=SSA; Near East=NEA; Central Asia=CAS; India=SAS; North Asia=NAS; South America=SAM) and QQplot of the 24 p-values (panel G). Some labels are omitted for clarity.
4 5 6 7 8 9 10 11 12 13 14 15 16 17 18 19 20 21 22 23 24 25 26 27 28 29 30 31 32 33 34 35 36 37 38 39 40 41 42 43 44 45 46 47 48 49 50 51 52 53 54 55 56 57 58 59
HS1.2 allele Ref. Population sample Population ancestry Sample
size (n. of subjects)
*1 *2 *3 *4 H
Burkina Faso Sub-Saharan Africa 101 0.322 0.050 0.416 0.213 0.68 Giambra et al. (2006)
Benin Sub-Saharan Africa 100 0.590 0.000 0.245 0.165 0.57 Giambra et al. (2006)
Cameroon Sub-Saharan Africa 86 0.442 0.087 0.250 0.221 0.69 Giambra et al. (2006)
Oromo (Ethiopia) Sub-Saharan Africa 56 0.563 0.116 0.018 0.304 0.58 This work
African Ecuadorian, Viche Sub-Saharan Africa 48 0.458 0.125 0.260 0.156 0.69 This work African Ecuadorian, Rio Cayapas Sub-Saharan Africa 100 0.565 0.050 0.300 0.085 0.58 This work
POOL Sub-Saharan Africa 491 0.488 0.061 0.268 0.183
Morocco North Africa 95 0.532 0.184 0.116 0.168 0.65 This work
Tuareg (Libya) North Africa 117 0.534 0.137 0.124 0.205 0.64 Martinez-Labarga et al. (2007)
Libya North Africa 110 0.427 0.373 0.068 0.132 0.66 This work
POOL North Africa 322 0.497 0.231 0.102 0.169
Iceland Europe 96 0.536 0.307 0.036 0.120 0.61 Giambra et al. (2006)
Bulgaria Europe 95 0.363 0.558 0.016 0.063 0.56 Giambra et al. (2006)
Albania Europe 74 0.378 0.541 0.007 0.074 0.56 This work
North Italy Europe 523 0.350 0.531 0.033 0.086 0.59 This work
Central Italy Europe 255 0.292 0.573 0.004 0.131 0.57 This work
South Italy Europe 192 0.359 0.534 0.008 0.099 0.58 This work
Sardinia Europe 60 0.267 0.592 0.017 0.125 0.57 This work
Madrid (Spain) Europe 104 0.457 0.346 0.058 0.139 0.65 Giambra et al. (2006)
Sierra de Gredos (Spain) Europe 100 0.410 0.515 0.020 0.055 0.57 This work
Busselton (Australia) Europe 203 0.392 0.562 0.007 0.039 0.53 This work
POOL Europe 1702 0.367 0.520 0.021 0.092
Turkey Near East 103 0.563 0.383 0.024 0.029 0.54 Giambra et al. (2006)
Ladakh India 86 0.558 0.366 0.012 0.064 0.55 This work
Mongolia Central Asia 95 0.658 0.263 0.016 0.063 0.50 Giambra et al. (2006)
China Central Asia 52 0.548 0.346 0.010 0.096 0.58 This work
POOL Central Asia 147 0.619 0.293 0.014 0.075
Siberia Northern Asia 70 0.650 0.279 0.014 0.057 0.50 Giambra et al. (2006)
Cayapa Indians (Ecuador) South America 99 0.763 0.131 0.061 0.045 0.40 This work Tsachilla Indians (Ecuador) South America 80 0.725 0.181 0.050 0.044 0.44 This work
POOL South America 179 0.746 0.154 0.056 0.045
John Wiley & Sons, Inc.
4 5 6 7 8 9 10 11 12 13 14 15 16 17 18 19 20 21 22 23 24 25 26 27 28 29 30 31 32 33 34 35 36 37 38 39 40 41 42 43 44 45 46 47 48 49 50 51 52 53 54 55 56
Table 2. Analysis of Molecular Variance based on HS1.2 allele frequencies Source of
variation d.f. Variancecomponents Percentageof variation Among groups 7 0.039 11.66 Among populations within groups 18 0.007 2.13 Within populations 6174 0.289 86.21 Total 6199 0.335 Fixation Indices FSC : 0.02410, p<.001 FST : 0.13791, p<.001 FCT : 0.11662, p<.001 4 5 6 7 8 9 10 11 12 13 14 15 16 17 18 19 20 21 22 23 24 25 26 27 28 29 30 31 32 33 34 35 36 37 38 39 40 41 42 43 44 45 46 47 48 49 50 51 52 53 54 55 56 57 58 59
Figure 1. MDS plot of the 26 population samples based on the pairwise FST matrix. 254x190mm (96 x 96 DPI) 4 5 6 7 8 9 10 11 12 13 14 15 16 17 18 19 20 21 22 23 24 25 26 27 28 29 30 31 32 33 34 35 36 37 38 39 40 41 42 43 44 45 46 47 48 49 50 51 52 53 54 55 56
Figure 2. Heat maps of pairwise linkage disequilibrium (D'/LOD) among 11 SNPs in the region spanning HS1.2 to IGHG3, in the 5 main ancestry groups of the 1KGP. The top bar displays SNP positions proportionally to their physical distance. From left to right (centromere-to-telomere) the three groups correspond to 3'RR1, IGHG1 and IGHG3, respectively (see S2 Table). Colour scheme: D'<1,LOD<2 - white;
D'<1,LOD2 - shades of pink/red; D'=1,LOD<2 - light violet; D'=1,LOD2 - bright red. 274x190mm (284 x 284 DPI) 4 5 6 7 8 9 10 11 12 13 14 15 16 17 18 19 20 21 22 23 24 25 26 27 28 29 30 31 32 33 34 35 36 37 38 39 40 41 42 43 44 45 46 47 48 49 50 51 52 53 54 55