R E S E A R C H
Open Access
Prognostic or predictive value of circulating
cytokines and angiogenic factors for initial
treatment of multiple myeloma in the
GIMEMA MM0305 randomized controlled
trial
Ilaria Saltarella
1, Fortunato Morabito
2,3, Nicola Giuliani
4, Carolina Terragna
5, Paola Omedè
6, Antonio Palumbo
6,
Sara Bringhen
6, Lorenzo De Paoli
7, Enrica Martino
8, Alessandra Larocca
6, Massimo Offidani
9, Francesca Patriarca
10,
Chiara Nozzoli
11, Tommasina Guglielmelli
12, Giulia Benevolo
13, Vincenzo Callea
14, Luca Baldini
15, Mariella Grasso
16,
Giovanna Leonardi
17, Manuela Rizzo
18, Antonietta Pia Falcone
19, Daniela Gottardi
20, Vittorio Montefusco
21,
Pellegrino Musto
22, Maria Teresa Petrucci
23, Franco Dammacco
1, Mario Boccadoro
6, Angelo Vacca
1and
Roberto Ria
1,24*Abstract
Background: Several new drugs are approved for treatment of patients with multiple myeloma (MM), but no validated biomarkers are available for the prediction of a clinical outcome. We aimed to establish whether pretreatment blood and bone marrow plasma concentrations of major cytokines and angiogenic factors (CAFs) of patients from a phase 3 trial of a MM treatment could have a prognostic and predictive value in terms of response to therapy and progression-free and overall survival and whether these patients could be stratified for their prognosis.
Methods: Blood and bone marrow plasma levels of Ang-2, FGF-2, HGF, VEGF, PDGF-β, IL-8, TNF-α, TIMP-1, and TIMP-2 were determined at diagnosis in MM patients enrolled in the GIMEMA MM0305 randomized controlled trial by an enzyme-linked immunosorbent assay (ELISA). These levels were correlated both reciprocally and with the type of therapy and patients’ characteristics and with a group of non-MM patients as controls.
Results: No significant differences were detected between the blood and bone marrow plasma levels of angiogenic cytokines. A cutoff for each CAF was established. The therapeutic response of patients with blood plasma levels of CAFs lower than the cutoff was better than the response of those with higher levels in terms of percentage of responding patients and quality of response.
(Continued on next page)
* Correspondence:[email protected]
1Department of Biomedical Science and Human Oncology, University of Bari
“Aldo Moro” Medical School, Bari, Italy
24Internal Medicine“G. Baccelli”, Myeloma Unit, University of Bari “Aldo Moro”
Medical School, Azienda Ospedaliero-Universitaria Policlinico, Piazza Giulio Cesare 11, 70124 Bari, Italy
Full list of author information is available at the end of the article
© The Author(s). 2019 Open Access This article is distributed under the terms of the Creative Commons Attribution 4.0 International License (http://creativecommons.org/licenses/by/4.0/), which permits unrestricted use, distribution, and reproduction in any medium, provided you give appropriate credit to the original author(s) and the source, provide a link to the Creative Commons license, and indicate if changes were made. The Creative Commons Public Domain Dedication waiver (http://creativecommons.org/publicdomain/zero/1.0/) applies to the data made available in this article, unless otherwise stated.
(Continued from previous page)
Conclusion: FGF-2, HGF, VEGF, and PDGF-β plasma levels at diagnosis have predictive significance for response to treatment. The stratification of patients based on the levels of CAFs at diagnosis and their variations after therapy is useful to characterize different risk groups concerning outcome and response to therapy.
Trial registration: Clinical trial information can be found at the following link:NCT01063179
Keywords: Angiogenic factors, Multiple myeloma, Overall survival, Progression-free survival, Response rate,
Background
Multiple myeloma (MM) is the second most common hematologic cancer after non-Hodgkin’s lymphoma, with a higher incidence in the elderly. Patients older than 70 years account for 56% of new cases and for 73% of all
deaths from MM [1]. Combined melphalan-prednisone
has been the standard of care for more than 40 years and has been found to be associated with a median sur-vival of 29 to 37 months [2–4]. Today, the availability of novel agents, such as the first-class proteasome in-hibitor bortezomib and the immunomodulatory drugs thalidomide and lenalidomide, has significantly im-proved the clinical outcome of these patients [5–13].
Accurate identification of high-risk patients and risk stratification are crucial in improving outcomes for MM patients, but considerable heterogeneity exists in their overall survival. Although a large number of prognostic markers have been described, including disease burden (Durie-Salmon staging system, International Staging Sys-tem, magnetic resonance imaging,
(18F)fluorodeoxyglu-cose positron emission tomography, presence of
extramedullary disease or plasma-cell leukemia), host factors (age, performance status, and renal function), tumor biology (proliferation rate, conventional cytogen-etics, interphase fluorescence in situ hybridization, and gene expression profiling), and depth of response to therapy [14–18], none of them completely explains the heterogeneity seen in this tumor.
To further complicate matters, some of the new treat-ments appear to overcome the high risk defined by one or more of these prognostic factors [19, 20]. With the increased treatment options, the ability of some treat-ments to overcome certain risk factors, and the availabil-ity of markers to define risk categories, risk stratification in the management of MM is becoming an important issue [21]. The achievement of a uniform risk stratifica-tion system would also allow a better comparison of pa-tient groups across different trials [22].
Angiogenesis is a constant hallmark of MM progres-sion and has prognostic potential. The pathophysiology of MM-induced angiogenesis involves both direct pro-duction of angiogenic cytokines by plasma cells and their induction within the bone marrow microenvironment [23]. Moreover, inhibitors of the vascular endothelial growth factor (VEGF) pathway, including bevacizumab
and tyrosine kinase inhibitors such as sorafenib, suniti-nib, and pazopasuniti-nib, have been shown to prolong progression-free survival (PFS) and overall survival (OS) [24–28] and are in fact approved for the treatment of solid cancer.
It has been previously demonstrated that the plasma levels of cytokines and angiogenic factors (CAFs) de-crease after therapy in patients with cancer, and this may be relevant for treatment response and PFS [29–32]. Here, we demonstrate that high levels of CAFs are nega-tive prognostic factors in patients with MM and seem to be predictive of relative benefit from therapy. Moreover, the stratification of patients based on CAF levels at diag-nosis is useful to detect different risk groups for out-come and response to therapy.
Methods
Patients
Patient characteristics are reported in Table 1. This study has been carried out on MM patients enrolled in the multicenter clinical trial GIMEMA-MM0305, with the participation of 61 centers in Italy from May 2006 to January 2009. The study compared the combination bortezomib-melphalan-prednisone-thalidomide followed
by maintenance with bortezomib-thalidomide
(VMPT-VT) with bortezomib-melphalan-prednisone
(VMP) administered for nine cycles without mainten-ance. The details and results of the trial have been pub-lished previously [33–35]. Clinical protocol and informed consent documents were approved by the par-ticipating local institution’s review boards, and the trial was undertaken in accordance with the International Conference on Harmonization Guidelines for Good Clinical Practice and the amended Declaration of Helsinki. Patients without MM or other tumors (patients with stage I arterial hypertension without organ damage and without other diseases) who gave their consent were used as controls.
Methods
Before starting the treatment, peripheral blood and bone marrow plasma (the initial 1 ml of bone marrow aspir-ate) samples were collected into EDTA-containing tubes. Both blood and bone marrow plasma samples from 124 of 511 patients enrolled in the study (24%) were available
for analysis. Plasma was separated by centrifugation (2,000 rpm for 20 min at 4 °C) within 1 h from blood drawing and aliquoted into multiple cryovials. Plasma samples were stored at− 80 °C until use. Before analysis, plasma samples were thawed slowly in an ice bath and all analyses were done from a one-off thaw sample. CAFs were measured by using Q-Plex™ Array Human Angiogenesis Antigen (Quansys Biosciences, Logan, Utah) allowing the simultaneous quantification of the following factors: angiopoietin-2 (ANG-2), fibroblast growth factor-2 (FGF-2), hepatocyte growth factor (HGF), interleukin-8 (IL-8), platelet-derived growth
factor-BB (PDGF-BB), tissue inhibitor of matrix
metalloproteinase-1 and 2 (TIMP-1, TIMP-2), tumor ne-crosis factor-alpha (TNF-α), and vascular endothelial growth factor (VEGF), according to the manufacturer’s instructions. Secreted levels of CAFs were quantified through Q-View Software (Quansys Biosciences, Logan, Utah) in triplicate samples, and the mean results were used in biomarker analysis.
Statistical analysis
In the first step, CAF levels were measured in the blood and bone marrow plasma samples of MM patients to as-sess whether significant differences could be detected in the two compartments by Student’s t test (p values less than 0.05 was considered significant). Since no signifi-cant differences between the two compartments were detected (see the “Results” section), subsequent analyses
were carried out using plasma samples from the periph-eral blood. With the Studentt test, the CAF levels in the plasma samples of the MM patients were compared with those of controls.
In the second phase, plasma levels of CAFs were mea-sured as an independent variable to predict binary re-sponse status (≥ VGPR vs < VGPR) by logistic regression analysis. CAF plasma levels were also correlated as a continuous variable with tumor response by linear re-gression and logarithmic transformation to normalize CAF values. The correlation between log-CAFs and tumor response was approximately linear. Selection of individual CAF markers from the screening phase was done on the basis of results of median cutoff, ROC curve estimation of cutoff, and logistic regression analysis be-tween dichotomized tumor response and CAF plasma levels. We assessed the association between CAF plasma levels and progression-free survival (PFS) with the Cox proportional hazard model.
To establish whether plasma levels of any CAF might
have prognostic or predictive significance, the
Kaplan-Meier method was used to analyze PFS and OS. We used the Cox regression model to verify significant differences noted in Kaplan-Meier curves for both treat-ment groups between a high- and a low-CAF subgroup, defined by the respective median CAF plasma levels.
Sensitivity analyses confirmed that median cutoff
achieved the most significant segregation of clinical benefit. To assess the potential differential effects of baseline CAF concentrations between two treatment groups, a treatment versus CAF status interaction term was included in the Cox model analysis for PFS, with treatment group and CAF status as two additional inde-pendent variables. CAF plasma levels with a significant interaction value with treatment were regarded as pre-dictive. A post hoc analysis was done to adjust for mul-tiple testing of CAF markers with the Bonferroni test.
Table 1 Patients’ characteristics
Patients Controls Total VMP VMPT n 124 53 71 54 Age 71 (56–85) 71 (60–85) 71 (56–85) 69 (54–88) Sex (M/F) 58/66 24/29 34/37 24/30 Type of MM NA IgG (%) 71 (57.2) 31 (58.5) 46 (64.8) IgA (%) 28 (22.6) 12 (22.6) 14 (19.8) BJ (%) 25 (20.2) 10 (18.9) 11 (15.4) Stage (D&S) NA IIA (%) 14 (11.3) 5 (9.4) 9 (12.7) IIIA (%) 102 (82.3) 45 (84.9) 57 (80.3) IIIB (%) 8 (6.4) 3 (5.7) 5 (7) ISS stage NA 1 26 8 18 2 42 21 21 3 21 6 15 Missing data 35 18 17 Cytogenetics NA High risk 28 11 17 Standard risk 36 16 20 Missing data 60 26 34 Response CR (%) 47 (37.9) 14 (26.4) 33 (46.6) VGPR (%) 27 (21.8) 11 (20.8) 16 (22.6) NA PR (%) 38 (30.6) 19 (35.8) 19 (26.8) SD (%) 12 (9.7) 9 (17) 3 (4.2) Relapse (Y/N) 80/44 39/14 41/30 NA Death (Y/N) 54/70 22/31 32/39 NA NA not applicable
Exploratory analyses included correlation between CAF plasma levels and Eastern Cooperative Oncology Group (ECOG) performance status, Durie & Salmon stage, International Staging System stage, Cytogenetic risk, and age and sex hierarchical clustering (unweighted pair group method with arithmetic mean, unweighted aver-age, and Euclidean distance for similarity measure) to as-sess a multiple-CAF signature association with PFS or OS (Kaplan-Meier method for PFS and OS, and Cox re-gression models to assess differences). All statistical ana-lyses were done with SPSS software.
Results
Biological samples (blood and bone marrow) from 124 MM patients randomly assigned to receive VMPT-VT (53 pts) or VMP (71 pts) in the GIMEMA MM0305 phase III clinical trial and blood plasma samples from 54 control subjects were available for this study. Baseline demographic and disease characteristics are reported in Table1.
We evaluated the concentration of ANG-2, FGF-2, HGF, IL-8, PDGF-BB, TIMP-1, TIMP-2, TNF-α, and VEGF that are the major cytokines involved in angiogen-esis in MM and other cancers [36] and, as previously demonstrated [37] in MM patients, directly correlate with disease activity and increase with progression. Moreover, plasma levels of CAFs are directly related to disease response to therapy in hematologic and solid tu-mors [29–32].
Our results showed that there were no differences in the levels of the studied CAFs between the peripheral blood and bone marrow plasma samples of MM patients (Fig. 1, Additional file 1: Table S1), indicating that the concentrations of circulating cytokines well reflect those of the bone marrow and could be used for all subse-quent analyses. As expected, the plasma levels of CAFs in MM patients were significantly higher compared to controls (p < 0.0001 for all CAFs). In addition, the levels of CAFs were found to be significantly related to MM
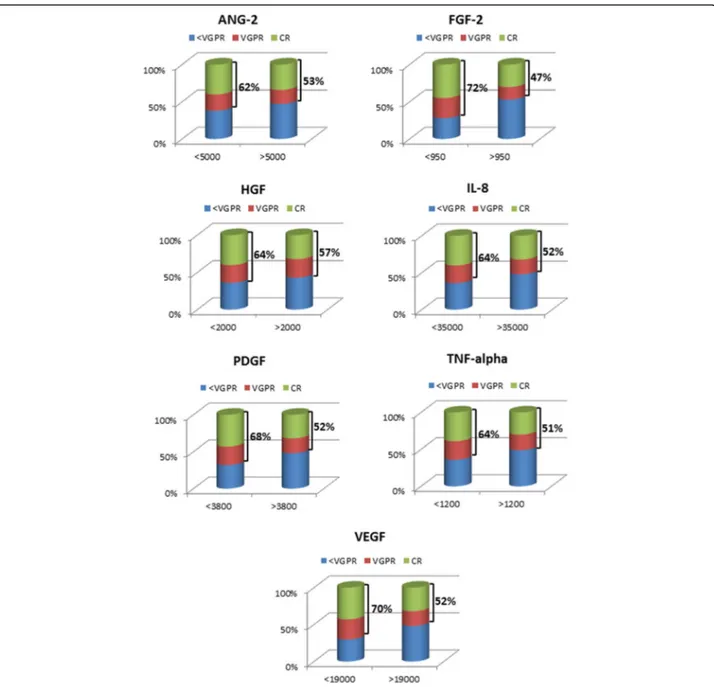
response to therapy (Fig. 2) with the exception of
Fig. 1 Analysis of the CAF levels in blood and bone marrow plasma samples of MM patients. No differences are evident in their concentration between peripheral blood and bone marrow samples. Significantly higher levels of CAFs are detected in blood and bone marrow samples of MM patients as compared with control subjects (p < 0.0001 for all cytokines)
TIMP-1 and TIMP-2. More precisely, low levels of ANG-2 (p < 0.05), FGF-2 (p < 0.005), HGF (p < 0.05), IL-8 (p < 0.05), PDGF-BB (p < 0.005), TNF-α (p < 0.05), and VEGF (p < 0.005) were indicative of more profound response (very good partial response [VGPR] or better in all patients, with no evident differences between the two therapeutic regimens (VMPT-VT vs VMP:p = 0.1).
On the basis of ROC curve estimation of cutoff and lo-gistic regression analysis between dichotomized tumor response and CAF plasma levels, a cutoff for each cyto-kine was established that could be used to discriminate
the probability of response to therapy of MM patients with high sensitivity and specificity (Additional file 1: Table S2). Seventy-four patients had the best degree of tumor response (≥ VGPR) and were termed good re-sponders, whereas 50 had the smallest degree of tumor response (< VGPR) and were termed poor responders. Among the seven CAFs that were shown to be signifi-cantly related to MM response to therapy (Fig. 2), low (relative to median) concentrations of ANG-2 (p < 0.0001), FGF-2 (p < 0.0001), HGF (p < 0.0001), IL-8 (p < 0.0001), PDGF-BB (p < 0.0001), TNF-α (p < 0.001), and
Fig. 2 Response rate of MM patients based on CAF levels. The blood levels of CAFs significantly correlate with MM response to therapy. Lower levels of ANG-2 (p < 0.05), FGF-2 (p < 0.005), HGF (p < 0.05), IL-8 (p < 0.05), PDGF-BB (p < 0.005), TNF-α (p < 0.05), and VEGF (p < 0.005) are indicative of more profound response, VGPR or better, in all patients, with no evident differences between the two therapy regimens (VMPT-VT vs VMP: p = 0.1)
VEGF (p < 0.0001) highly correlated with best response (Additional file1: Table S2).
In terms of survival, PFS correlated with CAF levels as a dichotomous variable, and low levels of FGF-2 (p < 0.0001), HGF (p < 0.05), IL-8 (p < 0.05), TNF-α (p < 0.05), and VEGF (p < 0.005) were associated with better PFS. Instead, only low levels of FGF-2 (p < 0.001) and VEGF (p < 0.004) were associated with prolonged OS. Similar results were obtained when CAF levels were related to PFS and OS according to the combination therapy ad-ministered. A better PFS was in fact related to low levels of FGF-2 (p < 0.0001), HGF (p < 0.0001), TNF-α (p < 0.005), and VEGF (p < 0.005) in the VMP arm and FGF-2 (p < 0.005) and VEGF (p < 0.05) in the VMPT-VT arm. When OS was taken into consideration, only FGF-2 (p < 0.001 in the VMP arm, p < 0.005 in the VMPT-VT arm), and VEGF (p < 0.05 for both arms) were demonstrated (Additional file1: Table S3).
Hierarchical clustering analysis (Fig. 3) showed three distinct risk groups of patients, based on the concentra-tions of two CAF levels (FGF-2 and VEGF). Patients with elevation of both CAF levels had a worse prognosis with significantly shorter PFS and OS (high risk) com-pared with those with high level of only one (p < 0.0001, intermediate risk) and those of low blood levels of both CAFs (p < 0.0001, low risk) (Fig.3). No significant differ-ences were detected depending on the type of therapy received. Trying to construct a survival model, a three-stage system using FGF-2 and VEGF blood levels provided the highest statistically significant results (Table 2). Median survivals of the risk groups were as follows: low risk: PFS 44 months, OS 70 months; inter-mediate risk: PFS 23.5 months, OS 62 months; and high risk: PFS 14.5 months, OS 34 months (p < 0.0001 for dif-ferences). Patient numbers were well distributed across the three groups (low risk, 40%; intermediate risk, 29%; and high risk, 31%).
By multivariate analysis (Table 3), the other variables significantly associated with better outcome were age < 65 years in the intermediate- and high-risk groups (HR 0.61, CI 0.44–0.85, p = 0.0047 and HR 0.60, CI 0.38– 0.89, p = 0.0391, respectively) for OS; age < 65 years and best response to induction therapy (≥ VGPR) only in the high-risk group (HR 0.68, CI 0.48–0.96, p = 0.0342) for PFS. Durie and Salmon (D&S) stage 1 or 2 impacted only on PFS for the high-risk group (HR 0.64, CI 0.49– 0.89,p = 0.0169). No significant differences were demon-strated regarding both PFS and OS for sex, isotype of the M-component, renal failure, and type of induction therapy. The administration of maintenance therapy sig-nificantly impacted on PFS in all the risk groups (low: HR 0.70, CI 0.44–0.89, p = 0.0210; intermediate: HR 0.54, CI 0.38–0.80, p = 0.0008; high: HR 0.71, CI 0.56– 0.92, p = 0.0249) and OS (low: HR 0.70, CI 0.48–0.88, p
= 0.0210; intermediate: HR 0.74, CI 0.57–1.01, p = 0.0330; high: HR 0.52, CI 0.36–0.75, p = 0.0003).
As regards the cytogenetic risk, because many data relative to the cytogenetic characteristics of the patients were missing in the database of the trial, the statistical power of the relative analysis was low. For this reason, it is not possible to reach a correct conclusion on the value of CAFs stratification risk in correlation to this risk parameter.
Discussion
The emergence of new treatment options for MM has extended the patients’ survival [5] and the need to pro-spectively identify those patients who are likely to bene-fit from a specific treatment and understand the mechanisms underlying therapeutic resistance. Several adverse prognostic factors have been identified in MM at diagnosis and before initiation of treatment [38, 39], including an advanced stage in the international staging system (ISS) based on plasma albumin [40]. The dual ac-tivity of the new and newest drugs active both on MM plasma cells and bone marrow stromal cells, and in par-ticular on angiogenesis [41–43], obviously indicates that any new prognostic markers cannot ignore the angio-genesis aspect. Previous studies have indeed suggested that the plasma levels of CAFs might be used to identify prognostic and predictive markers in solid tumors [44– 49] and are indicative of the response to antineoplastic therapy [29–32].
Seven CAFs of the nine evaluated (ANG-2, FGF-2, HGF, IL-8, PDGF-BB, TNF-α, and VEGF) initially emerged as being related to disease activity, but further testing showed that only FGF-2 and VEGF were signifi-cantly associated with PFS and OS and were therefore evaluated for prognostic stratification of patients. We also assessed whether determination of the studied CAFs could add prognostic information to D&S [50] and International Staging Systems (ISS) [40] or whether these systems were, in fact, predictive of benefit. D&S and ISS staging were associated with prognosis based on PFS in both groups; however, they were not strong prog-nostic parameters as FGF-2 and/or VEGF. Thus, the plasma levels of the two angiogenic cytokines provided prognostic and, more importantly, predictive value be-yond that of standard clinical staging.
Our analyses of survival were based on assignment at initial randomization. High FGF-2 and VEGF plasma levels were negative prognostic markers and were associ-ated with lower relative OS in both harms. The associa-tions reported here with FGF-2 and VEGF were akin to previous studies [29–32], in which patients with the highest reduction of circulating CAF concentrations ob-tained the greatest benefit from anticancer therapy. However, other studies assessing the use of VEGF as a
predictive marker of benefit from VEGF-targeted therap-ies in renal-cell carcinoma have yielded inconsistent re-sults [51].
Previous studies have shown that groups of related an-giogenic or inflammatory factors are often correlated
[44, 46, 52]. Hierarchical clustering of six circulating CAFs showed a strong correlation among many of them, including osteopontin and VEGF [46, 52]. Patients de-fined by high concentrations of these CAF and inflam-matory or immunomodulatory factors had a significantly
Fig. 3 Progression-free and overall survival analysis in MM patients based on the peripheral blood plasma concentrations of FGF-2 and VEGF. The hierarchical clustering analysis of MM patients shows three distinct risk groups of patients based on the concentrations of FGF-2 and VEGF. High risk: patients who present both high FGF-2 and VEGF plasma levels showing a worse prognosis with significantly shorter PFS and OS; intermediate risk: patients who present high plasma levels in only one of the two cytokines; low risk: patients who show low blood levels in both angiogenic cytokines. Again, no evident differences between the two therapy regimens were detected
Table 2 Patient stratification based on CAF circulating levels
Risk group Risk factors Criteria Median PFS (months) Median OS
(months) Low 0 FGF-2≤ 950 pg/dL and VEGF≤ 19,000 pg/dL 38 67 Intermediate 1 FGF-2 > 950 pg/dL or VEGF > 19,000 pg/dL 24 55 High 2 FGF-2 > 950 pg/dL and VEGF > 19,000 pg/dL 15 37
worse prognosis, but derived a greater relative OS bene-fit from therapy. The circulating CAFs identified in these studies might themselves have important biological roles or might be markers for alternative pathways or
mecha-nisms affecting treatment responses (e.g.,
hypoxia-induced factor-1α or NF-κB pathways). This as-sociation between factors suggests that common mecha-nisms might regulate their production. Studying a cohort of patients with metastatic renal-cell carcinoma, a classification of the disease based on the higher ex-pression of angiogenic versus inflammatory circulating CAFs defined by a six-cytokine signature was established [46]. In that study, the angiogenic group derived greater benefit from sorafenib alone, whereas the other group benefited from the combination of sorafenib and IFN-α. In the present study, a similar correlation of treatment benefit with circulating CAF signature was observed in MM patients.
All the evidences provided by the studies on the role of microenvironment [3, 17], and particularly of the an-giogenic process [23,37] in myeloma progression as well as in cancer cell protection mediated by microenviron-ment components [37], indicated that the response to therapy is also related to the activity of anticancer drugs on tumor microenvironment [42,43]. Therefore, the in-hibition of cytokine production which mediates the interaction between cancer cells and their microenviron-ment represents one of the major goals of the modern therapeutic approaches. On these bases, the evaluation
of CAF levels is indicative of the response to therapy and may represent a good indicator of refractoriness in cancer patients.
Conclusion
Overall, our findings support the use of circulating CAF profiling to define biologically distinct subgroups of MM patients whose tumors have a greater angiogenic drive. As such, these patients might have a more aggressive disease course but are likely to derive relative benefit from inhibition of angiogenic pathways. Circulating CAF profiling might be particularly well suited for angiogen-esis inhibitors and other drugs targeting the tumor
microenvironment, in which both circulating
host-derived and tumor-derived factors could affect re-sponse. Such an approach may have important
advan-tages, including straightforward and relatively
non-invasive sample collection, availability of robust analytical platforms, and the ability to monitor changes during treatment or disease progression, which can help identify markers of resistance.
The limitation of this study is that the results have been obtained in older patients not-eligible for ASCT, whereas the major strength of the study is the homoge-neous stratification and longer follow-up of patients. Further studies on a greater cohort of subjects, including young patients eligible for ASCT before and after treat-ment, will be needed to evaluate the variation of CAFs after therapy, to study their power as an indicator of
Table 3 Multivariate analysis of risk stratification of patients based on the CAFs FGF-2 and VEGF
Variable PFS OS
Risk group Risk group
Low Intermediate High Low Intermediate High
HR (95 CI) p HR (95 CI) p HR (95 CI) p HR (95 CI) p HR (95 CI) p HR (95 CI) p Sex 0.82 (0.59–1.18) 0.3698 0.74(0.59–1.11) 0.9645 0.86(0.62–1.08) 0.3438 0.80(0.57–1.05) 0.3698 0.96(0.68–1.33) 0.6905 0.86(0.59–1.16) 0.5713 Age (< 65 years) 0.96 (0.69–1.35) 0.7647 0.87(0.55–1.20) 0.2027 0.73(0.59–0.98) 0.0455 0.97(0.71–1.32) 0.7647 0.61(0.44–0.85) 0.0047 0.60(0.38–0.89) 0.0391 Isotype 0.91 (0.56–1.32) 0.2957 0.91(0.64–1.31) 0.6951 0.96(0.68–1.33) 0.6419 0.82(0.51–1.21) 0.2957 0.83(0.57–1.15) 0.3627 0.98(0.81–1.22) 0.8179 D&S stage 0.84 (0.60–1.16) 0.3218 0.82(0.57–1.22) 0.3505 0.64(0.49–0.89) 0.0169 0.83(0.59–1.11) 0.3218 0.98(0.67–1.44) 0.7874 0.74(0.59–1.12) 0.0593 ISS stage 0.94 (0.66–1.29) 0.8163 0.91(0.55–1.24) 0.2107 0.84(0.58–1.28) 0.0619 0.79(0.61–1.07) 0.1087 0.97(0.66–1.34) 0.5221 0.87(0.62–1.27) 0.0665 Cytogenetic risk 0.93 (0.64–1.28) 0.6358 0.87(0.56–1.22) 0.3451 0.91(0.55–1.33) 0.6670 0.86(0.71–1.32) 0.2399 0.89(0.69–1.41) 0.6133 0.92(0.71–1.37) 0.6112 Renal failure 0.94 (0.61–1.25) 0.5866 0.92(0.59–1.44) 0.6957 0.87(0.60–1.21) 0.2410 0.92(0.66–1.41) 0.5866 0.94(0.71–1.35) 0.6108 0.97(0.74–1.25) 0.8902 Induction therapy 0.84 (0.61–1.28) 0.3520 0.93(0.66–1.34) 0.6838 0.88(0.58–1.18) 0.3356 0.84(0.57–1.19) 0.3520 0.93(0.70–1.32) 0.6075 0.89(0.66–1.28) 0.6015 Best response to induction therapy (≥ VGPR) 0.76(0.59–1.18) 0.0984 0.68(0.48–0.96) 0.0342 0.71(0.55–1.08) 0.0533 0.74(0.59–1.09) 0.0984 0.95(0.69–1.31) 0.5031 0.88(0.61–1.29) 0.0583 Maintenance 0.70 (0.44–0.89) 0.0210 0.54(0.38–0.80) 0.0008 0.71(0.56–0.92) 0.0249 0.70(0.48–0.88) 0.0210 0.74(0.57–1.01) 0.0330 0.52(0.36–0.75) 0.0003 p values less than 0.05 was considered significant
minimal residual disease and, then, of risk of relapse, and to evaluate the value of the risk stratification based on CAFs in the new drugs era, with the aim of defini-tively establish the value of this approach in the applica-tion of precision, personalized therapy for patients with MM.
Additional file
Additional file 1:Table S1. CAF levels in serum and bone marrow plasma of MM patients. Table S2. Cutoff for serum levels of cytokines and angiogenic factors (CAFs). Table S3. PFS and OS correlation with CAF levels (PDF 460 kb)
Abbreviations
ANG-2:Angiopoietin-2; CAFs: Cytokines and angiogenic factors;
CI: Confidence interval; D&S: Durie and Salmon; ECOG: Eastern Cooperative Oncology Group; FGF-2: Fibroblast Growth Factor-2; HGF: Hepatocyte Growth Factor; HR: Hazard ratio; IL-8: Interleukin-8; ISS: International Staging System; MM: Multiple myeloma; OS: Overall Survival; PDGF-BB: Platelet-Derived Growth Factor-BB; PFS: Progression-Free Survival; TIMP: Tissue Inhibitor of Matrix Metalloproteinase; TNF-α: Tumor Necrosis Factor-alpha; VEGF: Vascular Endothelial Growth Factor; VGPR: Very Good Partial Response;
VMP: prednisone; VMPT-VT: Bortezomib-melphalan-prednisone-thalidomide followed by maintenance with bortezomib-thalidomide
Acknowledgements
The authors would like to thank the Italian Association for Cancer Research (AIRC, Milan), Investigator Grant 2013 (no. 14095) and the 5 per thousand Molecular Clinical Oncology Special Program (Grant no. 9965 to Angelo Vacca).
Availability of data and materials
The data that support the findings of this study are available from the corresponding author upon reasonable request and with permission of Local IRB.
Authors’ contributions
Conceptualization was done by RR. Laboratory test was carried out by IS, CT, and PO. Data curation and statistical analysis were done by IS and RR. Care of patients and data collection were done by FM, NG, CT, PO, AP, SB, LDP, EM, AL, MO, FP, CN, TG, GB, VC, LB, MG, GL, MR, APF, DG, VM, PM, MTP, MB, AV, and RR. All authors read and approved the final manuscript.
Ethics approval and consent to participate
The Local IRB approved this study and all patients gave their informed consent before the entry into the clinical trial in agreement with institutional guidelines.
Consent for publication Not applicable.
Competing interests
Lorenzo De Paoli: honorary from Jansen, Abbvie, Celgene, Gilead, AMGEN, and Roche. Massimo Offidani: honorary and advisory from Janssen. Maria Teresa Petrucci: Honoraria and Advisory Board: Celgene, Janssen-Cilag, BMS, Takeda, Amgen. Roberto Ria: Honoraria and Advisory Board: Celgene, Janssen-Cilag, BMS, Italfarmaco, Amgen. The other authors declare no com-peting interests.
Publisher’s Note
Springer Nature remains neutral with regard to jurisdictional claims in published maps and institutional affiliations.
Author details
1Department of Biomedical Science and Human Oncology, University of Bari
“Aldo Moro” Medical School, Bari, Italy.2Biothecnology Research Unit,
Aprigliano, Cosenza, Italy.3Hemato-oncology Department Augusta Victoria Hospital, Jerusalem, Israel.4Department of Clinical and Experimental
Medicine, Myeloma Unit, University of Parma, Parma, Italy.5“Seràgnoli”
Institute of Hematology, Department of Experimental, Diagnostic and Specialty Medicine (DIMES), Bologna University School of Medicine, Bologna, Italy.6Division of Hematology, University of Torino, Azienda
Ospedaliero-Universitaria Città della Salute e della Scienza di Torino, Turin, Italy.7Università degli Studi del Piemonte Orientale, Novara, Italy.8Division of
Hematology, AOU“Policlinico-Vittorio Emanuele”, Catania, Italy.9Hematology Unit A.O.U. Ospedali Riuniti, Ancona, Italy.10DAME, University of Udine,
Udine, Italy.11Cellular Therapies and Transfusion Medicine Unit, AOU Careggi,
Florence, Italy.12A.O. San Luigi, Gonzaga, Orbassano, Turin, Italy.13SC
Hematology AO Città della Salute e della Scienza, Turin, Italy.14Divisione di Ematologia, Ospedali Riuniti, Reggio di Calabria, Italy.15Hematology Unit,
Fondazione IRCCS, Cà Granda, OM Policlinico, DIPO, University of Milan, Milan, Italy.16A.O. S. Croce e Carle, Cuneo, Italy.17Department of Oncology
and Hematology AOU, Hematology Unit, Modena, Italy.18University Tor Vergata, Rome, Italy.19IRCCS Casa Sollievo della Sofferenza, San Giovanni
Rotondo, Italy.20A.O.U. S. Giovanni Battista A.O. Mauriziano-Umberto I, Turin,
Italy.21IRCCS Istituto Nazionale per lo Studio e la Cura dei Tumori, Milan,
Italy.22IRCCS Centro di Riferimento Oncologico della Basilicata, Rionero in Vulture, Italy.23Hematology, Department of Cellular Biotechnologies and
Hematology, Sapienza University of Rome, Rome, Italy.24Internal Medicine
“G. Baccelli”, Myeloma Unit, University of Bari “Aldo Moro” Medical School, Azienda Ospedaliero-Universitaria Policlinico, Piazza Giulio Cesare 11, 70124 Bari, Italy.
Received: 22 September 2018 Accepted: 25 December 2018
References
1. Noone AM, Howlader N, Krapcho M, Miller D, Brest A, Yu M, et al. SEER Cancer Statistics Review, 1975–2015, National Cancer Institute. Bethesda, MD,https://seer.cancer.gov/csr/1975_2015/, based on November 2017 SEER data submission, posted to the SEER web site. April 2018.
2. Alexanian R, Haut A, Khan AU, Lane M, McKelvey EM, Migliore PJ, et al. Treatment for multiple myeloma: combination chemotherapy with different melphalan dose regimens. JAMA. 1969;208:1680–5.
3. Kyle RA, Rajkumar SV. Multiple myeloma. N Engl J Med. 2004;351:1860–73. 4. Myeloma Trialists’ Collaborative Group. Combination chemotherapy versus
melphalan plus prednisone as treatment for multiple myeloma. An overview of 6,633 patients from 27 randomized trials. J Clin Oncol. 1998;16: 3832–42.
5. Ria R, Reale A, Vacca A. Novel agents and new therapeutic approaches for treatment of multiple myeloma. World J Methodol. 2014;4:73–90. 6. Richardson PG, Sonneveld P, Schuster MW, Irwin D, Stadtmauer EA, Facon T,
et al. Bortezomib or high-dose dexamethasone for relapsed multiple myeloma. N Engl J Med. 2005;352:2487–98.
7. San Miguel JF, Schlag R, Khuageva NK, Dimopoulos MA, Shpilberg O, Kropff M, et al. Bortezomib plus melphalan and prednisone for initial treatment of multiple myeloma. N Engl J Med. 2008;359:906–17.
8. Palumbo A, Bringhen S, Caravita T, Merla E, Capparella V, Callea V, et al. Oral melphalan and prednisone chemotherapy plus thalidomide compared with melphalan and prednisone alone in elderly patients with multiple myeloma: randomised controlled trial. Lancet. 2006;367:825–31.
9. Facon T, Mary JY, Hulin C, Benboubker L, Attal M, Pegourie B, et al. Melphalan and prednisone plus thalidomide versus melphalan and prednisone alone or reduced-intensity autologous stem cell transplantation in elderly patients with multiple myeloma (IFM 99-06): a randomised trial. Lancet. 2007;370:1209–18.
10. Hulin C, Facon T, Rodon P, Pegourie B, Benboubker L, Doyen C, et al. Efficacy of melphalan and prednisone plus thalidomide in patients older than 75 years with newly diagnosed multiple myeloma: IFM 01/01 trial. J Clin Oncol. 2009;27:3664–70.
11. Dimopoulos M, Spencer A, Attal M, Prince HM, Harousseau JL, Dmoszynska A, et al. Lenalidomide plus dexamethasone for relapsed or refractory multiple myeloma. N Engl J Med. 2007;357:2123–32.
12. Weber DM, Chen C, Niesvizky R. Lenalidomide plus dexamethasone for relapsed multiple myeloma in North America. N Engl J Med. 2007;357:2133–42. 13. Palumbo A, Falco P, Corradini P, Falcone A, Di Raimondo F, Giuliani N, et al.
Melphalan, prednisone, and lenalidomide treatment for newly diagnosed myeloma: a report from the GIMEMA—Italian Multiple Myeloma Network. J Clin Oncol. 2007;25:4459–65.
14. Biran N, Jagannath S, Chari A. Risk stratification in multiple myeloma, part 1: characterization of high-risk disease. Clin Adv Hematol Oncol. 2013;11:489–503. 15. Fonseca R, Monge J, Dimopoulos MA. Staging and prognostication of
multiple myeloma. Expert Rev Hematol. 2014;7:21–31.
16. Mihailovic J, Goldsmith SJ. Multiple myeloma: 18F-FDG-PET/CT and diagnostic imaging. Semin Nucl Med. 2015;45:16–31.
17. Landgren O, Morgan GJ. Biologic frontiers in multiple myeloma: from biomarker identification to clinical practice. Clin Cancer Res. 2014;20:804–13. 18. Hart AJ, Jagasia MH, Kim AS, Mosse CA, Savani BN, Kassim A. Minimal
residual disease in myeloma: are we there yet? Biol Blood Marrow Transplant. 2012;18:1790–9.
19. Shaughnessy JD, Zhou Y, Haessler J, van Rhee F, Anaissie E, Nair B, et al. TP53 deletion is not an adverse feature in multiple myeloma treated with total therapy 3. Br J Haematol. 2009;147:347–51.
20. Neben K, Lokhorst HM, Jauch A, Bertsch U, Hielscher T, van der Holt B, et al. Administration of bortezomib before and after autologous stem cell transplantation improves outcome in multiple myeloma patients with deletion 17p. Blood. 2012;119:940–8.
21. Stella F, Pedrazzini E, Agazzoni M, Ballester O, Slavutsky I. Cytogenetic alterations in multiple myeloma: prognostic significance and the choice of frontline therapy. Cancer Investig. 2015;33:496–504.
22. Chng WJ, Dispenzieri A, Chim CS, Fonseca R, Goldschmidt H, Lentzsch S, et al. International Myeloma Working Group. IMWG consensus on risk stratification in multiple myeloma. Leukemia. 2014;28:269–77.
23. Vacca A, Ria R, Reale A, Ribatti D. Angiogenesis in multiple myeloma. Chem Immunol Allergy. 2014;99:180–96.
24. Motzer RJ, Hutson TE, Tomczak P, Michaelson MD, Bukowski RM, Rixe O, et al. Sunitinib versus interferon alfa in metastatic renal-cell carcinoma. N Engl J Med. 2007;356:115–24.
25. Hutson TE, Davis ID, Machiels JP, De Souza PL, Rottey S, Hong BF, et al. Efficacy and safety of pazopanib in patients with metastatic renal cell carcinoma. J Clin Oncol. 2010;28:475–80.
26. Escudier B, Eisen T, Stadler WM, Szczylik C, Oudard S, Siebels M, et al. Sorafenib in advanced clear-cell renal-cell carcinoma. N Engl J Med. 2007; 356:125–34.
27. Escudier B, Pluzanska A, Koralewski P, Ravaud A, Bracarda S, Szczylik C, et al. Bevacizumab plus interferon alfa-2a for treatment of metastatic renal cell carcinoma: a randomised, double-blind phase III trial. Lancet. 2007;370: 2103–11.
28. Sternberg CN, Davis ID, Mardiak J, Szczylik C, Lee E, Wagstaff J, et al. Pazopanib in locally advanced or metastatic renal cell carcinoma: results of a randomized phase III trial. J Clin Oncol. 2010;28:1061–8.
29. Ria R, Cirulli T, Giannini T, Bambace S, Serio G, Portaluri M, et al. Serum levels of angiogenic cytokines decrease after radiotherapy in non-Hodgkin lymphomas. Clin Exp Med. 2008;8:141–5.
30. Ria R, Portaluri M, Russo F, Cirulli T, Di Pietro G, Bambace S, et al. Serum levels of angiogenic cytokines decrease after antineoplastic radiotherapy. Cancer Lett. 2004;216:103–7.
31. Dietz A, Rudat V, Conradt C, Weidauer H, Ho A, Moehler T. Prognostic relevance of serum levels of the angiogenic peptide bFGF in advanced carcinoma of the head and neck treated by primary radiochemotherapy. Head Neck. 2000;22:666–73.
32. Chala E, Manes C, Iliades H, Skaragkas G, Mouratidou D, Kapantais E. Insulin resistance, growth factors and cytokine levels in overweight women with breast cancer before and after chemotherapy. Hormones. 2006;5:137–46. 33. Palumbo A, Bringhen S, Rossi D, Cavalli M, Larocca A, Ria R, et al.
Bortezomib-melphalan-prednisone-thalidomide followed by maintenance with bortezomib-thalidomide compared with bortezomib-melphalan-prednisone for initial treatment of multiple myeloma: a randomized controlled trial. J Clin Oncol. 2010;28:5101–9.
34. Morabito F, Gentile M, Mazzone C, Rossi D, Di Raimondo F, Bringhen S, et al. Safety and efficacy of bortezomib-melphalan-prednisone-thalidomide followed by bortezomib-thalidomide maintenance (VMPT-VT) versus bortezomib-melphalan-prednisone (VMP) in untreated multiple myeloma patients with renal impairment. Blood. 2011;118:5759–66.
35. Palumbo A, Bringhen S, Larocca A, Rossi D, Di Raimondo F, Magarotto V, et al. Bortezomib-melphalan-prednisone-thalidomide followed by maintenance with thalidomide compared with bortezomib-melphalan-prednisone for initial treatment of multiple myeloma: updated follow-up and improved survival. J Clin Oncol. 2014;32:634–40. 36. Carmeliet P, Jain RK. Angiogenesis in cancer and other diseases. Nature.
2000;407:249–57.
37. Ria R, Reale A, De Luisi A, Ferrucci A, Moschetta M, Vacca A. Bone marrow angiogenesis and progression in multiple myeloma. Am J Blood Res. 2011;1:76–89. 38. Cosemans C, Oben B, Arijs I, Daniëls A, Declercq J, Vanhees K, et al.
Prognostic biomarkers in the progression from MGUS to multiple myeloma: a systematic review. Clin Lymphoma Myeloma Leuk. 2018;18:235–48. 39. Hanbali A, Hassanein M, Rasheed W, Aljurf M, Alsharif F. The evolution of
prognostic factors in multiple myeloma. Adv Hematol. 2017;2017:4812637. 40. Greipp PR, San Miguel J, Durie BG, Crowley JJ, Barlogie B, Bladé J, et al.
International staging system for multiple myeloma. J Clin Oncol. 2005;23: 3412–20.
41. Roccaro AM, Hideshima T, Raje N, Kumar S, Ishitsuka K, Yasui H, et al. Bortezomib mediates antiangiogenesis in multiple myeloma via direct and indirect effects on endothelial cells. Cancer Res. 2006;66:184–91. 42. Moschetta M, Di Pietro G, Ria R, Gnoni A, Mangialardi G, Guarini A, et al.
Bortezomib and zoledronic acid on angiogenic and vasculogenic activities of bone marrow macrophages in patients with multiple myeloma. Eur J Cancer. 2010;46:420–9.
43. De Luisi A, Ferrucci A, Coluccia AM, Ria R, Moschetta M, de Luca E, et al. Lenalidomide restrains motility and overangiogenic potential of bone marrow endothelial cells in patients with active multiple myeloma. Clin Cancer Res. 2011;17:1935–46.
44. Nikolinakos PG, Altorki N, Yankelevitz D, Tran HT, Yan S, Rajagopalan D, et al. Plasma cytokine and angiogenic factor profiling identifies markers associated with tumor shrinkage in early-stage non-small cell lung cancer patients treated with pazopanib. Cancer Res. 2010;70:2171–9.
45. Hanrahan EO, Lin HY, Kim ES, Yan S, Du DZ, McKee KS, et al. Distinct patterns of cytokine and angiogenic factor modulation and markers of benefit for vandetanib and/or chemotherapy in patients with non-small-cell lung cancer. J Clin Oncol. 2010;28:193–201.
46. Zurita AJ, Jonasch E, Wang X, Khajavi M, Yan S, Du DZ, et al. A cytokine and angiogenic factor (CAF) analysis in plasma for selection of sorafenib therapy in patients with metastatic renal cell carcinoma. Ann Oncol. 2012;23:46–52. 47. Heng DY, Xie W, Regan MM, Warren MA, Golshayan AR, Sahi C, et al.
Prognostic factors for overall survival in patients with metastatic renal cell carcinoma treated with vascular endothelial growth factor-targeted agents: results from a large, multicenter study. J Clin Oncol. 2009;27:5794–9. 48. Peña C, Lathia C, Shan M, Escudier B, Bukowski RM. Biomarkers predicting
outcome in patients with advanced renal cell carcinoma: results from sorafenib phase III treatment approaches in Renal Cancer Global Evaluation Trial. Clin Cancer Res. 2010;16:4853–63.
49. Tran HT, Liu Y, Zurita AJ, Lin Y, Baker-Neblett KL, Martin AM, et al. Prognostic or predictive plasma cytokines and angiogenic factors for patients treated with pazopanib for metastatic renal-cell cancer: a retrospective analysis of phase 2 and phase 3 trials. Lancet Oncol. 2012;13:827–37.
50. Durie BG, Salmon SE. A clinical staging system for multiple myeloma. Correlation of measured myeloma cell mass with presenting clinical features, response to treatment, and survival. Cancer. 1975;36:842–54. 51. Melichar B, Procházková-Študentová H, Vitásková D. Bevacizumab in
combination with IFN-α in metastatic renal cell carcinoma: the AVOREN trial. Expert Rev Anticancer Ther. 2012;12:1253–61.
52. Heymach JV, Shackleford TJ, Tran HT, Yoo SY, Do KA, Wergin M, et al. Effect of low-fat diets on plasma levels of NFκB-regulated inflammatory cytokines and angiogenic factors in men with prostate cancer. Cancer Prev Res (Phila). 2011;4:1590–8.