TABLE OF CONTENTS
SOMMARIO I
SUMMARY III
List of abbreviations V
1.INTRODUCTION 1
1.1 Mitochondria and complex phenotypes 1
1.2 MtDNA and oxidative stress: an overview 2
1.3 MtDNA inherited variability 5
1.4 The nuclear-mitochondrial cross talk and the retrograde response 8 1.5 Mammalian Sirtuins: sensors of mitochondria signalling pathways? 10 1.6 Transcription Factors: sensors of mitochondria signalling pathways? 16
1.7 Aim of work 20
2.MATERIALS AND METHODS 21
2.1 Cell lines and culture conditions 21
2.2 Experiments for quality control of mtDNA depletion 21 2.3 Production of transmitochondrial cybrids 21
2.4 MtDNA analyses 22
2.5 Proliferation assay 22
2.6 Quantification of mtDNA 22
2.7 Mitochondrial membrane potential (MMP) assay 23
2.8 Oxidative stress treatment 24
2.9 Cell viability assay 24
2.10 DNA fragmentation analysis 24
2.11 RT-PCR of human SIRT genes 25
2.12 RT-PCR of Transcription Factors genes 27
3.RESULTS AND DISCUSSION 29
3.1 MtDNA variability in donor platelets 29
3.2 Absence of mtDNA in rho0 cells and effectiveness of the
mitochondrial repopulation 30
3.3 Functionality of the cybrid cell lines 33
3.4 Quantification of mtDNA 34
3.5 Stress conditions 35
3.6 Setting-up of the RT-PCR conditions for the analysis of gene
expression 38
3.7 Gene expression profiles 39
3.7.1 Sirtuin genes 40
3.7.2 Transcription Factors genes 48
4.CONCLUSIVE REMARKS 54
Sommario
I mitocondri giocano un ruolo chiave nella regolazione di diversi pathways intracellulari, contribuendo in tal modo allo sviluppo ed alla qualità di caratteri complessi età-correlati. In particolare, diverse evidenze sperimentali hanno messo in luce l’esistenza di una Risposta Retrograda diretta dal mitocondrio al nucleo in risposta a stimoli di stress. La Risposta Retrograda è un meccanismo compensatorio mediante il quale la cellula, modulando l’espressione di geni nucleari, riesce a fronteggiare una serie di fattori di stress intrinseci ed estrinseci. In questo contesto, la variabilità dell’informazione genetica contenuta nel DNA mitocondriale potrebbe giocare un ruolo importante. Infatti, tale variabilità potrebbe influenzare l’efficienza della risposta retrograda in condizioni di stress, come suggerito dall’associazione osservata da un lato tra fenotipi complessi e risposta allo stress, dall’altro tra fenotipi complessi e polimorfismi del DNA mitocondriale.
Le sirtuine sono proteine che agiscono nella regolazione genica sia in modo non specifico, esercitando la propria attività a livello del genoma nucleare mediante la deacetilazione delle proteine istoniche, sia a livello di specifici geni mediante la deacetilazione di fattori di trascrizione. Diverse evidenze sperimentali suggeriscono che le sirtuine, la cui attività è modulata dalla disponibilità del co-substrato NAD+, siano sensori dello stress ossidativo cellulare in grado di modulare le vie di segnale mitocondrio-nucleo. A tale proposito, è da sottolineare che i livelli di espressione di geni sirtuinici sono coinvolti nella modulazione della lifespan di organismi modello. Scopo del presente lavoro è stato quello di analizzare il ruolo della variabilità comune del DNA mitocondriale nel modulare, in risposta allo stress ossidativo, l’espressione dei sette geni codificanti le sirtuine umane (SIRT1-7) e di cinque geni codificanti fattori di trascrizione (NFE2L1, NFE2L2, NRF1, TFAM, NFKB1). Per raggiungere tale obiettivo, abbiamo prodotto cinque linee cellulari cibride, ripopolando cellule di osteosarcoma umano 143B.TK- private del proprio mtDNA (cellule rho0) con mtDNA proveniente da cinque differenti donatori (aplogruppi mitocondriali H, J, U, X, T). In tali linee, dopo la messa a punto di una serie di controlli, abbiamo studiato l’effetto dello stress ossidativo sui profili di espressione dei geni sopra citati.
I risultati ottenuti possono essere sintetizzati come segue. 1) La variabilità comune del DNA mitocondriale non influenza i patterns di espressione dei geni analizzati, né in
condizioni basali né in condizioni di stress. 2) L’espressione genica non è influenzata dalla presenza di mitocondri funzionali poiché non sono state riscontrate differenze fra la linea cellulare rho0 e le linee cellulari dotate di mitocondri funzionali. 3) Lo stress ossidativo induce la sotto-espressione del gene SIRT5 in tutte le linee cellulari, indipendentemente dalla qualità e dalla quantità del DNA mitocondriale.
Il risultato n.3 è particolarmente importante, poiché per la prima volta viene documentata una modulazione dell’espressione del gene SIRT5 in risposta allo stress ossidativo. Anche se dati sulla specifica funzione di SIRT5 non sono presenti in letteratura, va comunque sottolineato che tale proteina, come le altre sirtuine, ha una attività deacetilasica, che la candida come regolatore della espressione genica sia a livello genomico globale (mediante attività sugli istoni) sia a livello di specifici geni (mediante attività sui fattori di trascrizione). Il nostro studio apre pertanto nuove prospettive sul coinvolgimento delle sirtuine nella risposta allo stress ossidativo.
Summary
Mitochondria are emerging as key regulator of different intracellular pathways, in such a way contributing to onset and quality of age-related complex traits. In particular, several lines of evidence have revealed the existence of a Retrograde Response (RR) directed from mitochondria to nucleus in response to stress. RR is a compensatory mechanism by which the cell is able to cope with a variety of intrinsic or extrinsic stress factors by regulating nuclear gene expression. In this scenario the mtDNA genome information may play a pivotal role. In fact, literature data show that mtDNA common variability is correlated to complex phenotypes, probably because mtDNA information influences the capability of mitochondria to activate an efficient retrograde response under stress conditions.
Due to their NAD+ dependence, sirtuin proteins are emerging as putative oxidative stress-sensor in mitochondria-to-nucleus signaling pathways. What is more, sirtuins are regulatory proteins able to act both at global genome level through histone deacetylase activity and at local gene level through deacetylase activity by acting on transcription factors. Last, but not least, the level of sirtuin gene expression modulates lifespan in model organisms.
On the basis of the above considerations, aim of this PhD thesis was to investigate the role of common mtDNA variability in modulating the expression profiles of seven sirtuin genes (SIRT1-7 genes) and five Transcription Factors genes (NFE2L1, NFE2L2, NRF1, TFAM, NFKB1 genes) in response to oxidative stress. To realize the objective, we assembled five different cybrid cell lines, by repopulating with foreign mitochondria 143B.TK- osteosarcoma cells depleted of their own mtDNA (rho0 cells).
The results we obtained can be summarized as follows. First, the common mtDNA variability does not influence the expression patterns of the analyzed genes at either basal or stress conditions. Second, gene expression does not depend on the presence of functional mitochondria because we have not observed any difference between rho0 cells and the cell lines having functional mitochondria. Third, and mostly important, oxidative stress induces an under-expression of the SIRT5 gene which is evident in all the cell lines, independently of quality and quantity of mtDNA. This is the first time that a regulation of SIRT5 gene transcription in response to stress is documented. Further studies are needed to clarify the significance of this result. In any case, our study may
open a new avenue in exploring the mitochondria-nucleus cross-talk in oxidative stress response.
LIST OF ABBREVIATIONS
AD Alzheimer Disease
ADP Adenosin Diphosphate
AF Activation Factor
ARE Antioxidant Response Elements
ATP Adenosin Triphosphate
ATP (6; 8) Adenosin Triphosphate synthetase subunits (6; 8)
BCL6 B-cell lymphoma 6 protein
bHLH basic Helix-Loop-Helix
bHLH-ZIP basic Helix-Loop-Helix/ Leucine Zipper
bHSH basic Heat Shock Factors
bZIP basic Leucine Zipper
CNC-bZIP Cap”n”Collar-bZIP subfamily
CO (I-III) Cytochrome c oxidase subunits (I-III)
DMEM Dulbecco’s Modified Eagle Medium
d-Rib 2-deoxy-D-ribose
ERC Extra-Chromosomal Circle
ETC Electron Transport Chain
FBS Fetal Bovine Serum
FOXO Forkhead Transcription Factors
GAPDH Glyceraldeide Phosphate Deydrogenase
GDH Glutamate Dehydrogenase
GPx1 Glutathione Peroxidase
H2O2 hydrogen peroxide
HD Huntington Disease
HO Heme Oxygenase
HSF Heat Shock Factors
HSP Heat Shock Proteins
HUMTH01-STR Short Tandem Repeat of Tyrosine Hydroxylase gene LHON Leber’s Hereditary Optic Neuropaty
MMP Mitochondrial Membrane Potential
MnSOD Manganese Superoxide Dismutase
MtDNA Mitochondrial DNA
MyoD Myogenic differentiation
NAD+ Nicotinamide Adenine Dinucleotide ND (1-6; 4L) NADH subunits (1-6; 4L)
NF1 Nuclear Factor 1
NFE2L1 Nuclear Factor Erythroid-derived 2-like 1 NFE2L2 Nuclear Factor Erythroid-derived 2-like 2
NFkB Nuclear Factor k B
NFKB1 Nuclear Factor of k light polipeptide gene enhancer in B cells 1
NO Nitric Oxide
NRF1 Nuclear Respiratory Factor 1
O2- Superoxide anion
OAADPr 2’-O-acetyl-ADP-ribose
OH- Hydroxyl Radical
OXPHOS Oxidative phosphorylation
PCR Polimerase Chain Reaction
PD Parkinson’s Disease
PGC1-α PPAR-γ co-activator 1α
PPAR-γ Peroxisome Proliferator-Activated Receptor γ RFLP Restriction Fragment Length Polymorphism
RF-X Regulatory Factor X
RNS Reactive Nitrogen Species
ROCK1 Rho kinase-1
ROS Reactive Oxygen Species
RR Retrograde Response
RT-PCR Reverse Transcriptase PCR
SIR Silent Information Regulator
SOD Superoxide Dismutase
TAD Trans-Activating Domain
TCA Tricarboxylic Acid
TFAM Mitochondrial Transcription Factor A
TMRM TetraMethyl Rhodamine Methylester
TNFα Tumor Necrosis Factor α
1. INTRODUCTION
1.1 Mitochondria and complex phenotypes
The increasing interest of researchers in disentangling the relationships between mitochondrial efficiency and complex phenotypes has highlighted the central role played by mitochondria in a wide variety of cellular pathways involved in age-related diseases, cancer, apoptosis and longevity. Mitochondria are the main site of cellular energy production: by oxidative phosphorylation (OXPHOS) they produce ATP, heat and also a series of toxic by-products termed Reactive Oxygen Species (ROS) which can damage mitochondrial DNA (mtDNA) and cells. Mitochondrial loss of function is considered the most common feature in aging and age-related diseases. In fact, dysfunctional mitochondria are characterized by decreased capacity to produce ATP, altered membrane potential and increased fragility (Navarro and Boveris, 2007). In particular, a selectively decrease in enzymatic activity of Complex I and IV has been observed in mitochondria isolated from rat and mice liver, brain, heart and kidney in the course of aging (Navarro et al., 2002; Navarro and Boveris, 2004; Zaobornyj et al., 2005). Moreover, dysfunctional mitochondria are observed not only in aging but also in some pathological situations where inflammation plays a pivotal role (Gonzalez-Flecha et al., 1993; Navarro and Boveris, 2004). Furthermore, a decrease of mitochondrial functionality due to alteration in respiratory chain complex activity has been observed in several neurodegenerative disorders such as Parkinson’s (PD), Alzheimer (AD) and Huntington (HD) disease (Emerit et al., 2004; Genova et al., 2004). On the whole, increasing evidences indicate that the capability of the organism to cope with oxidative stress factors by activating a mitochondria-to-nucleus signaling pathway plays an important role in complex phenotypes, including aging and age-related disease.
What is the role played by the mitochondrial genome in the above scenario? Several lines of evidence have demonstrated that complex phenotypes are influenced by mitochondrial genome information. In particular, both somatic and inherited mtDNA variability have shown a correlation with complex traits, and a relationship between mtDNA variability and mitochondrial functionality is quite well established (Wallace, 2005). In turn, this correlation is expected to imply an mtDNA-specific efficiency in stress response, likely mediated by mitochondria-to-nucleus signalling pathways. An
important experimental evidence in favor of this expectation has been recently reported: it has been demonstrated that the common mtDNA variability modulates gene expression of cytokines and cytokine receptors at both basal and stress conditions (Bellizzi et al., 2006). Cytokines belong to a family of proteins that have a key role in pathways of stress-response and that heavily contribute to the maintenance of cellular homeostasis. As a consequence, cytokines and cytokine receptors play a central role in several complex traits, including longevity, due to their involvement in regulating immunity and inflammation (Franceschi et al., 2005).
1.2 MtDNA and oxidative stress: an overview
MtDNA is a covalently closed-circular double stranded DNA molecule that encodes for a few genes only: two genes encode for rRNA 12S and 16S subunits, twenty-two genes for tRNAs, thirteen genes for structural proteins of the OXPHOS system. Seven of such proteins (ND1, 2, 3, 4L, 4, 5, 6) are subunits of complex I (NADH dehydrogenase); one (cytochrome b) is a subunit of complex III (bc1 complex), three (COI, II, III) are subunits of complex IV (cytochrome c oxidase) and two (ATP6, ATP8) belong to complex V (ATP synthetase). Furthermore, mtDNA lacks of introns or spacer regions, it has overlapping genes and a unique non-coding sequence, the D-loop region. Fig. 1.1 outlines the mtDNA molecule.
Figure 1.1: Human mitochondrial DNA map. The tRNA genes are identified by the single letter code and represented by cloverleaf structures (Garrese, R. and Vallejo, C.G. 2001).
MtDNA is replicated and transcribed within the mitochondrion. The mtDNA strands are named heavy (H) and light (L) on the basis of their GC content. Genome replication starts on the replication origin OH located in the D-loop origin, and proceeds
uni-directionally up to the second replication origin OL. The replication of the other strand
starts from the second replication origin OL and proceeds towards the opposite direction.
Mitochondrial genome replication is controlled by Polymerase γ that has both 5’→ 3’ polymerase activity and 3’ → 5’ exonuclease activity. MtDNA transcription begins on three different sites (ITH1, ITH2, ITL1), and the final product is a polycistronic message
further processed to monocistronic mRNAs. Among the regulator transcription factors, the most well characterized is mtTFA (TFAM gene) a polypeptide of the High-Mobility Group (HMG) DNA binding proteins family.
The mitochondrion produces energy by OXPHOS. The OXPHOS pathway oxidizes the hydrogen derived from carbohydrates and fats to produce heat and ATP. Carbohydrates
and fats are processed by Tricarboxylic Acid (TCA cycle) and fatty acid β-oxidation, respectively. OXPHOS involves a series of sequentially redox reactions along the different complexes (I-IV) that incorporate many electron carriers. Two electrons are donated by NADH + H+ and succinate to complex I and complex II, respectively. Then the two electrons are transferred first to complex III, then to complex IV and finally to ½ O2 to make H2O, thus forming a flow of electrons through the Electron Transport
Chain (ETC). The flow of electrons through ETC produces energy which is used to pump protons out of the mitochondrial inner membrane, thus producing a transmembrane electrochemical gradient ∆ψ. Finally, the protons flow backs into the matrix through an ion channel in complex V that uses the potential energy held in the electrochemical gradient to condensing ADP and Pi and releasing ATP. The balance in heat or ATP production is determined by the coupling or uncoupling of the electron flow with ADP phosphorylation.
The oxidative metabolism can produce extremely toxic molecules (ROS) because the unpaired electrons located in the first components of ETC can be donated directly to oxygen thus producing the superoxide anion O2-. The superoxide O2- is converted into
hydrogen peroxide (H2O2) by the mitochondrial enzyme manganese superoxide
dismutase (MnSOD) encoded by the nuclear gene SOD2. H2O2 can diffuse out of the
mitochondrion and be converted either to another reactive hydroxyl radical (OH-) or to a neutral component (water) by the cytosolic enzymes glutathione peroxidase (GPx1) or peroxisomal catalase.
ROS have harmful effects on cellular components. Free radicals can alter the transmembrane electrochemical gradient ∆ψ (Bertoni-Freddari et al., 1993); they can reduce the number of mtDNA copies (Barazzoni et al., 2000) and produce damage on the mitochondrial genome (deletion and point mutation) as well as on ETC mitochondrial enzymes (Cortopassi et al., 1992; Michikawa et al., 1999; Drouet et al., 1999; Fannin et al., 1999).
Efficient detoxification systems neutralize the toxic by-products before the reactive species damage mtDNA. In fact, a great part of the mtDNA oxidative damage observed in aging and age-related diseases is due to a non completely efficiency, or a failure, of the detoxification system. Under normal conditions, the ROS produced during respiratory metabolism are rapidly detoxified by different antioxidant proteins. In such a condition, the signalling pathways activated by oxidative stress are considered protective for cell integrity and survival (Storz, 2006). Little is known about the
molecules that function as sensor of oxidative stress, and what is the activated signalling cascade. It is currently assumed that activated transcription factors may modulate the expression of specific genes such as genes encoding for detoxifying enzymes. In fact, only a few detoxifying enzymes are constitutively expressed, while the expression of most of them is finely regulated.
One of the main consequences caused by oxidative stress is the age-related accumulation of mtDNA somatic mutations. In fact, growing literature data show that the accumulation of somatic mutations in mtDNAs of post-mitotic tissues plays a key role in age-related diseases (Chomyn and Attardi, 2003; Wallace et al., 2005). The decline of mitochondrial function due to the progressive accumulation of somatic mutations on mtDNA is at the basis of the mitochondrial theory of aging, that correlates stress and mitochondrial efficiency (Loeb et al., 2005). In fact, as mitochondria are the main site of both energy (ATP) and ROS production, the unbalance between the two patterns caused by mtDNA somatic mutations can induce sever mitochondrial dysfunctions, thus establishing a vicious cycle of ROS production. The excess in ROS production causes lipid peroxidation, protein oxidation and mutations due to oxidative modifications in both nuclear and mitochondrial DNA (Mohsen et al., 2005; Zhu et al., 2006). Increasing data indicate that mtDNA inherited variability plays a role in the scenario above described.
1.3 MtDNA inherited variability
MtDNA is characterized by a series of polymorphisms which identify different haplotypes (Merriwether et al., 1991). Phylogenetically related haplotypes can be clustered into different groups termed haplogroups that show a region-specific distribution (Torroni and Wallace, 1994). The classification of mtDNA haplogroups is based on information obtained by RFLP analysis of the coding region. As mtDNA is inherited maternally only, the absence of recombination allows to obtain the reconstruction of phylogenetical trees by which human population history can be highlighted. Based on this approach, phylogeographic studies have been performed by which the mtDNA of Homo Sapiens mtDNA has been assigned to Africa. Other lineages, arising from the ancient haplogroups and expanded out of Africa, gave rise to Eurasian haplogroups whose carriers colonized different continents by further
migrations (Cavalli-Sforza et al., 1994; Underhill et al., 2001). Today, different haplogroups have been identified in each continent (Torroni et al., 1994; Torroni et al., 1996; Olivieri et al.; 2006): three in Africa (L0, L1, L2, L3), seven in Asia (M, C, D, G,
E, A, B, F), nine in Europe (H, T, U, V, W, X, J, I, K). Moreover, new lineages (sub-haplogroups) which evolved from pre-existing haplogroups are continuously being discovered (Kivisild et al., 2006).
In a first time mtDNA inherited variants were considered neutral and were used only to reconstruct population history, but growing evidences show that haplogroup continent-specific differentiation are also the result of climatic adaptation consequent to climatic changes thus suggesting a non neutrality of the mtDNA common variability (Coskun et al., 2003). Indeed the idea of mtDNA haplotype neutrality had been already put in discussion when it was observed that mtDNA haplogroup J increases the penetrance of mutations causing the Leber’s Hereditary Optic Neuropaty (LHON), probably exacerbating some phenotypic defects (Torroni et al., 1997). The great part of LHON cases are associated with one of the main point mutations (G11778A, G3460A, T14484C) affecting genes encoding for complex I subunits. Although these mutations are usually homoplasmic, the severity of the pathologic phenotype is widely variable, thus implying the contribution of other genetic components (Carelli et al., 2003). On the whole, a series of studies investigating the possible correlation between mtDNA inherited variability and complex diseases (neurodegenerative diseases, cancer, diabetes, etc.) have changed the view of neutrality of the variants which determine the different haplogroups. For example, haplogroup J is over-represented in AD patients; while the same haplogroup is under-represented in PD patients (Chagnon et al., 1999; Van der Walt et al., 2003). In addition, significant associations have been observed between mtDNA haplogroups and longevity. For example, the J haplogroup frequency was higher in Italian centenarians than in younger people from the same population (De Benedictis et al., 1999); what is more, the over-representation of haplogroup J in nonagenarians and centenarians has been replicated in studies carried out in Irish and Finnish populations (Ross et al., 2001; Niemi et al., 2003) thus strongly suggesting that haplogroup J encompasses mtDNA haplotypes which predispose to longevity. The apparently contrasting results showing that haplogroup J is involved in both longevity and age-related diseases can be explained by considering the role played by mitochondria in energy and ROS production. Indeed, certain mtDNA haplotypes included in the J haplogroup may be characterized by a scarce OXPHOS activity that
may originate a critical energetic situation if other mutations are present in the genetic background. But, if a low OXPHOS efficiency increases ROS production it may also induce a response by nuclear genes coding for detoxifying enzymes that in turn prevents ROS damage thus favoring longevity. In other words, a fine balance between ROS production and anti-damage systems may be the key which opens the door to longevity or age-related diseases (Rose et al., 2002).
In line with the above considerations, it has been observed that different mtDNA lineages are characterized by mutations that are able to modulate the mitochondrial function. The idea of qualitatively differences among haplogroups is chiefly supported by studies highlighting a significant difference in the activity of complex I and IV between haplogroups H and T (Ruiz-Pesini et al., 2000). These data agree with the hypothesis that mtDNA inherited variability plays a role in complex phenotypes although it is likely that other factors, for example further loci with epistatic and pleiotropic effects, are involved.
In brief, mtDNA haplotypes could influence mitochondrial activity and function either directly by influencing OXPHOS efficiency and energy production, or indirectly by interaction with nuclear genes. The observation of non-random associations between mtDNA inherited variants and nuclear polymorphisms supports the idea of a correlation between nuclear and mitochondrial genome in modulating complex traits. One of the first evidences in this direction was provided by an association study showing that the HUMTH01-STR polymorphism is correlated with longevity (De Benedictis et al., 1998). The HUMTH01-STR polymorphism is a transcription regulatory element of the tyrosine hydroxylase gene (Meloni et al., 1998). It was observed that the STR long alleles (L) are under-represented in centenarians and that, in this segment of population, the mtDNA haplogroup U is not independent of the L alleles. This finding indicated that the U haplogroup may exert a protective role to improve the chance of longevity when other risk factors, such as the L allele of the HUMTH01-STR polymorphism, are present in the genotype (De Benedictis et al., 2000). A further evidence of the correlation between nuclear and mitochondrial genomes in modulating complex phenotypes has been provided by a study showing that in AD patients the U haplogroup is not independent of the APOE ε4 allele, a well known risk genetic factor in AD (Carrieri et al., 2001). Probably, the U haplogroup encompasses an mtDNA haplotype able to neutralize the detrimental effects of nuclear risk alleles by signals directed from
mitochondria to nucleus. On the whole, the above results highlight the importance of the cross-talk between the two genomes in modulating complex phenotypes.
1.4 The nuclear-mitochondrial cross talk and the retrograde response
All organisms during their life face a wide variety of intrinsic and extrinsic stress factors. The capacity of the organism to cope with stress plays an important role in determining the quality of aging (Troen, 2003). For a long time the anterograde regulation, which is based on transfer of information from nucleus to mitochondria, was the only known signaling pathway between nucleus and mitochondria. More recently, several literature data have highlighted a new type of inter-organelle communication that implies a transfer of information from mitochondria to nucleus. This intracellular signaling pathway, termed retrograde response (RR), represents a compensatory mechanism by which the cell is able to cope with mitochondrial dysfunction by up-regulating nuclear gene expression. The RR signaling pathway has been well characterized in the model organism S. cerevisiae. In yeast with defective mitochondrial function, also in totally respiratory-deficient cells lacking of mtDNA (rho0 cells), a variety of metabolic pathways are activated to restore the energetic cellular homeostasis (Jazwinski et al., 1996; Kirchman et al., 1999; Jazwinski, 2005).
In mammalian cells, although mechanisms of inter-genomic communication involved in mitochondrial biogenesis and function are well known, the existence of a signalling pathway similar to a retrograde response has been discovered only recently (Garrese and Vallejo, 2001). The first evidence of an RR pathway in mammalian cells, defined also as mitochondrial stress signalling, was described in C2C12 skeletal myoblasts (Biswas et al., 1999) and confirmed a few years later in human lung carcinoma A549 cells (Amuthan et al., 2002). Cells were treated with ethidium bromide that partially depletes mtDNA content or with mitochondria-specific ionophore CCCP (carbonyl cyanide m-chlorophenyl hydrazone). These treatments resulted in altered mitochondrial conditions, chiefly decrease of the membrane potential ∆ψm and increase of the
cytosolic free Ca2+, leading to altered expression of genes encoding for proteins involved in Ca2+ transport and storage (Biswas et al., 1999; Amuthan et al., 2001). Several other studies showed that a scanty production of energy, especially ATP synthesis, brings to significant changes in the expression of genes encoding for proteins
of the phosphorylation system (Marusich et al., 1997; Wang and Morais, 1997). Probably, also this intracellular signaling pathway is mediate by Ca2+ because a decrease of ATP production leads to altered cytosolic Ca2+ concentration that could induce the nuclear response (Biswas et al., 1999). In a more recent study, cells depleted of mtDNA (T143B, human osteosarcoma cell lines; ARPE19, retinal pigment epithelium cell lines; Kearns Sayre Syndrome fibroblast cell lines) were compared to wild-type parental lines (human fibroblast cell lines) as for the expression levels of 40 genes about. It was found that cells lacking of mtDNA respond to stress condition by modulating the expression of genes encoding for proteins involved in glucose metabolism and in pathways of stress response (Miceli and Jazwinski, 2005). Interestingly, a significant increase was observed in the expression level of the transcription factor MYC that acts on energy production by up-regulating glycolysis. Another important intra-mitochondrial signaling molecule is Nitric Oxide (NO) that produces superoxid anion, H2O2 and ROS. These toxic molecules may induce alteration
in mitochondrial membrane potential that in turn may activate a mitochondrial retrograde response (Brookes et al., 2002; Brookes et al., 2003). The NO molecule may exert its protective role against ROS and Reactive Nitrogen Species (RNS) damage by increasing the expression and the activity of the antioxidant protein Heme Oxygenase (HO). It was shown that NO increases both the HO-1 gene expression and the activity of HO in different types of cells such as glioblastoma, hepatocytes and aortic vascular cells (Motterlini et al., 2002). Moreover, bilirubin, a product of heme degradation by HO, protects the cell against the cytotoxic effects of the oxidants H2O2 and ONOO
-(Clark et al., 2000). The HO enzyme belongs to the family of Heat Shock Proteins (HSP) which exert a protective role in a wide variety of toxic conditions, not only in hyperthermia but also in redox alterations, exposure to heavy metals or cytotoxic drugs. Furthermore, it was demonstrated that NO can induce the activation of HSP (Calabrese et al., 2000).
On the whole, consisting data indicate that also in mammals as in yeast a mitochondria-to-nucleus signaling pathway may be activated in response to stress conditions. From this perspective, the sirtuin genes are good candidate as potential target of an RR response. The rationale for this statement is explained in the following paragraph.
1.5 Mammalian Sirtuins: sensors of mitochondria signaling pathways?
The SIR2-like genes family encodes for Silent Information Regulator proteins, all having a NAD+-dependent deacetylase activity. This gene family has emerged as a key regulator of longevity in all domains of life from yeast to mammals (Guarente, 2000). Sirtuins have a wide variety of substrates, by which they are involved in control of metabolism, transcription, apoptosis and cell survival. Several lines of evidences have suggested that the enzymatic activity of sirtuins could be regulated by the concentration of its co-substrate NAD+, thus suggesting that sirtuins are sensors of cellular energy and redox state of the cells. Moreover, the by-product of the NAD+–dependent deacetylation reaction can be a candidate for triggering intracellular signaling pathways (Michan and Sinclair, 2007). These considerations support the idea of a sirtuin involvement in mediating stress resistance, apoptosis and inflammatory responses that participate in physiological responses to toxicity. In fact, in a recent study it was demonstrated that, in rodents, Sir2α is involved in the regulation of cellular energy homeostasis and that Sir2α is critical to cope with oxidative stress to maintaining brain plasticity (Wu et al., 2006).
Sirtuins remove acetyl groups from acetyl-lysine- modified proteins thus regulating their biological function. The catalytic mechanism of deacetylation is characterized by hydrolysis of NAD+ molecule and production of a unique acetyl-ADP-ribose metabolite, OAADPr (2’-O-acetyl-ADP-ribose) plus one molecule of nicotinamide (Landry et al., 2000). The sirtuin deacetylase activity has been documented, at least in vitro, on both histones and transcription factors. This has important consequences as it regards the regulatory role exerted by sirtuin proteins on gene transcription. In fact, while histone deacetylation results in a global (non specific) reduction in gene expression (Egger et al.,2004), the non-histonic deacetylation results either in an activation (Brunet et al., 2004; Kobayashi et al., 2005; Rodgers et al., 2005) or in a de-activation (Vaziri et al., 2001; Langley et al., 2002; Yeung et al., 2004; Nemoto et al., 2005) of specific transcription factors. The final effect on the transcription of specific genes gets up from a fine balance between the above effects.
In addition to the deacetylasic activity, a mono-ADP-ribosyl transferase activity has been demonstrated at least for some sirtuins (Tanner et al., 2000). The NAD+ deacetylase and the mono-ADP-ribosyl transferase pathways are represented in Fig. 1.2.
Figure 1.2: Representative pathways of sirtuins enzymatic activity (Michan, S. and Sinclair, D. 2007).
Deacetylation
ADP-ribosylation
Increasing evidences indicate that NAD+ metabolism plays a key role in cell stress response pathways (Yang and Sauve, 2006). For example, the up-regulation of NAD+ biosynthesis has a protective effect during the genotoxic stress characterized by NAD+ pool depletion (Virag, 2005; Jagtap and Szabo, 2005). The stress response pathways regulated by sirtuins and activated coordinately with the up-regulation of NAD+ biosynthesis may be an important mechanism that enhances cell protection and survival. In fact, as NAD+ is required for their enzymatic activity, sirtuins may act as sensors of cellular energy and redox states; in this hypothesis, NAD+ may be a candidate for sirtuin-activated signaling pathways (Michan and Sinclair, 2007). Overall, these observations indicate that sirtuin family members are involved in cell defense systems. The SIR2 gene of S. cerevisiae was the first member of the sirtuin gene family to be discovered. In this model organism the formation of extra-chromosomal rDNA circles (ERCs) causes premature aging. It has been demonstrated that an extra copy of SIR2 extends replicative lifespan (while deletions of SIR2 reduce lifespan) by reducing ERCs
formation through the suppression of homologous recombination between rDNA repeats (Sinclair and Guarente, 1997; Kaeberlain et al., 1999).
In other model organisms, such as the worm C. elegans, over-expression of the ortologous gene Sir2.1 increases lifespan by activating the forkhead transcription protein DAF16 and modulating insulin-signalling pathway (Tissembaum and Guarente, 2001). Moreover, it is emerging that Sir2 is involved in crucial epigenomic events, such as chromatin silencing, DNA repairing, chromosome fidelity during meiosis (Blander and Guarente, 2004).
On the basis of phylogenetic analyses, sirtuins are classified into 5 classes as shown in Fig. 1.3.
Figure 1.3: Classification of mammalian sirtuins (Michan, S. and Sinclair, D. 2007).
Classes I and IV include eukaryotic sirtuins only; classes II and III include members present in both eukaryotes and prokaryotes; class U includes only sirtuins from Gram negative bacteria. The mammalian sirtuin family is constituted by seven genes named SIRT1-7 whose corresponding proteins are characterized by a conserved catalytic core domain of 275 aminoacids and a unique N-terminal and/or C-terminal sequences. The genes SIRT1, 2, 3 are included in class I, while SIRT4 and SIRT5 in class II and III, respectively; finally, class IV includes SIRT6 and SIRT7. The phylogenetic classification highlights that classes II, III and U evolved earlier than the other classes, then SIRT4 and SIRT5 may be the most ancient members of the mammalian sirtuin family (Frye, 2000).
As for cellular location, the proteins SIRT1, 6 and 7 have predominantly nuclear localization; SIRT2 is distributed exclusively in cytoplasm, while SIRT3, 4 and 5 have mitochondrial localization (Frye, 1999; Michishita et al., 2005). Literature data report
that SIRT1 has a robust deacetylase activity (Vaziri et al., 2001), SIRT4 and 6 have mono-ADP-ribosyl transferase activity (Liszt et al. 2005; Haigis et al., 2006), while SIRT2 and 3 show both these activities (North et al., 2003; Shi et al., 2005). Finally, the deacetylase activity of SIRT5 does not seem to be very strong (Michishita et al., 2005). As it regards the function of the mammalian sirtuins the data are scarce; however, the current understanding strongly indicates that mammalian sirtuins play an important role in age-related diseases and lifespan. In fact, increasing literature data describe a wide variety of aspects relevant to mammalian sirtuins that highlight their involvement in neurodegenerative diseases, inflammation, apoptosis, cancer and regulation of energy metabolism (Michan and Sinclair, 2007). In the following, the available information on sirtuin function and cell location will be summarized, paying particular attention to possible links between sirtuins and stress response.
SIRT1 is the most widely investigated member of the mammalian sirtuin family. SIRT1 deacetylates a large number of substrates, both histone and non-histone proteins, in such a way regulating a number of different cellular pathways. Experimental studies have highlighted the involvement of this protein in stress resistance and apoptosis pathways to promote cell survival (Chen et al., 2005). An important mechanism by which SIRT1 promotes cell survival in response to stress is the modulation of key regulatory factors such as p53, FOXOs, Ku70, NFKB. For example, three out of four members of the Forkhead transcription factors family, FOXO1, FOXO3a, FOXO4, are deacetylated by SIRT1. Oxidative stress induces FOXO4 acetylation, but SIRT1 can revert this process through FOXO4 deacetylation, thus enhancing the expression of proteins involved in growth arrest and DNA repair (Van der Horst et al., 2004; Kobayashi et al., 2005). One of most investigated biological effects of SIRT1 is that on apoptotic pathways. Actually, a key target of SIRT1 is the tumor suppressor factor p53. SIRT1 inhibits the trans-activation of p53 through deacetylation of its multiple lysine residues, and suppresses apoptosis in response to oxidative stress and DNA damage (Vaziri et al., 2001; Luo et al., 2001). Likewise, the deacetylation of Ku70 inhibits the pro-apoptotic Bax activity in response to stress (Cohen et al., 2004). Intriguingly, even though SIRT1 is involved in a large number of pathways that promote cell survival through inhibition of apoptosis, it may also promote apoptosis under certain conditions. For example, SIRT1 can deacetylate RelA/p65, a form of the transcription factor NF-kB, thus sensitizing human cells to apoptosis in response to TNFα (Yeung et al., 2004).
Apart from SIRT1 involvement in cancer and apoptosis, it is also involved in pathways that regulate differentiation of some tissues. It was observed that SIRT1 can modulate differentiation of B-lymphocytes through deacetylation of the transcriptional repressor BCL6 (Bereshchenko et al., 2002). Furthermore, SIRT1 can regulate negatively skeletal differentiation through the interaction with the muscle transcriptional regulator MyoD (Fulco et al., 2003). Finally, it was recently shown that SIRT1 plays a role also in neuronal protection and neurodegenerative diseases. The inflammatory response observed in AD patients is partially due to Aβ accumulation mediated by NF-kB signalling: it has been proposed that SIRT1 may reduce Aβ-stimulated neurotoxicity by inhibiting such signalling pathway (Chen et al., 2005). Moreover, SIRT1 seems to be involved also in preventing Aβ-peptide generation by inhibiting the Rho kinase1 (ROCK1) expression (Qin et al., 2006).
One of the most important sirtuin roles is the regulation of energy metabolism. Not only SIRT1 but also two mitochondrial sirtuins, SIRT3 and SIRT4, play a key role in regulating metabolism in response to dietary change (Michan and Sinclair, 2007). In particular, SIRT1 deacetylates a large number of target substrates involved in metabolic pathways. It acts on PPAR-γ to inhibit adipogenesis and to promote lipolysis and release of free fatty acids (Picard et al., 2004). SIRT1 can repress glycolisys and increase hepatic glucose release through deacetylation of PGC1-α, (Rodgers et al., 2005); moreover, it can promote both metabolic homeostasis and mitochondrial biogenesis (Lagouge et al., 2006).
SIRT2 is a cytoplasmic protein whose main target is α-tubulin (North et al., 2003). Probably because of this, SIRT2 plays an important role in the control of the cell cycle, and in a recent work it was suggested that SIRT2 may act as a tumor suppressor factor in human glioma (Dryden et al., 2003; Hiratsuka et al., 2003).
As for SIRT3, in a first time the location of this protein was believed to be restricted to mitochondria where it may act as a sensor of environmental inputs. Indeed, in brown adipose tissue it has been observed that, in response to cold exposure, SIRT3 promotes the expression of genes affecting the mitochondrial function such as PGC1-α and UCP1. In such a way SIRT3 modulates thermogenesis and reduces mitochondrial membrane potential and ROS production by decreasing cellular respiration (Shi et al., 2005). More recently, it was demonstrated that, under normal conditions, SIRT3 is localized within the nucleus and it is transferred into mitochondria in response to stress conditions (Scher et al., 2007).
As for SIRT4, it was recently shown that SIRT4 interacts with GDH, an enzyme which converts glutamate into α-ketoglutarate to activate insulin secretion in pancreatic β-cells. SIRT4 inhibits GDH activity by ADP-ribosylation thus reducing α-ketoglutarate and ATP production (Haigis et al., 2006).
The SIRT5 gene has been characterized only recently (Mahlknecht et al., 2006). Therefore, literature data on specific functions of SIRT5 are not available.
A direct involvement of the SIRT6 protein has been highlighted in DNA repair systems. It was observed that SIRT6 knockout mice are characterized by premature aging, probably because SIRT6 is able to regulate the base excision repair system that acts to repair DNA damage (Mostoslavsky et al., 2006).
Finally, SIRT7, nucleolar member of the sirtuin family, seems to be involved in cell proliferation. In fact, it is over-expressed in metabolically active cells, and it has been shown that SIRT7 is a component of the RNA polymerase I (Pol I) transcriptional machinery which promotes rRNA transcription (Ford et al., 2006).
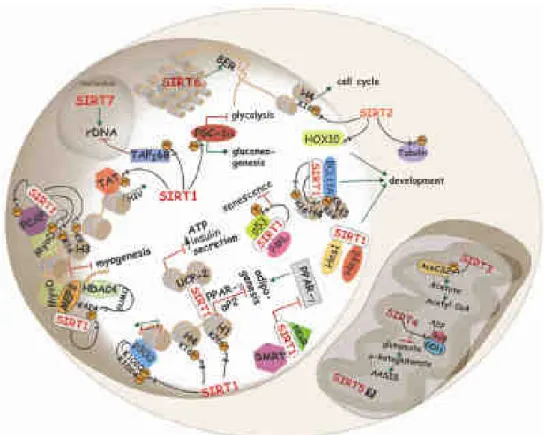
Fig.1.4 summarizes cellular function and distribution of mammalian sirtuins.
Figure 1.4: Cellular function and distribution of mammalian sirtuins; some examples of process regulated by sirtuins (Michan, S. and Sinclair, D. 2007).
1.6 Transcription Factors: sensors of mitochondria signalling pathways?
Transcription factors are proteins involved in controlling the transfer of genetic information from DNA to RNA. These proteins can interact with specific DNA sequences by using a protein region named DNA-binding domain and consequently can regulate, either enhancing or repressing, the expression of specific genes. These proteins are characterized also by a Trans-Activating Domain (TAD) that contains a binding site for other proteins, named transcription co-regulators or activation factors (AFs), which in turn can regulate transcription factors activity (Warnmark et al., 2003). Transcription factors are usually classified on the basis of the similarity of their binding domains. By this approach five super-classes are identified. Super-class 1, basic domain, includes the classes of factors bZIP, helix-loop-helix (bHLH), helix-loop-helix/ leucine zipper (bHLH-ZIP), NF-1, RF-X and bHSH; super-class 2, zinc-coordinating DNA-binding domain, includes the class of Cys4 zinc finger of nuclear receptor type; super-class 3, helix-turn-helix, includes the classes of homo-domain, Fork head/winged helix, Heat Shock Factors (HSF); super-class 4, beta-Scaffold Factors with Minor Groove Contacts; and finally the super-class named Zero that includes generally the other transcription factors (Stegmaier et al., 2004). These super-classes of proteins are involved in a wide variety of cellular pathways and, on the basis of their regulatory functions, they are classified into two groups: the transcription factors that are constitutively active as general transcription factors and the group of conditionally active factors that are activated by intra- or extra-cellular stimuli.
Intriguing clues of a possible relationship between mitochondria signalling pathways and gene expression of transcription factors push towards investigation. It is well known the role played by transcription factors in regulating genes encoding for mitochondrial proteins with structural or metabolic functions, as well genes involved in mitochondrial growth and development (NRF1) or in DNA replication and transcription (TFAM) (Scarpulla, 2002). Moreover, some transcription factors mediate signaling pathways involved in cellular homeostasis or in coping with mitochondrial alterations due to stress conditions. For example, NFkB is activated under both genetic (mtDNA depletion) and chemical (CCCP treatment) stress conditions (Biswas et al., 2003). In addition, the members of the CNC subfamily of bZip proteins modulate the expression
of antioxidant genes by interacting with antioxidant response elements (ARE) occurring in the DNA sequence.
An exhaustive description of all transcription factors that may be involved in mitochondrial signaling pathways is out of the aim of this thesis. In the following, essential information will be given only on the five transcription factors whose corresponding genes have been screened in the present work: Nuclear Factor Erythroid-derived 2-like 1 (NFE2L-1), Nuclear Factor Erythroid-Erythroid-derived 2-like 2 (NFE2L-2), Nuclear Respiratory Factor 1 (NRF1), Mitochondrial Transcription Factor A (TFAM), Nuclear Factor of kappa light polipeptide gene enhancer in B-cells 1 (NFKB1). All of them are conditionally active factors that have a pivotal role in protecting cells from different stress factors thus contributing to maintain cellular homeostasis and survival. The genes NFE2L-1 and NFE2L-2 are component of the Cap”n”collar-basic leucine zipper (bZIP) subfamily, termed also NFE2 family (Moi et al., 1994). These genes encode for transcription factors that are ubiquitously expressed in tissues, but whose expression is different in different tissues (Chan et al., 1996). The binding sequence of the NFE2 family shows high similarity to the antioxidant responsive element consensus sequence. In fact, NFE2L-1 and NFE2L-2 can form heterodimers with the Maf proteins to bind antioxidant responsive element-binding complex which modulate the expression of specific genes in response to ROS or oxidative stress (Wild et al., 1999; Alam et al., 1999). In addition, NFE2L-1 is involved in the regulation of the uncoupling protein-1 (UCP1) to mediate adaptive thermogenesis against cold exposure (Rim and Kozak, 2002).
The NRF1 gene is a member of the CNC family of bZIP transcription factors. This gene encodes for a protein that can activate genes involved in cellular growth, respiration, heme biosynthesis and mtDNA transcription and replication. NRF1 is a redox responsive transcription factors which is implicated in gene expression of TFAM and of several ETC proteins. It is a good candidate for linking nuclear and mitochondrial genome activity during mtDNA damage repair (Scarpulla, 2002). Furthermore, in association with Jun proteins, NRF1 can bind the Antioxidant Response Elements (AREs) of different genes thus inducing the up-regulation of ARE-mediated expression of detoxifying enzymes (Venugopal and Jaiswal, 1998). In a recent study it was demonstrated that fetal hepatocytes lacking of NRF1 show a great sensitivity to some stress factors such as tert-butyl hydroperoxide; as ROS can promote mitochondrial biogenesis and cell proliferation after oxidative stress (Suliman et al., 2003), the above
results suggest that NRF1 has an important role in maintaining redox balance in fetal liver cells and in protecting these cells from apoptosis in the course of development (Chen et al., 2003).
TFAM is an activator of mitochondrial transcription and a key participant in mitochondrial genome replication. It regulates the mtDNA copy number and seems to be essential for embryonic development. The relationship between mtDNA content and TFAM is founded on experiments showing that the expression levels of this gene reflect cellular mtDNA content (Davis et al., 1996; Suliman et al., 2003). The TFAM gene expression is regulated by a set of specific transcription factors among which the nuclear respiratory factors (NRF1 and 2) have the most relevant role (Virbasius and Scarpulla, 1994). In fact, promoter alignment studies have revealed that, in mouse and rat, the TFAM promoter region contains Sp1 and NRF2 recognition sites; indeed, a high level of Sp1 binding to the TFAM promoter region leads to over-expression of the gene (Rantanen et al., 2001; Dong et al., 2002).
An interesting link between TFAM transcription and stress response has been proposed. In a recent study the TFAM 5’region has been cloned and sequenced in rat hepatoma cells and a region has been identified that shows high homology with three 8-mer motif clusters for NRF1 recognition by human TFAM (Inagaki et al., 2000). The homology of sequence is in line with results showing that oxidative stimuli due to exogenous oxidants promote NRF1 phosphorylation and its nuclear translocation. NRF1 phosphorylation increases the capability of the protein to stimulate TFAM transcription, thus indicating that TFAM activity mediated by NRF1 stimulation is involved in protecting energy metabolism and mitochondrial integrity in stress conditions (Pintadosi and Suliman, 2006).
The NFKB1 gene encodes for a 105 kD protein, a Rel protein-specific transcription inhibitor, that can be processed by the 26S proteosome resulting in a 50 kD protein which is a subunit of the NF-kB protein complex. NFKB was originally identified as a regulator of expression of the kappa-Ig gene in B lymphocytes, but after that it was found that NFKB can be activated by a wide variety of intra- and extra- cellular stimuli as cytokines, oxidant-free radicals, ultraviolet irradiation in a broad range of cell types (Rabson and Weismann, 2005; Xiao and Ghosh, 2005). The activation of NFKB induces its translocation into the nucleus where it modulates the expression of different genes involved in a wide variety of biological functions. Chiefly, it was observed that NFKB activates both genes involved in anti-apoptotic function and genes involved in
modulating immune and inflammatory response, cell proliferation, adhesion and angiogenesis (Bernal-Mizraki et al., 2006). Moreover, NFKB is constitutively active in a variety of lymphomas, including Hodgkin’s and non-Hodgkin’s lymphomas, and a recent study has shown the role played by NFKB in pathways that confer resistance to apoptosis in lymphoma models (Bernal-Mizraki et al., 2006).
1.7 Aim of work
Based on the above observations, aim of the work was to investigate the existence of mitochondria-to-nucleus signals able to activate the transcription of genes encoding for sirtuins (SIRT1-7) and transcription factors (NFE2L1, NFE2L2, NRF1, TFAM, NFBB1) in response to oxidative stress. In particular, we focused our attention on the possible role played mtDNA variability in modulating the expression profiles of the above described nuclear genes at both basal and stress conditions. To reach this purpose we exploited the cybrid technology which is an useful approach to reveal possible pathways of communication between mitochondrial and nuclear genomes in response to stress. In fact, cybrid lines have the same nuclear genome but different mtDNA molecules because they are obtained from cells depleted of their own mtDNA and subsequently repopulated with mitochondria of different donors.
2. MATERIALS AND METHODS
2.1 Cell lines and culture conditions
143B.TK- osteosarcoma cells were grown in DMEM (Gibco) containing 4.5 g/l glucose and 110 µg/ml pyruvate, supplemented with 10% Fetal Bovine Serum (Gibco), 100 µg/ml 5-bromo-2’-deoxy uridine (Sigma) and 50 µg/ml gentamicin (Gibco). The rho0
cell line was obtained by culturing 143B.TK- in the routine growth medium containing 50 ng/ml ethidium bromide (0.22 µm-filtered) with regular replenishment of medium for about one month (King and Attardi, 1996). After ethidium bromide treatment, the cells were maintained in DMEM supplemented with 10% FBS, 100 µg/ml 5-bromo-2’-deoxy uridine and 50 µg/ml uridine (Sigma). At this stage the cells were plated at low density and individual clones were isolated. Both 143B.TK- and rho0 cells were cultured in a water-humidified incubator at 37° C in 5% CO2/ 95% air.
2.2 Experiments for quality control of mtDNA depletion
The complete depletion of mtDNA in rho0 cells was assayed by both auxotrophic test and PCR amplification of the D-loop mtDNA. i) For auxoptrophic test 6 x 10⁵ rho0 cells were grown in uridine-free DMEM supplemented with 10% dialysed FBS (Gibco) and 100 µg/ml 5-bromo-2’-deoxy uridine. Medium was changed at regular intervals (2 days). Cell survival was checked every 48 hours. ii) D-loop PCR amplification was performed with primers encompassing the mtDNA region comprised between nucleotides 15996 and 16401 bp:
primer forward 5’-CTCCACCATTAGCACCCAAAGC-3’; primer reverse 5’-TGATTTCACGGAGGATGGTG-3’.
2.3 Production of transmitochondrial cybrids
Transmitochondrial cell lines were obtained by the method of A. Chomyn (1996). Platelets were isolated by differential centrifugation from blood of five young donors, and the pellets were utilized to generate cybrids. Rho0 cells were collected by low-speed centrifugation, re-suspended in DMEM and counted. 106 rho0 cells were mixed with an equal number of platelets and the culture medium was eliminated by centrifugation. Cells were re-suspended for 1 minute in 0.1 ml of 42% polyethyleneglycol 1500 (Sigma). The fusion mixture was cultured in standard DMEM for 48 hours and then in
selective medium uridine-free DMEM supplemented with 10% FBS and 100 µg/ml BrdU. After 2-3 weeks in the selection medium, several distinct colonies emerged: 20 colonies were isolated by trypsinization in cloning rings and propagated. To ensure complete stabilization of the mtDNA amount, the functional assessment of selected clones was carried out only after at least 3 months of clone cycling.
2.4 MtDNA analyses
For both parental (143B.TK-) and cybrid cell lines, confluent 100-cm2 plates were trypsinized and total DNA was isolated by digestion with 1.5 mg/ml proteinase K in 10 mM Tris-HCl, pH 7.4/ 10 mM NaCl/ 25 mM EDTA/ 1% SDS at 37° C for 4 hours. Then, the DNA was extracted with phenol/chloroform, precipitated by ethanol, dried and re-suspended in TE buffer.
Haplogroup typing was used to verify whether the mtDNA of the cybrid lines was that of the donor platelets. By RFLP analyses of the coding region (Torroni et al., 1996) and D-loop sequencing (15996-16401 PCR fragment) the mtDNA of the native cell (143B.TK-) was classified in the X haplogroup, while those of the cybrid lines in the H, J, U, X and T haplogroups. Accordingly, the five cybrid lines were named H, J, U, X and T lines.
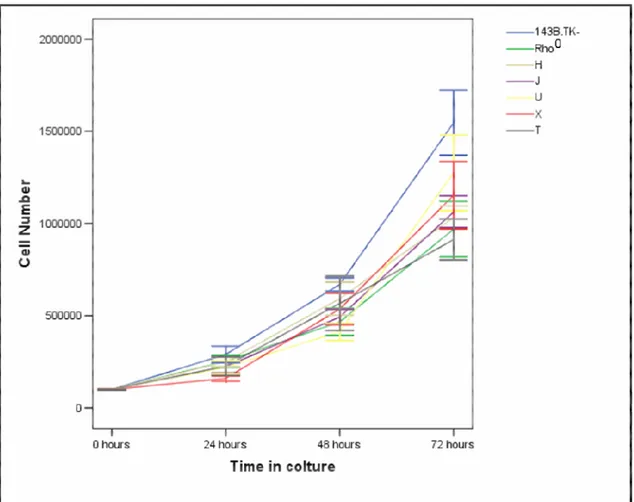
2.5 Proliferation assay
Parental and cybrid cell lines were seeded in 6-well plates (1 x 10⁵ cells/well) in regular growth medium. Cells were collected after 24, 48 and 72 hours culture by trypsinization, and counted in a haemocytometer with an inverted light microscope by using a 10x magnification. We replicated the assay thee times; then the average values with the relevant standard deviations were calculated.
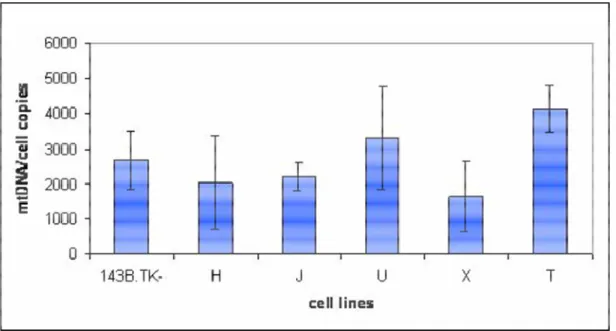
2.6 Quantification of mtDNA
Total DNA was extracted from 143B.TK-, rho0 and cybrid cell lines according to standard methods.
The mtDNA quantification in the cells was carried out by Quantitative Real Time-PCR analysis based on target-specific fluorigenic chemistries (TaqMan probes).
The TaqMan probe used to detect mtDNA amplified products was 5’-FAM-CCTCACGCAAGCAACCGCATCC- BlackHole Quencher1-3’. The TaqMan probe
used to detect nuclear amplified product was Genprobe (5’-Texasred-CTGTTCCGTTTCCTGCCGGTGCBlackHole
Quencher2-3’).
The sequence of primers specific for mtDNA were the following: - mtDir (5’- CACAGAAGCTGCCATCAAGTA-3’); - mtRev (5’-CCGGAGAGTATATTGTTGAAGAG-3’);
while the sequences of primers specific for nuclear genome, that amplify the FasL gene (present in two copies in the human genome) were the following:
- GenDir (5’-GGCTCTGTGAGGGATATAAAGACA-3’); - GenRev (5’-AAACCACCCGAGCAACTAATCT- 3’).
Both the two RT-PCR were carried out in a final volume of 20 µl and contained 1X PCR buffer (Promega, Madison, Wisconsin, USA), 3.0 mmol/l magnesium chloride, 400 pmol primers specific for mtDNA, 0.2 mmol/l dNTP, 2 U Taq polymerase (Promega) and the TaqMan probe.
The PCR was performed with an initial denaturation step at 95° C for 6 minutes followed by 45 cycles of 94° C for 30 seconds and 60° C for 1 minute, in an iCycler Thermal cycler (BioRad, Hercules, California, USA). All samples were analysed in triplicate.
The relative number copies of mitochondrial and nuclear DNA was detected by using a standard curve for each PCR. The regions used respectively for mtDNA and nuclear DNA amplifications were cloned tail to tail in a vector (pGEM-11Z; Promega) to obtain a 1:1 ratio of the reference molecules. The serial known dilutions of this vector were included in each PCR and amplified in triplicate to obtain the standard curve.
The measured values for mtDNA and nuclear DNA were distributed in the range of the standard curve and the correlation coefficient was always > 0.995. The absolute values of mtDNA copies per cell were calculated as the ratio between the relative values of mtDNA and nuclear DNA (obtained versus the same vector), multiplied by 2 (as two copies of the nuclear gene present are in a cell).
2.7 Mitochondrial membrane potential (MMP) assay
Mitochondrial membrane potential (MMP) was assessed by double staining with MitoTracker GreenTM (MTG, specific for mitochondrial mass) and TetraMethyl Rhodamine Methylesther (TMRM, specific for MMP) (Molecular Probes, Eugene, OR, USA). 143B.TK-, rho0 and cybrid cells were seeded in 6-wells plates (2 x 10⁵
cells/well). After 24 hours, the cells were stained with MTG 100 nM and TMRM 150 nM for 20 minutes at 37° C, then collected and analysed by flow cytometer. Cytofluorimetric analyses were performed by using a Becton Dickinson NJ (FAXscan). The data obtained by cytofluorimetric analyses were analysed with WinMDI software.
2.8 Oxidative stress treatment
143B.TK-, rho0 and cybrid cells were seeded in 100-cm2 plates (2 x 10⁵ cell/plate). In the exponential growth phase, the growth medium was discarded and replaced with DMEM containing 2-deoxy-D-ribose (d-Rib) 20 mM (Sigma). The cells were incubated to 37° C for 24, 48, 72 hours. Untreated cells were analysed as control in all subsequent experiments.
2.9 Cell viability assay
We analyzed the viability of cell lines at basal and stress condition by a Trypan blue exclusion assay.
Floating and adherent cells were collected and 200 µl of cellular suspension were added to an equal volume of 0.4% Trypan Blue solution (Sigma). Viable and non viable cells were then counted by using a haemocytometer with an inverted light microscope using a 20x magnification.
For each cell lines three experiments were carried out, and standard deviations were calculated. The percentage of cell viability was calculated as the ratio between the number of viable cells and the total number of cells.
2.10 DNA fragmentation analysis
Treated and untreated cells were collected by trypsinization and centrifuged at 3000 x g for 5 minutes. The pellet was resuspended in 400 µl of lysis buffer containing 10 mM TRIS-HCl pH 8, 20 mM EDTA, 0.2% triton-X100, and then incubated on ice for 20 minutes. The mixture was centrifuged at 12000 x g for 20 minutes, then an equal volume of phenol/chloroform was added to the surnatant. After a centrifugation at 12000 x g for 5 minutes, an equal volume of chloroform was added to the surnatant and centrifuged again at the same conditions. Then 0.1 volume of 3 M Sodium Acetate pH 5.2 and 2 volumes of ethanol were added to surnatant to precipitate DNA. The mixture was stored at -20° C overnight. DNA was pelleted by centrifugation at 12000 x g for 20 minutes, rinsed with 70% ethanol and then resuspended in TE buffer containing 100
mg/ml RNase A. The DNA samples were incubated at 37° C for 1 hour, analyzed by electrophoresis on 1.5% agarose gel, in TAE buffer and stained with ethidium bromide.
2.11 RT-PCR of human SIRT genes
Total RNA was extracted from treated and untreated cells by using RNeasy Mini Kit (Qiagen). The RNA concentration of each sample was measured by using a biophotometer Bio-Rad at 260/280 nm absorbance ratio.
The RT-PCR (Reverse Transcriptase-PCR) reactions were carried out by using the ImPromII Reverse Transcription System kit (Promega). Firstly a mix containing 500 ng of total RNA and 500 ng of Oligo(dT)15 Primer, was pre-heated at 70° C for 5 minutes, then the RT-PCR reaction was carried out in a 40 µl of final volumes containing 1X ImProm-II 5X Reaction Buffer; 300 µM of MgCl2; 125 µM of each dNTP of dNTP mix;
10 U of Recombinant RNasin Ribonuclease Inhibitor; 0,15 µl of Reverse Transciptase. The reaction mix was incubated at 25° C for 5 minutes, at 37° C for 60 minutes and finally at 95° C for 10 minutes to inactivate the Reverse Transcriptase enzyme.
For the analysis of SIRT genes we designed primers specific for each sirtuin by using “AutoPrime” program available on the web (http://www.autoprime.de/AutoPrimeWeb). The primers were selected in two different manners so that they amplify cDNA generated from mRNA but do not amplify a product on the genomic DNA:
a) one of the primers matched the exon-exon border sequence that is not present on the genomic DNA;
b) both the primers matched two different exon sequences so that a genomic product may include a long intronic sequence.
Furthermore, we designed as internal control the primer specific for the GAPDH housekeeping gene. The sequences of selected primers are shown in Table 2.1.
Table 2.1: Primers used in RT-PCR analysis of sirtuin genes.
Primers Forward Primers 5’→3’ Reverse Primers 5’→3’
GAPDH GACAACTTTGGTATCGTGGA TACCAGGAAATGAGCTTGAC
SIRT1 GAAGACGACGACGACGAG GCCACAGTGTCATATCATCC
SIRT2 AAGGAGCGTCTGCTGGAC AGATGGTTGGCTTGAACTGC
SIRT3 ATGGAACCTTTGCCTCTG CAAGTCCCGGTTGATGAG
SIRT4 ATGTGGATGCTTTGCACACC TGGCCTCCACATTGAACGCA
SIRT5 AGGAGCTGGAGGTTATTGG CAGCCACAACTCCACAAG
SIRT6 ACTTCAGGGGTCCCCACG TCGGCGTTCCTGCTGGCC
SIRT7 GAGCAGACACCATCCTGTGT ACAGCGACTTCCGACTGTGG
The PCR mixture (25 µl of final volume) contained 1 µl of cDNA, 1X Reaction Buffer, 2 mM MgCl2, 1.5 U Taq Dinazyme and different amounts of the other PCR components
as reported in Table 2.2.
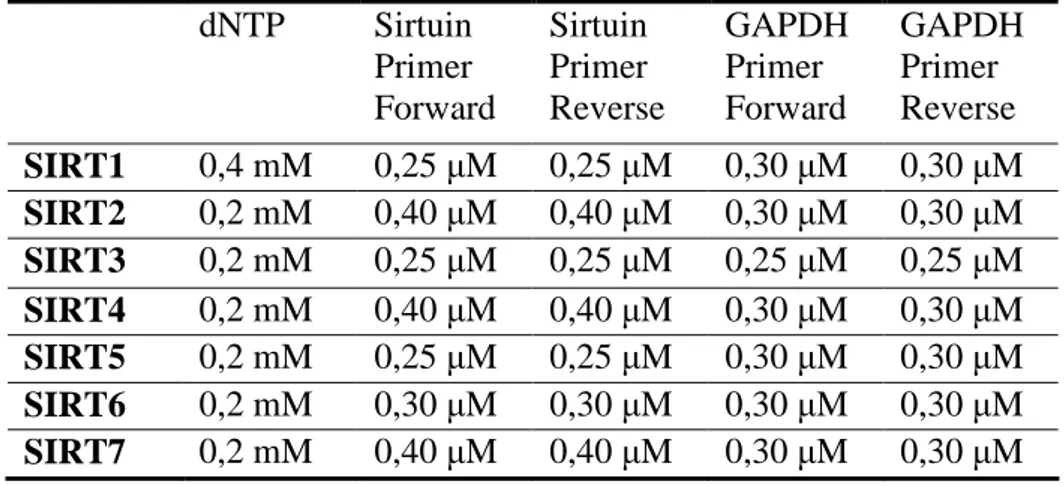
Table 2.2: PCR protocols of each analyzed sirtuin.
dNTP Sirtuin Primer Forward Sirtuin Primer Reverse GAPDH Primer Forward GAPDH Primer Reverse SIRT1 0,4 mM 0,25 µM 0,25 µM 0,30 µM 0,30 µM SIRT2 0,2 mM 0,40 µM 0,40 µM 0,30 µM 0,30 µM SIRT3 0,2 mM 0,25 µM 0,25 µM 0,25 µM 0,25 µM SIRT4 0,2 mM 0,40 µM 0,40 µM 0,30 µM 0,30 µM SIRT5 0,2 mM 0,25 µM 0,25 µM 0,30 µM 0,30 µM SIRT6 0,2 mM 0,30 µM 0,30 µM 0,30 µM 0,30 µM SIRT7 0,2 mM 0,40 µM 0,40 µM 0,30 µM 0,30 µM
After a pre-denaturation step at 92° C for 1 minute, 28-35 cycles (the number of cycles was different for each sirtuin) were carried out at 92° C for 1 minute, 60° C for 1 minute and 72° C for 1 minute. The GAPDH primers were added after an appropriate number of cycles varying from 5 to 9.
The PCR products were analyzed on 2% agarose gel containing 0,5 mg/ml ethidium bromide. Fluorescence intensity of the bands was calculated by using densitometer analysis (Kodak Electrophoresis Documentation and Analysis System 290, EDAS 290), and then normalized with respect to GAPDH band intensity (Relative Band Intensity, RBI).
We carried out three independent RT-PCR experiments for each cell line, and then we calculated standard deviations.
2.12 RT-PCR of Tanscription factors genes
The primers designed for the semi-quantitative PCR analysis of Transcription factors are reported in Table 2.3.
The PCR mixture (25 µl of final volume) contained 1 µl of cDNA, 1X Reaction Buffer, 2 mM MgCl2, 200 µM of each dNTP, 0.8 µM of each forward and reverse primer, 0.4
µM of each GAPDH primer, 0.5 U Taq DNA polymerase (EuroTaq).
The PCR were performed at the following conditions:
- For TFAM and NFE2L2 genes, after a pre-denaturation step at 92° C for 1 minute, twenty-five cycles of PCR were carried out at 92° C for 30 seconds, 58° C for 30 seconds and 72° C for 1 minute; the GAPDH primers were added at the first cycle of the PCR;
- For NFE2L1, NRF1, NFKB genes, after a pre-denaturation step at 92° C for 1 minute, thirty cycles of PCR were carried out at 92° C for 30 seconds, 58° C for 30 seconds and 72° C for 1 minute; the GAPDH primers were added after the fifth PCR cycle.
Table 2.3: Primers used in RT-PCR analysis of Transcription factors genes.
Primers Forward Primers 5’→3’ Reverse Primers 5’→3’
GAPDH GACAACTTTGGTATCGTGGA TACCAGGAAATGAGCTTGAC
NFE2L1 CGGCTCCTCAGTCAGGTGAG CCAGATCAATATCCTGTCGCC
NFE2L2 CATCGAGAGCCCAGTCTTCA GGAGAGGATGCTGCTGAAGG
TFAM TGCTGAGTGCCCTGGGAAGG ATACCTGCCACTCCGCCCTA
NRF1 TCGTGTGGGACAGCAAGCTA CCCGACCTGTAGAGTACTTG