Université Pierre et Marie Curie
Universita’ della Calabria
Ecole doctorale 38PM
Ecole doctorale «
Physique et Chimie des Materiaux
»
Dipartimento di Fisica, Universita’ della Calabria,
Institute des Nano Sciences de Paris
Auto-assemblage de défauts structurels et de nano-objets
dans des films cristaux liquides
Self-assembly of structural defects and nano-objects in liquid crystal films
Par: Iryna Gryn
Thèse de doctorat de physique
Dirigée par M. Bruno Zappone et Mme. Emmanuelle Lacaze
Présentée et soutenue publiquement le 21 décembre 2015 Devant un jury composé de :
Zappone, Bruno (directeur de thèse)
Lacaze, Emmanuelle, (co-directrice de thèse) Carbone, Luigi
Bellini, Tommaso Bramati, Alberto
Blach, Jean François (Rapporteur) Doru, Constantin (Rapporteur)
Univeristé Pierre et Marie Curie, Paris (France) Co-supervisore: Prof.ssa Emmanuelle Lacaze
1
Acknowledgments
Here I would like to express my great appreciation to the people, whose contribution made this thesis possible. First of all I would like to thank my supervisor Dr. Bruno Zappone for his continuous assistance, for all fruitful discussions and for his patient encouragement to my development as a scientist. His intellectual support throughout my study and research allowed me to overcome a lot of challenging problems and successfully cope with formulated research directions. The completion of this thesis would not have been possible without his generous efforts.
I greatly appreciate my co-supervisor Prof. Emmanuelle Lacaze for her vast knowledge and skills in many areas, assistance at all levels of my research. She introduced me into the field of X-ray diffraction, Plasmon resonance, dark-field microscopy and so on. Without her contribution in analysis of the data, discussions and interpreting of the results I may not have ever pursued this challenging area of physics. Working in the Institute des Nano-Sciences de Paris under her supervision significantly enriched my experience and I owe her my sincere gratitude.
I am also very grateful to all people who were involved in my scientific activity, especially to O. Marchenko for his teaching me the first knowledge about liquid crystals and supporting during the entering to the graduate school. Many thanks also go to Maria. P. De Santo and Gia Petriashvili for the help with spectrometer measurements and fruitful discussions; Michele Giokondo and Tiziana Ritacco for supporting me with confocal fluorescent microscopy and nanoscribe facilities; Pasquale Pagliusi for providing OTS and helping with the polarizing optical microscopy; Carlo Versace for the help with ITO sputtering; Michel Goldman and Denis Limagne for instructing me about X-ray diffraction, setup installation and its following exploitation; Olivier Plucheri for his help with LSPR measurements. Your collaboration with me was my pleasure and honor. I sincerely hope to have a chance to collaborate with you in my future research career.
The most of all I would like to thank my family for the support they provided me through my entire life. During all this years your advises and personal examples were the most important driving force for me. Thank you for your love, for the understanding and for the patience.
2 At last but not least I would like to thank for the financial support of my research activity provided by PhD scholarship from Graduate School “Bernardino Telesio”, Joint French-Italian PhD program (Cotutela) with the Université Pierre et Marie Curie and Eiffel excellence scholarship program.
3
Index
Acknowledgments ... 1
Index ... 3
Introduction ... 5
1. Structure, energy and defects of the smectic phase ... 16
1.1. The ground state of nematic and smectic liquid crystals ... 16
1.2. The nematic phase: order parameter, ‘ground’ state and elasticity ... 18
1.3. The smectic-A phase... 20
1.3.1. Ground state and order parameter... 20
1.3.2. Distortions and elasticity of the smectic A phase ... 21
1.3.3. Analogy with superconductors ... 22
1.3.4. Confocality ... 24
1.4. Topological defects ... 25
1.4.1. Defects of the nematic phase ... 26
1.4.2. Elementary defects of the smectic phase ... 27
1.4.3. Confocal domains: focal conics and oily streaks ... 31
1.4.4. Grain boundaries ... 35
1.5. Surface anchoring ... 37
1.6. Coupling with external fields ... 39
1.7. The effect of inclusions on the LC order ... 42
2. Materials and methods ... 44
2.1. Smectic materials ... 44
2.2. Functional molecules and nanoparticles ... 46
2.2.1. Small fluorescent molecules ... 47
2.2.2. Semiconductor nanocrystals ... 48
2.2.3. Plasmonic metallic nanoparticles ... 51
2.2.4 Mixing particles with liquid crystals ... 54
2.3. Surface alignment of liquid crystal materials ... 54
2.4. Sample and cell fabrication ... 57
2.4.1. Sessile droplets and spin-coated films ... 57
2.4.2. Closed cells ... 58
2.5. Optical microscopy ... 62
2.5.1. Multiple-beam interferometry for thickness measurements ... 62
2.5.2 Polarized optical microscopy (POM) and compensation ... 63
2.5.3 Fluorescence Confocal Polarized Microscopy ... 64
2.5.3 Dark-field microscopy (DFM) ... 67
3. Closed cells with hybrid anchoring conditions ... 69
3.1. Field-off patterns ... 70
3.2. Field-on patterns. 8CB... 76
3.3. Field-on patterns. SCE12 ... 83
3.4. Texture persistence and bistability ... 84
Conclusions ... 86
4. Planar cells and generality of the 1D/2D transition ... 88
4.1. Survey of pattern formation for various liquid crystals and hybrid anchoring conditions ... 88
4.2. Period vs. thickness curves ... 93
4
4.4. Origin of the 1D/2D transition ... 103
Conclusions ... 108
5. Isotropic and anisotropic nanocrystals in smectic liquid crystal defect patterns ... 110
5.1. Nanoparticle alignment in the absence of fields ... 111
5.2. Nanoparticle alignment in the presence of a field ... 117
5.3. The effect of the NP size and concentration on SmA textures ... 121
5.3.1. Small NPs (m ≤ 10 nm) ... 123
5.3.2. Large NPs (m = 40 – 50 nm) ... 127
5.3.3. Dark field microscopy (DFM) measurements ... 131
Conclusions ... 132
General conclusions ... 134
5
Introduction
The development of nanotechnology over the last decades has drawn the attention of both scientists and engineers to the self-assembly of matter into ordered structures at micro- and nanometer scales. The term “self-assembly” is used to describe the phenomenon of spontaneous organization of particles or building blocks into larger structures and patterns via specific interactions. Self-assembly is an equilibrium thermodynamic process where a balance is established between repulsive and attracti ve forces, and the free energy of the assembled system is lower than that of the random structure1.
Self-assembly of small units into large-scale functional structures is one of the defining features of biological systems: collagen proteins are assembled in long robust fibers in bones and cartilage, lipids form bilayers in vesicles, cell me mbranes and myelin sheaths, and mineral particles combine with proteins to form the bright opalescent coating of sea shell, keratin can self-assemble into hair, DNA and viruses can spontaneously fold into functional 3D structures of complex topology2-4. The vast majority of biological systems, like for instance, single cells or tendons also exhibit hierarchy5,6, that is the ability to generate ordered structures over multiple length scales and, in principle, multiple contributions to properties. This natural phenomenon has stimulated researchers to fabricate synthetic hierarchical materials mimicking natural analogies.
Self-assembly and the ability to generate order from the “bottom up” (i.e from building blocks to large-scale structures) is in contrast with the traditional approach to the fabrication of micro- and nano-structured materials and devices. In the “top-down” approach, nano- objects are either individually manipulated or organized using ordered matrices and hosts that are microfabricated. Lithographic methods, such as ultraviolet, X -ray, zone-plate array lithography, ion and electron beam lithography are commonly used to create sub-micron size 1D or 2D reliefs7-10. 3D photonic crystals can be produced by
interference lithography11. Scanning probe microscopy such as atomic force microscope
(AFM) or scanning tunneling microscope (STM) are used to fabricate patterns with smaller units12, approaching the atomic level resolution13. A (5–50) nm resolution can be achieved by nanografting, dip-pen and nano imprint techniques14.
6 Although lithography provide a high precision in nanoscale fabrication, it is time -consuming and expensive in terms of equipment and specialized personnel. On the other hand, the self-assembly “bottom-up” fabrication is typically achieved using standard bench-top equipment and inexpensive organic materials, can be a quite rapid and sometimes reversible process. The inherent capacity to self-assemble into nanostructures is exhibited by many soft materials, including colloids15-17, surfactants18-21, membranes
22-25, biomaterials26-28, polymers29-32, their composites33,34 and liquid crystals (LC)35-39. The
thermodynamic stability of self-assembled soft materials is typically based on weak molecular interactions40, such as van der Waals interaction, dipolar and quadruple interactions, hydrogen bonding and electrostatic interactions, which can also be often find in living systems41. The weak nature of interactions results in flexibility of the formed
systems, allowing rearrangements of the structures in response to small perturbations or stimuli imposed by the external environment. The latter feature is of the great interest from both fundamental and application standpoints, giving a possibility to control the assembly process and thus properties of created structures by varying external parameters.
The thermodynamics of the self-assembly process can be described at constant temperature T and pressure by a Gibbs free energy equation: ΔG = ΔH – TΔS. The enthalpy change ΔH is mainly determined by intermolecular interactions between the structural parts of assembling system, and ΔS is due to the appearance of order, i.e. a decrease of symmetry changes in ordered structure formation. The self-assembly is spontaneous in the sense that ΔG is negative42. Small structural units will nucleate and
grow and their life-time increase as they minimize the system free energy via increasing attractive forces between the units, till the equilibrium state is achieved and the nanoordered structure is formed.
From the fundamental point of view liquid crystals (LCs) are representative materials for investigating self-assembly processes in soft matters. Their structural architecture resembles many biological objects, such as proteins, viruses, lipids, fibers, amyloids, carbohydrates and nucleic acids41. LCs show spontaneous breaking of symmetry and topological defects in close analogy with phenomena studied in cosmology, fundamental particle theories and condense matter physics43. The molecular organization
7 respectively for thermotropic and lyotropic LCs44. As the temperature of a thermotropic LC is decreased, the symmetry of the material varies from the continuous orientational and transitional symmetry of isotropic liquids to discrete crystalline symmetry, passing through various “mesophases” with intermediate symmetries. A mesophase spontaneously breaks one or more symmetries of the phase at lower temperature. Symmetry breaking can be described by introducing an order parameter and is characterized by the appearance of topological defects - points, lines and surfaces – where order id deeply altered or removed42. The observation of defect formation and evolution in LCs provides theoretical and optical models for numbers of existing systems, from elementary particles to small biological cells and viruses. It is believed that symmetry breaking occurred in the early universe and defects such as strings, vortex lines and walls were formed, seeding the giant objects of today’s universe43.
From a technological point of view, it is hard to imagine the modern world without LCs. Since their discovery in 1888 by Friedrich Reinitzer and the invention of the twisted nematic field-effect in 1970 by George H. Heilmeier45, LCs have become part of our daily
life, being widely utilized in technological devices, such as thin flat displays, d igital watches, calculators, smart windows, thermometers, various sensors and solar cells46-51.
LCs are also used for optical imaging and recording52, in optical fibers53-57, in photonic integrated circuits58,59 and as lasing media60-62.
The popularity of LCs is due to the anisotropy of their optical, electromagnetic and mechanical properties and thus anisotropic respond of the materials. LC are made of anisometric molecules that show positional and orientational order. Molecules can be aligned along specific directions using suitable boundary conditions and external fields. Therefore, for instance, a typical LC display works on the principle of blocking light, exploiting a possibility to reorient LC molecules by electric field. A display consists of many small panels (pixels) and each pixel includes a twisted LC sandwiched between two polarized plates coated with transparent electrodes and oriented in a way that polarized light can pass through it. An electric field application to a particular pixel makes LC molecules to align with a field (to untwist), so that the light will not be able to pass and the area will become dark compared to others44,63.
In some cases, the distortions induced by boundary conditions and external fields result in an extensive nucleation of topological defects 44 that self-assemble in large-area
8 patterns42. Examples are schlieren and marble textures in nematics (Nem); oily streaks, Grandjean and fingerprint textures in cholesterics (N*); linear and focal conic domains in smectics (Sm) and many others64. Among them, smectic A (SmA) are of the particular interest, being periodic materials with structural units with size ranging from the nanometer to micron scale. In SmA LC, defect patterns can be easily created over areas as large as a few mm2 by a rapid self-assembly process which makes them good candidates for the mass-production of periodic templates to be used in various applications65.
In this thesis we will consider SmA LCs composed of rod-like molecules that tend to align parallel to each other along a common director n (a unit vector describing the average local molecular orientation) and arrange in parallel equidistant layers perpendicular to n40,44. The orientation of n is determined by anisotropic interactions with
boundaries (anchoring) and/or external stimuli (electric and magnetic fields ). SmA LCs have long been known to create periodic defect arrays when confined under incompatible boundary conditions in thin films and droplets. In this case, the n field must be distorted and the layers have to bend to satisfy the boundary conditions (Fig. I.1). The requirement that the layer spacing is unchanged44 can be satisfied by creating defect domains known as
focal conic domains (FCDs). Pattern formation is due to FCD nucleation and self -assembly into close-packed arrays42,44.
Figure I.1: Schematic illustration of smectic layers bending to satisfy incompatible
boundary conditions imposing parallel (planar) and normal (homeotropic) alignment of the director n. c and v are topological defects, i.e. singularities where the layer curvature is undefined.
Axially symmetric toroidal FCDs and 2D hexagonal lattices (Fig. I.2) have been observed when SmA films were subjected to normal (homeotropic) and parallel (degenerated planar) anchoring with no preferential in-plane direction being induced. The
9 pattern formation was achieved by depositing LC films in air on isotropic liquids66,67, solid surfaces68,69, or by sandwiching between solid plates70.
Figure I.2: (a) Schematic illustration of a toroidal FCD71 with line defects H and E. The arrows indicate the director n orientation. (b) Close-packed hexagonal lattice of FCDs. Red and blue lines correspond respectively to line defects H and E in (a). (c) Optical micrograph of FCD lattice at the interface between air and a solid surface treated to induce planar anchoring. The inset shows a magnification72.
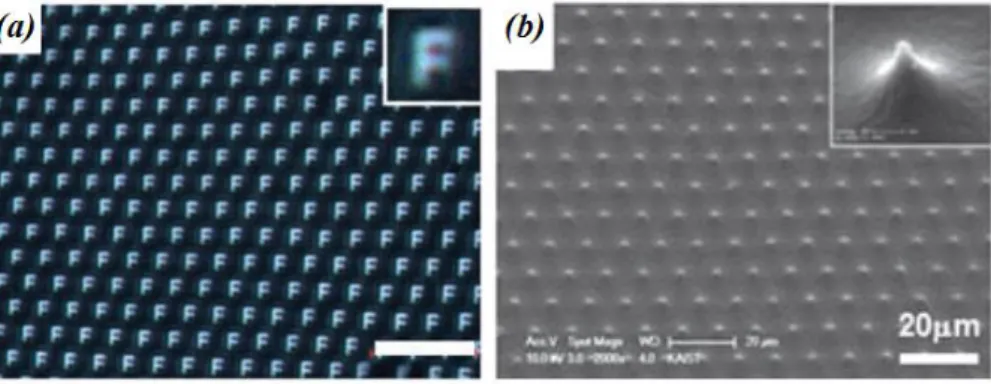
Large-area self-assembled FCD patterns have been successfully employed for fabricating templates for soft lithography72, microlens arrays of dimple and conical
10
Figure I.3: (a) Optical microscopy image of letter “F” projected through an array of
toroidal FCD microlenses73. (b) Scanning electron microscope image showing a polymer
replica of the FCD array, used as superhydrophobic surface65.
Linear domains (LD) can be created when the anchoring is planar unidirectional, i.e. there director tends to orient along a preferential direction at the aligning surface (Fig. I.4). LD contain curved smectic layers wrapped around straight disclinat ion lines (Fig I.4 (a)). They have been observed for the first time by E. Lacaze and co-workers at CNRS-INSP for thin films of the SmA LC compound 8CB at the interface between air (imposing homeotropic anchoring) and crystalline molybdenum disulfide (MoS2, imposing planar
anchoring)39.
Figure I.4: (a) Schematic illustration of a LD array formed perpendicular to the planar
anchoring direction (indicated with arrow) in a thin film. c and v are topological defects, disclination lines and curvature walls respectively. (b) POM image of LD arrays in a 8CB droplet deposited MoS239. The inset shows an AFM image of LC surface topography. (c)
The transition between LD array and FCD lattice in droplet of 8CB deposit ed on mica74.
Similar 1D patterns were later observed in 8CB film deposited on crystalline mica (Fig I.4 (c))74,75 and on rubbed polymer surface of PVA (polyvinyl alcohol)76,77. A general feature of LD arrays is that their period increases when the film thickness inc reases, until LDs are replace by a FCD lattice.
11 From the study of LC defect pattern a promising idea has recently emerged: Combining the anisotropic properties of LCs with those of nanoscale objects such as colloids and nanoparticles (NPs), including quantum dots, nanotubes, graphene ribbons and flakes, may allow the development of new nanostructured functional materials. It is known that properties of NP differ significantly from those of bulk materials and are dependent on the NP size and shape78-82. These properties can be tuned also by putting NPs in mutual interaction in a matrix, template or host with defined struct ural properties. Because of their order and responsivity, LCs are suitable candidates for guiding the assembly of colloids and NPs into well-defined spatial patterns.
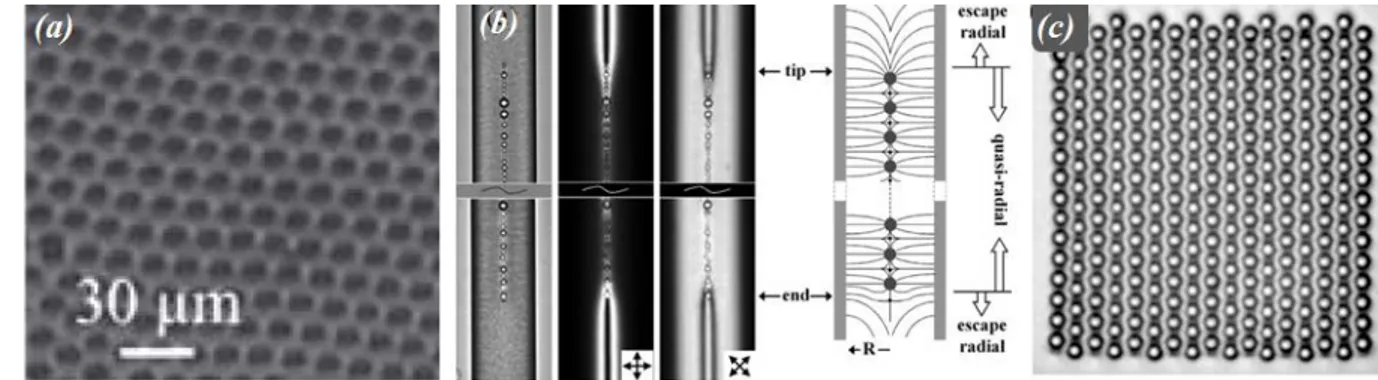
The idea stems from early experiments on colloid-LC mixtures performed at the beginning of the 2000s (Fig. I.5). The director field around a micrometer-size particle in the Nem of N* is distorted and requires topological defects to satisfy boundary conditions. When two or more particles are considered, the director distortion provides a long range force that lead to the stable aggregation of the colloidal particles into ordered structures 83-86. Remarkably uniform arrays of droplets were obtained by demixing and phase
separation of a LC-silicon oil droplet 87,88. Hexagonal lattices of solid colloidal particles
were formed at the Nem/air interface (Fig I.5 (a)) 89. Chain-like particle aggregates were
obtained into microcapillaries (Fig I.5 (b)) 90 and sandwich cells 91,92. Colloidal chains can further self-assemble into the two-dimensional dipolar nematic colloidal crystals (Fig I.5 (c)) 92,93.
Figure I.5: Optical micrographs of (a) hexagonal colloid crystals of a curved nematic/air
interface89, (b) chain-like colloid aggregates formed into microcapillary in white light and
between cross polarizers. The directions of polarizers are indicated 90. (c) example of a 2D dipolar nematic colloidal crystal, assembled by the laser tweezer manipulation92.
12 When the particle size is comparable to the size of LC molecules, the LC-particle and LC-mediated interactions between particles are expected to be different from those of colloidal particles94,95. NPs dispersed in a LC can modify the macroscopic properties of the LC such as optical birefringence, dielectric or magnetic anisotropy, and thermal response95-97. NPs tend to migrate towards highly distorted regions, reducing the overall energy of the system98. Typically, high elastic energy of distortion is focused in topological defects, thus the largest energetical gain is associated with a partial replacing of topological defect core with NPs, resulting in creation of stable trapping sites (Fig. I.6).
Figure I.6: (a) Fluorescence microscopy image of periodically aligned defects in a
nematic film with trapped polymer micrometer-sized particles labeled with dichroic dye
99. (b) Magnification of (a). (c) POM image of an array of dislocations in a SmA LC
trapping spherical Au NPs of a diameter 4.7 nm100.
For the same reason, defect are stabilized and more easily nucleated in the presence of NPs. Indeed, combining LC and NPs has led to the breakthroughs in the stabilization and practical application of frustrated chiral LC phases, namely blue phases (BP) and twisted grain boundary phases (TGB), that were considered “exotic” curiosities a decade ago. In the absence of NPs, these phases exist in a narrow range of temperature, often less than 1 °C, and contain a dense network of topological defects even in the absence of external fields. Defects can effectively trap small NPs of diameter less than 9 nm, such as small polymer coils and spherical NPs95,101-103. In turn, trapped NPs stabilize the defect
structure over a large temperature range, sometimes exceeding tens of degrees104-110.
Thermotropic SmA are a very promising class of materials for organizing NPs into regular structures. Both 1D and 2D defect arrays are capable to trap and assemble dispersed colloids, semiconductor quantum dots (QDs) and NPs, imposing periodical
13 spatial distribution that reflects those of the defect array. Hexagonal lattices of small colloidal spheres were formed within toroidal FCDs (Fig. I.7 (a))111, where particles were trapped inside the vertical defect line at the FCD centers (Fig. I.2 (a)) 65. LD arrays capture and organize spherical gold NPs or fluorescent QDs into an array of straight linear chains, with lengths exceeding 50 µm and a diameter comparable to the diameter of a single NPs (Fig. 0.7 (b))76. Within the chains, particles are in close interaction and, in the case of Au NPs, optically coupled, showing polarization dependent plasmon resonance. A recent work on SmA LC open films containing semiconductor anisotropic NPs112 revealed aligning of NPs with their long axis parallel to the defect lines.
Figure I.7: Fluorescence images of (a) micron-sized colloidal particles assembled into a
2D lattice of toroidal FCDs111 and (b) QDs of a diameter 5 nm trapped in LDs. The inset show a POM image of the array and arrow indicate the direction of crossed polarizers76.
In this context, the idea of the thesis on the first step was to understand how to prepare SmA LC defect patterns with predefined morphology and to control and modify the period and dimensionality of the patterns using external stimuli. On the second step, to use SmA defect patterns for ordering and aligning NPs with different material (semiconductor, metal), size, shape (spheres, rods) and optical properties (fluorescence, plasmon resonance) via NP/defect interactions. LC patterns are used as templates to ‘transferring’ the order of the LC host to the NP guest over areas as large as a few mm2.
Our specific aims were:
1. Controlling pattern dimensionality (1D/2D), symmetry and period as a function of boundary geometry (open films with deformable air interface or closed cells with
14 rigid boundaries), film thickness and applied electromagnetic fields, with the possibility of reversibly switching between different pattern morphologies.
2. Understanding the relation between array formation and material parameters such as LC order, elastic constants, phase sequence, surface tension and anchoring by considering various SmA compounds and surfaces.
3. Using SmA periodic defect domains for organizing NPs in LC host matrices and creating novel functional materials.
The thesis is developed in 5 chapters:
Chapter 1 is a brief introduction to LC theory. The main thermotropic LC phases and order parameters are introduced with definition of order parameters, elastic energies and coupling with external fields. Topological defects of the orientation order (disclinations) and positional order (dislocations) are also presented, with an emphasis on the typical defect domains of the SmA phase: oily streaks and focal conic domains.
Chapter 2 introduces the materials and methods used in the thesis (LC, NP, QD, dyes, polymers and surfactants) with their main features and parameters. This chapter describes the procedures for sample preparation, surface treatments, fabrication and patterning of transparent electrodes, cell assembly, and LC/NPs mixtures. The chapter also provides a description of the experimental techniques used for the t hesis work (POM, fluorescence confocal polarizing microscopy, FCPM, interferometry for thickness measurements and dark-field microscopy).
Chapter 3 presents the defect patterns formed in LC cells with “hybrid” planar -homeotropic anchoring conditions. The pattern morphology depended on the film thickness and could be reversibly changed by applying an external electric field113. Models of the pattern internal structure are also proposed.
Chapter 4 addresses the generality of 1D and 2D patterns nucleation and transition between them. A survey of different SmA LC, surfaces and boundary conditions is presented. Moreover,1D pattern nucleation is demonstrated for cells with homogenous planar anchoring conditions subject to applied electric fields. 1D/2D pattern transition is linked to a critical condition appearing at the Nem-SmA transition when the director is distorted and confined to a small thickness.
15 Chapter 5 presents the results of our work on composite LC-nanoparticle materials. The spatial distribution and alignment of fluorescent NPs of different type s (semiconductor spherical and rod-like core/shell CdSe/ZnS QDs, CdSe/CdS dots-in-rods, and dichroic laser dye molecules) is examined by means of fluorescence and polarizing microscopy. Effective trapping, orientation and localization of NPs in defect arra ys is discussed in connection with applied electric fields. The effect of particle size and increasing concentration on the SmA textures is also investigated. Critical concentrations of NPs inducing aggregate formation will be compared for two LC matrices and various NP sizes of (3.8 - 50) nm.
The Conclusion section summarizes the main results and proposes further developments. In short, the main findings of this thesis are the following:
1. 1D and 2D defect pattern formation is a common feature of thermotropic LCs having SmA phase in their phase sequences when subjected to incompatible unidirectional planar and homeotropic anchoring conditions.
2. We can create both 2D lattices and 1D arrays either by varying the LC film thickness in the absence of external electric field, or by applying the field at a given thickness. The thickness of the layer where the LC director rotates from normal to parallel to the substrates orientation determines the pattern symmetry and periodicity. 1D arrays appear when such thickness is small, both for hybrid and homogeneous planar anchoring conditions. Transitions between different pattern periods and morphologies are hindered by large energy barrier associated with defect rearrangement: patterns are stabilized against changes in external parameters by ‘topological’ barriers.
3. Anisometric NPs, such as dot-in-rods and dichroic dye molecules, align along the director in the absence of defects but align parallel to line defects within the defect core. An electric field applied normal to the defect line challenges the anisotropic particle-defect interaction and may lead to perpendicular orientation, depending on the particle type and size.
4. In hybrid cells, adding spherical Au NPs to SmA LCs leads to (a) destabilization of LDs, (b) stabilization of another type of defects – striated stripes and (c) it prevents aggregation even for a large concentration of Au NPs.
16
1. Structure, energy and defects of the smectic phase
This Chapter provides the essential theoretical knowledge for describing the structure and response of smectic defect patterns. Although the focus of this thesis is on the smectic-A (SmA) phase, many of the relevant physical phenomena, such as surface anchoring and orientation under applied fields, can be more easily understood st ating from the nematic (Nem) phase at higher temperature. This is due to the fact that the Nem phase show a type of anisotropic molecular arrangement that persists in the SmA phase. Moreover, defect patterns nucleate at the Nem - SmA transition as temperature is lowered and many experimental observations, discussed in details at the end of Chapter 4, suggest that pattern formation is intimately connected to the particular character of such transition.
1.1. The ground state of nematic and smectic liquid crystals
The majority of liquid transforms into crystalline solids when temperature is decreased, like water transforms into ice. But some liquids show intermediate states called “mesophases” when temperature is decreased, with properties between those of liquids and crystals. Liquid crystal (LC) materials show mesophases exhibiting both the fluidity of simple liquids and a reduced symmetry and order that are typical of solids. There are many LC phases, depending on the type of order, i.e. symmetry of the mat erial, some of which are shown in Fig. 1.1 (a)44.
Figure 1.1: (a) Molecular ordering in the mesophases of a thermotropic LC composed of
rod-like molecules. (b) Orientation of a rod-like molecule relative to the director n, which describes an average local orientation of the LC molecules.
17 Thermotropic LC are pure materials showing phase transitions as a function of temperature and are typically made of rod-like molecules. The nematic (Nem) phase is the less ordered (most symmetric) of the LC phases, possessing the orientational order described in Fig. 1(a). Molecules tend to align to each other around a common direction n called the “director” but their centers of mass a randomly distributed in space, as in a simple (isotropic) fluid.
When molecules are chiral, a chiral nematic phase called cholesteric (N*) may
appear where there is a spontaneous twist of the director orientation: n continuously rotates around an axis perpendicular to n and the amount of rotation is proportional to the distance travelled along such perpendicular axis, see Fig. 1.2 (a). When the travelled distance is equal to the “pitch” p the director is rotated by 180° and the molecular orientation is equivalent. In this sense, cholesteric is a ‘periodic’ materials where the (anisotropic) molecular order and properties are periodically repeated along the direction normal to n.
In the smectic phase, molecules show a positional (translational) order, in addition to being oriented along with n. The molecular density (i.e. number of molecules per unit volume) shows a spontaneous periodic modulation with period a along a direction z. Therefore, a smectic is another example of periodic material. In some case it is useful think of a smectic as to a layered material, i.e. a stack of lamellae with thickness a, although one should bear in mind that lamellae are not always physical entities that can be distinguished from one another (e.g. as they would be for a stack of lipid b ilayers or the pages of a book). In the smectic A (SmA) phase, z is parallel to n whereas in the smectic C (SmC) phase n forms is tilted by an angle β from z towards a direction c parallel to the layers. Chiral molecules may form the smectic C* (SmC*) phase, where β is constant for all layers, but the c direction rotates by a finite angle from one layer to the next, forming a periodical helix with pitch p>a, see Fig 1.2. (b). Although the phase sequence depends on the LC molecular structure, pressure conditions and presence of external electromagnetic fields, most achiral LC molecules show the typical phase sequence: crystal → SmA → Nem → Isotropic (Iso) as the temperature is increased.
18
Figure 1.2: LC molecules orientation in chiral (a) N* phase and (b) Sm C* phase114.
If we consider this phase diagram, one can say that the Nem phase “breaks” the full (spherical) rotational symmetry of high-temperature simple fluids. Indeed, the Nem phase is symmetric under a subset of rotations and reflection operations: any rotation around n and the change from n to –n. Simple fluids and the Nem phase are completely invariant by translations in any direction. The smectic phase further breaks such translational symmetry along the direction z. In a sense, the SmA can be considered as a ‘parent’ phase of the Nem phase: all symmetry elements of the Nem phase are included in the SmA phase and ‘passed on’ to the Nem phase at the SmA-Nem transition.
1.2. The nematic phase: order parameter, ‘ground’ state and elasticity
Specifying the symmetry elements of a LC phase is not sufficient to completely describe its thermodynamic state and phase transitions. In the context of symmetry breaking, an order parameter must be introduced for each type of broken symmetry (e.g. Nem or smectic) such that it vanishes at the the phase transition to a higher symmetry phase. In a nematic, the order parameter is a traceless symmetric tensor44,115:
Qij = S·(ninj - δij/3) (1.1)
where ni,j are the director components and the scalar order parameter S is given by:
19 where θ is the angle between the n and the long axis of each molecule (Fig. 1 (b)). The brackets denote a statistical average. S = 1 for a perfectly aligned LC (e.g. in the crystalline phase) and S = 0 in the isotropic phase. The values of S typically ranges from 0.3 to 0.9, depending on the temperature and LC considered. Since the order vanishes at the transitions to the Iso phase, the natural approach to study the transition is to write down the free energy as a power series expansion of the order parameter. This approach is known as the Landau - Ginzburg phenomenological mean-field theory, developed in the 1930s for the general study of phase transitions (e.g. in superfluid helium and supercondutors) and later adapted to LC phase transitions, notably by De Gennes. Near the Nem-Iso phase, the free energy is expanded as combination of the tensor elements Qij
that satisfy the symmetry requirement of the Nem phase.
In an isolated nematic, Qij is uniform across the material (i.e. both S and n are
uniform) and n can point in any direction. However this ideal situation or ‘ground’ state can be perturbed by the interaction with the boundaries and external fields, and both n and
S may show spatial variations. Also in this case, the free energy expansion can be
developed by introducing terms containing Qij and the spatial derivatives ∂iQjk that satisfy
the symmetry requirements.
Deep in the Nem phase, i.e. far enough from the Iso and SmA phase, the scalar order S(T) depends on the temperature T but is almost uniform for spatial variations that occur over a length scale much larger than molecular dimensions. In these con ditions, the free energy expansion contains only the components ni and derivatives ∂inj of the director.
Frank and Oseen showed that the dominant terms in the expansion correspond to three principal modes of deformation called splay, twist and bend, described in Fig. 1.2116,117. The increase of free energy per unit volume is given by:
20
Figure 1.3: Equilibrium state of nematic liquid crystals and three main types of
deformations: twist, splay and bend.
Table 1.1 list of the elastic constants for the two LC compounds that were most used in this thesis (see also Chapter 2.1)118. The constants depend on S(T), and we report
the values close to the transition to the SmA phase.
Table 1.1:
Elastic constants of 8CB and 8OCB near the Nem - SmA transition temperature
LC Elastic constant Kii (pN)
8CB K11 at T = 33.4°C 6.95
K33 at T = 33.4°C 9.30
8OCB K11 at T = 67.8°C 8.25
K33 at T = 67.8°C 13.30
The expression of the free energy density is more complicated near the Nem-Iso and Nem-SmA transitions. Near the Iso phase deformations of S and n are coupled, and the full tensor Qij and its derivative must be considered. Near the SmA phase, thermal
fluctuations create small smectic-like domains that affect both S and the elastic constants.
1.3. The smectic-A phase
1.3.1. Ground state and order parameter
Materials such as SmA LCs that break a translational invariant and spontaneously create a density modulation can described with a complex order parameter (field). In t he ground state (Fig. 1.4), points with equal density span a set of parallel planes spaced by a
21 constant distance a0. One can express the fact that the phase φ changes by ±2π between neighbouring planes with the formulas:
) (i.e. 2 0 0m x m x q d q d d (1.4)
where q0=2π/a0 and m is the gradient direction. In SmA LC the material also shows Nem
symmetry, i.e. spontaneous breaking of rotational symmetry and n||m.
Figure 1.4: Molecules (blue rods) and layers (thick lines) in the smectic-A phase. ϕ is the
phase and n is the director.
1.3.2. Distortions and elasticity of the smectic A phase
Planes with equal phase may become curved non-equidistant surfaces with m ≠ n and||q2/aq0. Close to the SmA-Nem phase transition, one can follow the Landau – Ginzburg - De Gennes approach for describing order variation as a function of
and its spatial derivatives i. Because in the ground state i iq0ni (Eq. 1.4), the expansion must contains terms|iiq0ni|2. The nematic symmetry is such that distortion in the n direction have a different elastic constant than in perpendicular direction. Therefore De Gennes proposed the following free energy expansion:
2 2 | | 2 | | 2 2 0 || 2 || 4 2 C iq C b a f f N n (1.5)
where fN is the density of elastic energy of the nematic phase. ∇∥ 𝜓 and ∇⊥ 𝜓 are the
gradient along n and in the perpendicular direction, respectively. The coefficients a changes sign at the Nem-SmA transition temperature Tc and can be written as
22
) (T Tc a
a near Tc whereas b and C||, are almost constant. In the ground state, the
density modulation has amplitude given by 0(T)2 a/b. When the layers are flat and
parallel, qnand the gradient terms reduce to
2 0 2 0 2 0 0 ||q /2 (1 q /q) (B/2)(1 q /q)C , where B
C||q0
2is the layercompressibility modulus of the SmA phase.
1.3.3. Analogy with superconductors
In 1972 De Gennes pointed out that the free energy expansion of Eq. (1.5) is similar to the Landau-Ginzburg expression describing transition between the normal and superconducting state of a metal119:
2 0 || 2 4 2 2 0 2 | | 2 | | ) ( 2 1 A A iq m b a f (1.6) where the vector potential A is analogue to the director n and the magnetic field
A
B to the rotor field that appear in the bend and twist terms of the nematic energy (Eq. 1.3). De Gennes related Nem and SmA phases respectively with the normal (N) and superconducting (S) states of a metal. From the analogy with superconductors stemmed various predictions:
(a) A smectic LC tend to expel the bend and twist (i.e. nis expelled) deformations in the same way as a metal expels the magnetic field B at the transition from the N to the S state. Deep in the SmA phase, the director is perpendicular to the layer (as in the ground state) and splay deformation involving nare ‘allowed’, in the sense that
they can be created at the cost of a relatively low increase of free energy per unit volume. On the other hand, bend and twist deformations involving n are ‘forbidden’, in the sense that they require a high energy density. When bend must be considered, the free energy expansion in the deep SmA phase is sometime written as:
2 n) ( 2 ) / 1 ( 2 11 2 0 B q q K f (1.7)
23 where q, n and are linked by the relation: qn. For 8CB, the modulus is
3 7
J/m 10
B close to the SmA-Nem transition120. The first term can also be written as ,
2 /
2
B where (a0a)/a0is the layer strain.
(b) Due to the high value of B, the strain energy increases so rapidly that the strain deformation may ‘melt’ the SmA phase into the Nem phase. In superconductor, when | B| exceeds a certain temperature-dependent threshold, the S state is frustrated and the field may either enter the metal either in the form of topological defects – line singularities called magnetic “vortices” – or create non-singular regions with normal behaviour, i.e. with B 0. The first or second scenario occurs depending on the type of material that is classified as type-II in the first case or type-I in the second case. A SmA LC is expected to behave in a similar way, although it is often unclear to which type a LC material belongs. This analogy with superconductors led to the famous discovery of the Twist Grain Boundary (TGB) phase whereby twist distortions in a chiral LC are expelled from the bulk and confined to grain boundaries in the form of periodic arrays of twist dislocations 121.
(c) The twist (K22) and bend (K33) elastic constants diverge at the transition from
the Nem to SmA phase. This has been proven experimentally for various SmA LC, including 8CB 122.
(d) If a bend distortion is applied over a length scale h (e.g. the thickness of a LC film) the elastic energy is of the order of K3
n
2 K3/hc2. The analogy with superconductor suggests that this energy equals the condensation energy Ec a0 2 at the Sm-Nem transition in a type-I material. The condensation energy scales as as 2c
E
as a function of the reduced temperature (TTc)/Tcwhere the critical exponent is
1
in the mean-field approximation and close to 1.3 if fluctuations are considered
119. As a result, the transition temperature of a bent nematic is depressed compare to the
ground state: at a given temperature T < Tc the Sm phase condenses only in bent regions
whose thickness exceeds the critical value hc h0, whereas bent regions with hhc
persist in the Nem phase ( 0). In other words, for a given thickness h, the bend distortion becomes critical at temperature
h0/ h
1/ . The relevance of this point will be discussed at the end of Chap. 4 concerning SmA LC films with thickness around 1 m.24
1.3.4. Confocality
The notion of confocality play a central role in the study of SmA LCs as it extends to curved surfaces and smectic ‘lamellae’ to intuitive idea that equidistant surfaces are ‘parallel’. Consider the deep SmA phase where the strain is zero (i.e.q(2/a)0) and
||
n (i.e.qn). These conditions immediately imply that n0, i.e. bend and twist are completely absent. Vice-versa, if n0 and qn, then q0
and the smectic ‘lamellae’ are equidistant,.
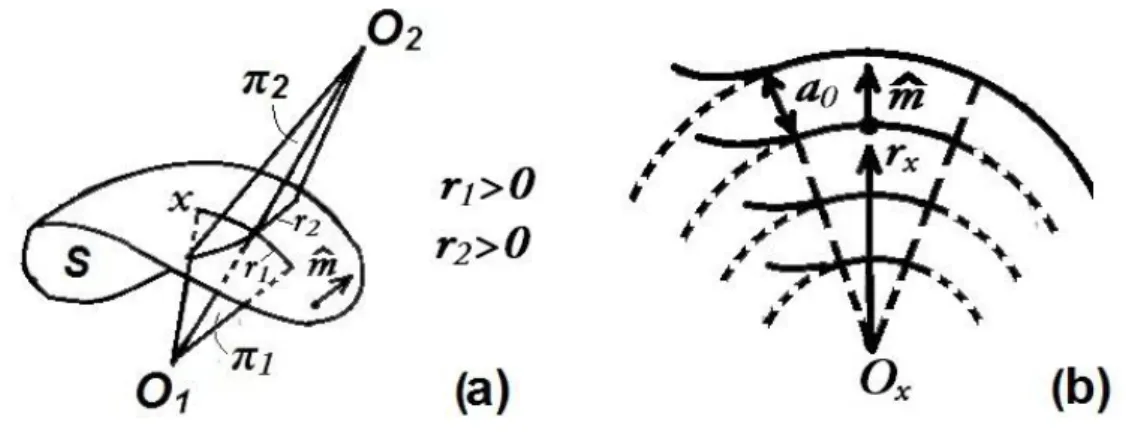
Consider the normal m at a point p on a curved lamella (Fig. 1.5). A second surface can be considered ‘parallel’ to the first if all its points can be obtained by translating the point p by a constant distance a0 along m. We can describe any (smooth
differentiable) surface by choosing two tangent directions x and y, normal to each other and to m, such that the coordinate along m, say z, is a quadratic form of the coordinates x and y around p. The quadratic form is diagonalized along two principal axes x and y for which we can define two radii of curvature r1 and r2 that join the surface with the centers
of curvature O1 and O2. The centers can be on opposite sides of the surface and the radii
are considered positive or negative if they are parallel or antiparallel to m, respectively (Fig. 1.5 (a)).
Figure 1.5: (a) Normal m and principal coordinates x and y of a surface S at a point p. O1
and O2 are the centers of curvature located on the focal surfaces, r1 and r2 are the principal
radii of curvature. (b) Cut through a principal plane xz of a confocal set of surfaces.
As p moves along the surface, the centers O1 and O2 span two “focal” surfaces,
25 (for a sphere). It can be demonstrated that two ‘parallel’ surfaces are also necessarily “confocal”, i.e. they share the same focal surfaces123,124. If we consider a point p on any
surface of a confocal set and identify the set of points located on the other surfaces, these points share the same normal m and are equally spaced by a distance a0. The principal
plane xz (or yz) is common to the entire set and the radii of curvature on this plane, taken at the equally spaced points, are rx + pa0 (resp. ry+qa0) where rx (resp. ry) is the radius of
curvature in p and pa0 (resp. qa0) is the distance from p (Fig. 1.5 (b)). In other words, a
confocal set can be approximated as a set of concentric cylindrical surfaces.
1.4. Topological defects
The main goal of this thesis was to characterize the periodic patterns that form in SmA film at the transition from the Nem to SmA phase. The feature that distinguishes these pattern from other periodic LC patterns such as Helfrich undulations and Williams domains44 is that they are the result of defect nucleation and self-assembly. Therefore, in
this section we will describe the different types of defects that are commonly encountered in the Nem and SmA phases of thermotropic LCs and the energy of distortions they cause in LCs.
One can observe a topological defects formation even in homogeneously aligned smectic LCs due to a non-uniform thickness of the film or external inclusions. The distortion caused by inhomogeneities are transferred into smectic matrix, like presented in Fig. 1.6, on the characteristic penetration length, which can be determined according to Blinov125 as follows:
𝐿𝑝 = 1
𝑞2𝜆𝑠= Λ2
4𝜋2𝜆𝑠 (1.8)
where characteristic length of smectic LCs 𝜆𝑠 = √𝐾𝐵11 (typically λ ≈ 1 nm). It means that deformations of LC smectic layers caused by inhomogeneities are of the same order as inhomogeneities.
26
Figure 1.6: Deformation of smectic layers caused by an inhomogeneity on the
boundary124.
1.4.1. Defects of the nematic phase
Topological defects of the Nem phase are points, lines or wall singularities where the director n cannot be uniquely specified and molecular ordering is altered or removed. Here we consider disclination lines that were commonly encountered in our experiments.
Figure 1.7: Typical disclination lines in the Nem phase126.
Near the defect line, n is perpendicular to the line and the director field can be characterize by the winding number m (also called topological charge) defined as follows.
27 Consider any loop containing the disclination and linear axis having the disclination as the origin. The orientation of n on is given by: = m + const, where is the polar angle that specify a point on the loop. Therefore, n rotates by an angle 2πm over a complete loop. An example of disclinations are given in Fig. 1.7. The study of topology of the Nem phase reveals that disclinations with integer winding number m are unstable. For instance, one may expect that the director field in a round capillary with normal anchoring conditions on the internal surface to have topological charge m = 1. Instead, two lines with
m = 1/2 are observed or a defect with reduced dimensionality (point “hedgehog” defects).
1.4.2. Elementary defects of the smectic phase
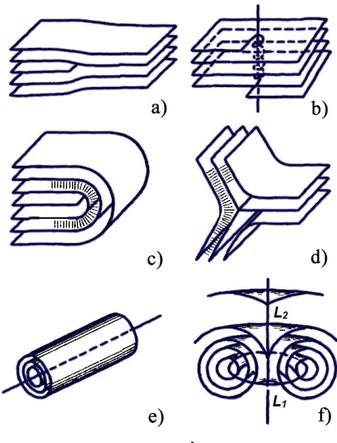
Because the SmA phase includes the symmetry elements of the Nem phase, i.e. a positional order and director n can be defined, disclination can be considered as defects of the SmA phase. However, the SmA phase also shows other types of defects that are proper to the positional order, namely dislocation lines. Figure 1.8 shows typical defects of the SmA phase115.
Figure 1.8: Topology of the defects in smectic A liquid crystals115: (a) edge dislocations, (b) screw dislocations, (c) wedge disclinations with topological charge m = +1/2, (d) wedge disclinations with topological charge m = -1/2, (e) roll, f) toroidal FCD.
28
(a) Edge dislocations (Fig. 1.8 (a)) are defect lines intrinsic to solid crystals.
Typically, edge dislocations appear due to the external force tending to change the interlayer distance. As an example, usually they appear in wedge-type cells, where they compensate the difference in the interlayer spacing. Experimentally, edge dislocations are hardly detected, due to the very small size of the defect core (typically 2 -3 nm) they do not show any contrast in polarizing microscopy. However, closer to the SmA – SmC transition in the vicinity of the defect SmC phase is more favorable, so the LC director n becomes tilted and can be visualized by a polarizing microscope127, see Fig. 1.9 (a). Edge dislocations can also be revealed by X-ray diffraction, as the presence of large quantity of edge dislocations in the LC volume results in broadening of Bragg diffraction peaks128. Because of the wedge geometry of a cell edge dislocations are periodical. In the case of small angle of divergence α, the periodicity can be expressed as Λ = 𝑏/𝑡𝑎𝑛𝛼 ≈ 𝑏/𝛼 124,
where b – is a Burger’s vector. Generally Burger’s vector is a number of added layers b =
na0, where n is integer and a0 is an averaged layer thickness. As it defines by a contour
around the defect lying in a plane which intersects the defect, the generalization can be written as follows ∮𝑛𝑎∙ 𝑑𝑙 = ∑ 𝑛𝑖 𝑖, where the summation extends around all the embraced
contour44. The schematical sketches of the edge dislocation with small Burgers vector are presented in the Fig. 1.8 (a) and Fig. 1.9 (b). In fact, when the angle α is large, or homeotropically oriented SmA film is locally pressed, dislocations with a large Burgers vector (up to hundred layers thickness) become visible and can be revealed by polarization microscopy. It was discovered for a first time by Williams and Kléman in their early work129. They showed that such dislocations are formed by two elementary disclinations
L1 and L2 of opposite half-integer strength, separated by the distance b/2, schematically
presented in Fig. 1.9 (c).
Figure 1.9: (a) Optical micrograph of edge dislocations close to the SmA – SmC phase
transition; (b – c) core model for edge dislocations of different Burger's vectors b = a0 and
29 The energy of the edge dislocations with small burgers vector ( b = a0) per unit
length can be estimated as124:
𝐸𝑒𝑑𝑔𝑒 = √2 𝜋⁄ 𝐵14𝐾 1 1 4𝛾 𝑐 1 4𝑏 (1.9)
where K1 is elastic constant, B – compressibility modulus. This formula means that energy
of an edge dislocation and its Burger’s vector are proportional. In the case of large Burger’s vector Williams and Kléman proposed next equation for the core energy estimation129:
𝐸𝑒𝑑𝑔𝑒 𝑐𝑜𝑟𝑒 ≈ 𝐾1𝜋
2 ln ( 𝑏
𝑟𝑐) + 𝐸𝑐 (1.10)
where rc - is a disclinations core radii and Ec – their energy. In practice edge dislocations
with large Burgers vectors are more frequent in SmA liquid crystals.
(b) Screw dislocations (Fig 1.8 (b)). This type of defects are usually observed in
the chiral TGBA phase (twist grain boundary SmA phase) or in SmC*. A periodic array of
equidistant screw dislocations forms the grain boundary between smectic blocks that are free of twist, bend and defects (Fig. 1.10). Electron microscopy investigations made by Ihn et al. 130 revealed that screw dislocations align parallel on average along the local
director n, like presented in Fig.1.8 (b). Axes of dislocations rotate in a helical fashion from one boundary to the next. Such rotation of defects pattern leads to the following rotation of the director of SmA along the axis perpendicular to the grain boundaries, see Fig. 1.10 (a). Distance between the neighboring dislocation lines ld can be determined as
following:
𝑙𝑑 = 𝑃𝑙
2𝜋𝑙𝑏 (1.11)
where P is a helical pitch, l is a smectic layer thickness, lb is a distance between the grain
30
Figure 1.10: (a) Schematic representation of the TGBA phase structure131. (b) Optical
micrograph of SmC* film in homeotropic orientation. The screw dislocations are visible as bright spots on the black background124.
The energy of screw dislocation per unit length can be expressed as following124:
𝐸𝑠𝑐𝑟𝑒𝑤 = 𝐵𝑏 4 128𝜋3𝑟 𝑐2+ 𝐾3𝑏4 64𝜋3𝑟 𝑐4+ 𝐸𝑐 (1.12)
where rc – core radius, Ec – core energy, b is a Burgers vector. One interesting feature
follows from this equation: since there is no dilation and layer curvature, screw dislocations do not have strain energy. For screw dislocations inheren t only core energy, described by Williams and Kléman for the dislocations with a large Burgers vector44.
The core structure of the screw dislocations is still not well understood. A s an analogy with edge dislocations, a core can be nematic or isotropic. The screw dislocations are invisible for polarizing microscopy for both SmA and SmC phases. They can be observed only like a bright or dark spots (depending on the polarization of lig ht) on a uniform background in SmC* phase, see Fig. 1.10 (b). Experimental observations of the screw dislocations were also performed using electron microscopy124.
(c) Wedge disclinations (Fig. 1.8 (c-d)) are analogous to disclinations in the Nem
phase (Fig. 1.11 (a)). However, the symmetry of the SmA phase stabilizes defects with an integer winding number. For instance, it is possible to create a director field with charge m = 1 (Fig. 1.8 (e) and Fig. 1.11 (b)) in a round capillary with normal boundary conditions. At the transition to the Nem phase, the line splits into lines with m = 1/2 and/or point defects, like presented in Fig. 1.11 (a).
31
Figure 1.11: Polarizing microscopy images taken under the crossed polarizers illustrating
(a) splitting of a defect line with integer winding number formed in capillary onto two defect lines with half-integer winding numbers in the Nem phase; (b) a defect line with integer winding number in the SmA phase.
For the satisfaction of long-range ordering in SmA liquid crystals, disclination lines occurs only in pairs with opposite sign, thus forming either dislocations or focal conic domains. For instance, edge dislocation consists of two linear dis clinations is presented in Fig. 1.9 (c). L1 and L2 indicates respectively line defects with m1 = +1/2 and
m2 = -1/2 winding numbers. Often disclinations in smectic liquid crystals have curved
shape. The energy of disclination line can be estimated as following44: 𝐸𝑑𝑖𝑠𝑐𝑙 =𝜋2𝐾1𝑙𝑛𝑏𝑎0
2𝑟𝑐 + 𝐸𝑐 (1.13)
where Ec is an energy of the defect core.
1.4.3. Confocal domains: focal conics and oily streaks
In the SmA phase, the director field can be easily distorted and the lamella curved, but changing the distance a0 between lamellas requires a high energy. These requirements
lead to the formation of characteristic defect domains that combine multiple elementary defects of the type presented in the previous section.
32
Figure 1.12: (a) Geometry of confocal pair in SmA LC. (b) Cross section of top conic
demonstrating the geometry of smectic layers and orientation of molecules within the layer. (c) An example of filling SmA liquid crystal film by conics with different sizes 132.
(a) Focal Conic Domains (FCD) are sets of equally spaced curved lamellae called
Dupin cyclides (Fig. 1.12 (a). The surfaces are confocal and share their centers of curvature that are located on two conjugated foal conics, a hyperbola H and an ellipse E, with the focus of one curve being the summit of the other. The shared normal of these surfaces defined the directions of n. They are all possible directions specified by taking any points on H and any point on E. Around E and H, the director n is similar to that surrounding a disclination line (although n is not always perpendicular to the focal conic line). When E is a circle (zero eccentricity), H is a straight line (infinite eccentricity) passing through the circle center and each cyclid is a torus (Fig. I.2 (c) and 1.8 (f)). When both eccentricities are equal one, the two conics are parabolae. The distortion of the layers is very week, except the region where the parabolae cross133 (Fig. 1.13 (c)). Square
FCDs38 (Fig. 1.13 (d)) are formed by two hyperbolic branches of H making an angle of 45° with the plane of E with eccentricity close to the value 1
√2
⁄ . An optical micrograph of square FCD lattice was presented in Fig. I.4 (c).
33
Figure 1.13: (a) A complete elliptical FCD (set of Dupin cyclides)134. (b) Region of the
FCD with negative (Gaussian) curvature134. (c) Layer arrangement and lattice of parabolic domains65 and (d) Square FCD38. H and E are line singularities: hyperbola and ellipse respectively. The director orientation is indicated with arrows.
In thermotropic LC, only the region with negative Gaussian curvature of the FCD (with two principal radii of curvature having opposite signs everywhere) is usually observed (Fig. 1.13 (b)). FCD associate following the laws first enunciated by Friedel123.
The first law states that, if two focal domains are in contact, they are tangential to each other along the common generator of their boundaries. The second Friedel’s law of association (so called “law of corresponding cones”) requires coinciding of the cones with generators which have a common apex that belong to two conics. Both requirements can be completely satisfied in grain boundary geometry (Fig. 1.15) and ellipses of neighboring
34 FCDs are in contact along the major axes, or along the minor axes. Cones with different sizes can fill all the volume of SmA LCs, Fig. 1.12 (c)132.
(b) Oily streaks. Frequently in thick homeotropic smectic LC films as well as in
cholesteric liquid crystals one can observe thick bright lines, which thickness can reach even the thickness of the sample, like presented in Fig. 1.14 (a). Comparing with cholesteric liquid crystals, where defects with integer topological charge do not have a core, in smectic A liquid crystals oily streaks have a singular core40. The inner structure of these lines is complex and usually consists of an array of focal conic domains separated by flat layers parallel to the boundaries. According to G. Friedel135 oily streaks can be presented like a pair of edge dislocations with an opposite sign and large Burgers vector, see Fig 1.14 (b). However, sometimes appear dislocations of small Burgers vector, which annihilate with time to the dislocations with large b, that are energetically preferable. The core topology of edge dislocations in this case prevents the interaction of opposite sign dislocations124. Moreover, due to the elastic properties of SmA LCs oily streaks usually
split into a series of focal conic domains136. The intervals between the FCDs can be filled
either with the layers of edge dislocations or with FCDs of smaller size, like depicted in Fig. 1.14 (c). Continuous changing of the focal plane in polarization microscope reveals the formation of FCDs and edge dislocations along the film depth in oily streak. FCDs are characterized by a Burgers vector b that is a sum of two dislocations of opposite sign b1
and –b2 thus b = b1 - b2. Stability of oily streaks as well as focal conic domains depends
35
Figure 1.14: (a) Magnified image of oily streak observed in unpolarized light in a
homeotropic 8CB sample124. (b) Oily streak formed by two edge dislocations L1 and L2 of
Burgers vectors b1 and b2. (c) Structure of an oily streak shown in (a), composed of a FCD
chain accompanied by edge dislocations136.
1.4.4. Grain boundaries
In the volume disoriented monodomains or single crystals of SmA are connected by regions with strong variations of the order parameter, called grain boundaries, which can be formed from the bent smectic layers only, or involve line defects and focal conics137. Those monodomains meet with a misfit angle 2θ∞ of the layers across a wall, assumed to be symmetric (Fig. 1.15)124.
36
Figure 1.15: Schematic illustrations of different types of grain boundaries124: (a) curvature walls made of bent smectic layers (b) combined walls containing an array of edge dislocations and (c) Grandjean walls involving FCDs.
(a) In low-angle grain boundaries, with very small θ∞, called curvature walls, SmA layers are continuously bent, without breaking (Fig. 1.15 (a)). The elastic cost per unit surface is a function of an angle of the layer rotation44:
𝐸𝑐 ≈ 2/3√𝐾11𝐵𝜃∞3 (1.14)
(b) When θ∞ exceeds a few degrees, grain boundary can be split into periodic edge dislocations (Friedel 1964) which relax the layer dilation at the center of the wall, forming a mixed or combined wall (Fig. 1.15 (b)). The energy of such a wall can be described as following124:
𝐸𝑐𝑜𝑚𝑏 ≈𝐾𝑎11
0 𝜃∞
2
(1.15)
37 (c) When θ∞ is larger than about 25°, Grandjean walls (focal domain walls) can be formed. In this geometry, the ellipses of FCDs are in the plane of the grain boundary and the hyperbolas have asymptotic directions perpendicular to the layers on both sides of the boundary (Fig. 1.15 (c)).
1.5. Surface anchoring
As it was mentioned in introduction, different LC textures and periodic defect patterns can be created by varying boundary conditions and imposing particular surface anchoring. Surface anchoring is the phenomenon of spontaneous alignment of the liquid crystal director n along specific direction at a surface. Anchoring is caused by anisotropic interactions of the LC molecules with the surfaces and involves both surface geometry (e.g. presence of oriented grooves or holes) and composition (e.g. surface charge and polarity)138. The surface molecular orientation of the LC propagates over macroscopic
distances, so that by specific mechanical or chemical surface treatments a particular alignment can be induced in the bulk of the LC. Three main types of LC director alignment relative to a solid surface or free interface (i.e. with air) have been considered in this thesis: planar (parallel to the surface), homeotropic (perpendicular) and tilted. The LC director is specified by the polar (zenithal or out-of-plane) angle ϴ and an azimuthal (or in-plane) angle φ (Fig. 1.16). The preferred director orientation at the surfaces is sometimes called “easy axis”.
Figure 1.16: Schematic illustration of the director n orientation near the surface. ϴ and φ
are the polar and azimuthal angles respectively.
In the case of planar anchoring (Fig. 1.17 (a)) of LC molecules with a surface, n lies in the plane of the surface, so that the polar angle ϴ = 0°. If φ is fixed, the anchoring