Submitted in the partial fulfilment of the requirements of the Degree of Doctor of Philosophy
(PhD) in
Methodologies for the development of molecules of pharmacological interest XIX cycle (CHIM/06)
Biochemistry of olive tree. From genomic to proteomic application on different olive tissues and oil
(PhD) Thesis Department of Chemistry
University of Calabria Italy
Supervisor Candidate
Prof. Dr. Giovanni SINDONA Ashif Sajjad
Coordinator
Prof. Dr. Giovanni SINDONA
Declaration
I certify that this thesis submitted for the degree of Ph.D. is the result of my own research, except where otherwise acknowledged, and that this thesis (or any part of the same) has not been submitted for a higher degree to any other university or institution.
Signed: ... (Ashif Sajjad) Date: ………30/11/2006…..
Table of Contents
ACKNOWLEDGMENT v SUMMARY 1 1 OVERVIEW 3 1.1 GENOMICS 5 1.2 Microsatellite DNA 5 1.2.1 Microsatellites amplification 7 1.2.2 Microsatellite primers 71.3 Polymerase Chain Reaction (PCR) 8
1.3.1 Resolving PCR products 9
1.3.2 Agarose Gel Electrophoresis 9
1.3.3 Chip-based nucleic acid separation 13
1.3.4 Polyacrylamide gel electrophoresis 15
1.4 DNA Sequencing 16
1.4.1 Principles of DNA Sequencing 17
1.4.2 Separation of the molecules 18
1.4.3 Automated DNA sequencing with fluorescently labeled
dideoxynucleotides 19
1.5 Phylogenetics 20
1.5.1 Purpose of phylogenetics 20
1.5.2 Disclaimers 20
1.5.3 Methods of phylogenetic analysis 21
1.5.4 Phenetic methods based on istances 22
2 PROTEOMICS 23
2.1 Proteomics Strategy 24
2.1.1 Protein extraction and sample preparation 24
2.1.2 Protein separation 25
2.1.3 Protein identification 26
2.2 Electrophoresis of Proteins 27
2.2.1 One-Dimensional SDS-PAGE 27
2.2.2 Determination of Molecular Weight 27
2.2.3 Buffer Systems 28
2.2.4 Two-Dimensional SDS-PAGE 29
2.2.5 Principles of Two-Dimensional Gel Electrophoresis 29
2.2.6 Isoelectric focusing (IEF) 30
2.3 Mass spectrometry 34
2.3.1 Sample introduction 35
2.3.2 Methods of sample ionisation 35
2.3.3 Analysis and Separation of Sample Ions 36 2.3.4 Detection and recording of sample ions 36
2.4 Electrospray 37
2.4.1 Electrospray ionisation 37
2.4.2 Nanospray ionisation 38
2.5 Matrix assisted laser desorption ionisation (MALDI) 39
2.5.1 Positive or negative ionisation 42
2.6 Tandem mass spectrometry (MS-MS) 42
2.6.2 Tandem mass spectrometry analyses 43
2.6.3 Product or daughter ion scanning 43
2.6.4 Precursor or parent ion scanning 44
2.6.5 Constant neutral loss scanning 44
2.6.6 Selected/multiple reaction monitoring 44
2.6.7 Peptide Sequencing by Tandem Mass Spectrometry 45
2.6.8 Peptide sequencing 45
2.6.9 A protein identification study 47
2.7 Peptide sequencing in summary 48
2.8 Peptide Mass Fingerprinting (PMF) 50
3 MICROSATELLITE MARKERS FOR DNA SEQUENCE ANALYSIS
OF OLIVE CULTIVERS 52
3.1 Olive SSR loci and genetic diversity 53
3.1.1 ABRUZZO AND MOLISE 53
3.1.1 Characterization of olive SSR loci and genetic diversity 53 3.1.2 Genetic relationships between olive varieties from the
Abruzzo region 55
3.1.3 Genetic relationships between olive varieties from
Molise region 56
3.1.4 Genetic relationships between olive varieties from the
Abruzzo and Molise regions 58
3.2 SICILY 59
3.3 APULIA 62
3.3.1 Genetic relationships between olive cultivars 66
3.4 DISCUSSION 68
4 PROTEOMICS OF (OLEA EUROPAEA L.) TISSUES (POLLEN,
FRUIT AND OIL) 70
4.1 Allergenomics 70
4.1.1 Extraction and characterization of olive (Olea europaea L.) pollen hydrophilic proteins from Italian cultivars by MALDI
TOF MASS Spectrometry 71
4.2 Extraction and characterization of olive (Olea europaea L.) fruit and oil proteins from Italian cultivars by Gel Electrophoresis and MALDI TOF
MASS Spectrometry 84
4.2.1 Electrophoretic identification of fruit proteins 85 4.2.2 Electrophoretic identification of oil proteins 87 4.2.3 MALDI TOF-TOF analysis of in-gel trypsin digested bands 88
5 CONCLUSION 92 6 EXPERIMENTAL SECTION 96 6.1 Plant material 96 6.1.1 Leave samples 96 6.1.2 Pollen samples 96 6.1.3 Fruit samples 96 6.1.4 Oil samples 97 6.2 DNA extraction 97 6.2.1 DNA amplification 97 6.2.2 DNA sequencing 98 6.2.3 Data analysis 99
6.3 Allergen extraction 99
6.3.1 Mass Spectrometry 100
6.4 Protein extraction from olive fruits 101 6.5 Protein extraction from olive oil 101 6.6 Determination of total protein concentration 101 6.7 Sodium dodecyl sulfate-polyacrylamide gel electrophoresis (SDS-AGE) 102
6.8 Polyacrylamide gel staining 102
6.9 In-Gel Tryptic Digestion 103
6.9.1 Gels Stained with Coomassie blue 103
6.9.2 Gels Stained with Silver 104
REFERENCES 105
Annex-I 114
ACKNOWLEDGMENT
It is perhaps not possible to express in words my gratitude to my research supervisor Prof. Dr. Giovanni Sindona for his guidance and support during the past years. My interaction with him has had an enormous influence on my scientific development Prof. Sindona has given me invaluable scientific knowledge and has encouraged me to develop independent thinking.
I would also send a special thanks to Dr. Enzo Perri Director, C.R.A., Experimental Institute for Olive Growing. The time I spent in your Institute was a very pleasant time and it gave me invaluable experience.
Thanks, Prof. Dr. Anna Napoli, for your years of supervision, suggestions, guidance, teachings and your willingness to listen when I needed to talk about everything technical. Thanks, Dr. Innocenenzo Muzzalup, you always give me very helpful suggestions for my thesis writing. Thanks, Prof. Dr. Antonio De Nino, for your encouragement and support. My thanks also go out to all the Department of Ecology. Thanks, Prof. Dr. Silvia Mazzuca for your help to work in you laboratory, your guidance and useful discussions.
I wish to thank all the people in Pakistan who have helped me in several ways. I am most indebted to the University of Balochistan, Quetta Pakistan the professors and teachers. Everyone has been a part of my experience here in Italy and the assistance I’ve received and friendships I’ve made will never be forgotten.
I thank Italian Embassy Islamabad, Pakistan as well as the Italian Ministry of Foreign Affairs for giving me Italian Government Scholarship for PhD.
Finally, I owe all of my accomplishments to my parents. My father and mother, they sacrificed much to provide me with the quality of life from which I could choose what I want to be and to do. This thesis is dedicated to them both, with love and thanks for all they have done for me throughout my life.
SUMMARY
Olive (Olea europaea L.) belongs to a sclerophyll tree species. A complete understanding of the olive tree’s biochemistry is of paramount importance. Genomic to proteomic, these technologies moving towards the high-throughput. Proteome, the end product of the genome. The hunt for new biomarkers has been augmented by the advent of genomics and proteomics. The Genome has been defined as GENe and chromosOME the genome of an organism is the whole hereditary information of an organism that is encoded in the DNA, genomics referred to the study of an organism’s genomes. Proteome as the PROTEin complement expressed by a genOME or tissue. Proteomics is the field that involves the identification, characterization, and quantification of proteins in tissues or whole cells. Advances in DNA and protein sequence analysis has resulted in increasing input in the number of sequences deposited in database. The sequence databases has become an increasingly popular method for the protein characterization and cellular localization, plus identification of post-translational modifications. During recent years, polymerase chain reaction (PCR) based DNA markers and mass spectrometric methods have become an essential tool for plant genomics and proteomics research. Olive Genomics and Proteomics research has stood at the forefront. However, the genomics & proteomics are providing new insights about the olive tree biodiversity.
This dissertation presents (i) the utility of microsatellite DNA markers for management of olive germplasms and points out the high level of polymorphisms in microsatellite repeats when coupled with DNA sequence analysis. The establishment of genetic relationships among cultivars in the Abruzzo, Molise, Sicily and Apulia germplasm collection allows for the construction of a molecular database that can be used to establish the genetic relationships between known and unknown cultivars, (ii) the antigenic profile of Olea europaea pollen from different Mediterranean cultivars obtained by MALDI mass spectrometry. A simple procedure of chemical fractionation of the whole antigen extract was developed. The proposed experimental procedure, can supply valuable information on the antigens’ micro heterogeneity, (iii) devised Phenol based method in order to extract high quality protein from olive (Olea europea L.) fruit which is required for proteomics and could be useful for the characterisation of some
enzymes and (iv) developed a quick, reliable & reproducible method for olive (Olea europea L.) oil protein extraction for getting different protein sequence in order to correlate their presence in the oil, which could be helpful to find the biological and geographical origin.
1. OVERVIEW.
The olive tree (Olea europaea L.) can reach a variable height from few meters to 15 m. The trunk is irregular and the tortuous branches bear evergreen, leathery, elliptical and/or lanceolate leaves with whole margin, green and silvery in the upper and lower part, respectively. The bloom happens in April-June and the pollination is prevalently anemophilous. The olive fruit is a drupe and its pulp, characterized by a bitter taste due to the presence of glycoside oleuropein, shows very high oil content. Owing to the beneficial properties of olive oil for the human health and to the presence of edible fruits, Olea europaea L. has been cultivated for millennia in the Mediterranean basin, becoming one of the most important crop in this area. Olive plants have been propagated vegetatively by local populations, from the Grecian age to the present time, to take advantage of the best genetic complement derived from genomic mutations and random crosses. Therefore, to look for alternative sources of material useful for increasing production and/or quality and to preserve minor cultivars as well as wild oleaster (O. europaea ssp. sylvestris Hoffgg et Link) and feral olive trees (originate either from varieties or from hybridization between a variety and an oleaster), which are a natural reserve of genetic diversity, efforts should be made to collect and characterize the olive germplasm (Angiolillo et al., 1999). Despite the long cultivation history and the great socio-economic interest of the olive tree, its germplasm is today poorly characterized on the whole. Indeed, elaiographical and biometrical studies are surprisingly insufficient to well address its management and preservation. In addition, reliable molecular standardized methods in order to elucidate the potential occurrence of homonyms (one denomination for several genotypes) or synonyms (one genotype with several denominations) are needed to eliminate ambiguities in variety identification. Although in the Mediterranean basin olive crop is usually cultivated by means of traditional methods on a large surface (about 7,000,000 ha), at present the risk of a genetic erosion of its yet not-sufficiently known germplasm exists (Khadari et al., 2003). In fact, there is an even more diffuse tendency to substitute the traditional orchards with new plantation made by only few varieties chosen on the basis of the agro-alimentary characteristics required by the market. Consequently, in most cultivation areas the rarefaction of the minor varieties occur, which now could be
considered as a threatened kind of biodiversity. Therefore, to prevent this rarefaction and to look for alternative source of material useful to increase production and/or quality of food we need to make efforts in order to preserve minor varieties as well as wild oleasters and feral olives, which are a natural genetic diversity reserve.
At the same time, it would be important to improve the ex-situ plant germplasm collection and utilise them in order to adequately characterise all accessions and develop future breeding programs. In this respect, several Mediterranean countries have promoted olive germplasm collections, like that of Cordoba (Spain), Porquerolles (France) and Marrakech (Morocco) which host most of the Mediterranean varieties.
Italian germplasm is large and more variegated at regional scale, because, in the years, every region selected some varieties which, by a progressive adaptation, took on characteristics of typical ness, at present recognized by the Council Regulation (EEC) n.2081/92 on the Protected Designation of Origin (PDO) and Protected Geographical Indication (PGI). This reinforces the need to build up a molecular data base for the Italian olive germplasm considering that it, at present in Italian olive germplasm is estimated to include over 500 cultivars and over 1300 synonyms (Bartolini et al., 1998), most of which are landraces vegetatively propagated at the farm level since ancient times. The number is probably underestimated because of inadequate information on minor local varieties widespread in the different olive growing areas., according to the FAO Olive Germplasm (Bartolini et al., 1998) and the Italian Olive Card-index1. The study of less-common or minor cultivars on a regional scale is important since they may have traits not considered important in the past, but that might be important to meet the challenges of modern olive growing. Low vigor, resistance to low temperatures, salinity tolerance (Gucci and Tattini, 1997), adaptability to low pruning systems (Cantini et al., 1998), late ripening (Montedoro et al., 1990), phenol content (Perri et al., 1999) and fatty-acid content (Lanteri et al., 2002) are important traits for olive or olive oil quality. This represents an important genetic diversity reserve for the whole Mediterranean basin. Which include more possible integrating all the different data collected by several research groups working in Italy.
1.1 GENOMICS
Genomics can also be defined as the identification, analysis and utilization of DNA sequence information. After the completion of human genome sequence the genome of the model plant Arabidopsis thaliana has been sequenced. The information derived from plant-based genomics studies and their application on other plant species, including crop plants helps to understand how genes enable a plant to function, how the confusing diversity of functions that distinguish plant species is related to simple changes in their genomes. In genomics analysis there are different markers have been used, like morphological markers, protein based markers and DNA based markers. Microsatellites which provide a good genome coverage and hence are suitable as genetic markers in plant genome research.
1.2 Microsatellite DNA
Microsatellites are simple sequence repeats (SSRs) or short tandem repeats (STRs) of genomic sequences, discovered by Hamada and colleagues (1982). Tandemly repeated sequences with a very short nucleotide motif (1-6 bases long) came to be called microsatellites. Attempts have been made to standardise the nomenclature of microsatellites, no absolute consensus has been agreed upon (Tautz, 1993; Jarne and Lagoda, 1996; Chambers and MacAvoy, 2000). The microsatellites locus might be a streach of DNA with base sequence CA repeated 17 times in succession [(CA)17] or AAT repeated 10 times [(CA)10] (Queller et al., 1993). The repeated sequence (motif) is often simple, consisting of mononucleotide SSR (A)11 AAAAAAAAAAA, dinucleotide SSR (GT)6 GTGTGTGTGTGT, Trinucleotide SSR (CTG)4 CTGCTGCTGCTG and tetranucleotide SSR (ACTC)4 ACTCACTCACTCACTC. Microsatellites occur in many places (loci) throughout the genome, but the majority are in non-coding regions (Wren et al., 2000). For example, AC22 might occur in thousands of places in the genome. The trick is to find and sequence the flanking regions at a particular place (locus)-the DNA on each side of the repeat. The flanking region is a presumably random (unpatterned) stretch of nucleotides. It should occur at only one locus, because the probability that a longish unpatterned sequence arises more than once is vanishingly small -- P approximately equal to 4-60, if the total length of the flanking
regions is 60 base pairs. Because the 'beads' are all the same, microsatellite mutation can occur relatively easily, by a process called strand slippage during DNA replication (Levinson and Gutman, 1987; Schlötterer and Tautz, 1992;Strand et al., 1993). Even if a few 'beads' in the complementary strands of DNA don't match up perfectly, the rest do, and strand 1 can add some base pairs to repair the DNA match, or strand 2 can cut out a few. Mutation may also occur during recombination or during meiosis (Blouin et al., 1996). The mutation rate is relatively high (between 10 2 and 10 6 mutations per locus per generation, and on average 5 × 10 4) that generate the high levels of allelic diversity necessary for genetic studies (Schlötterer, 2000; Selkoe et al., 2006). Thus, a given population might contain variants of ACn, where n is the number of 'beads' (the motif AC repeated, head to tail, n times), with n ranging from, for example, 10 to 28. If the adjacent sequence information for the flanking regions are known, the forward and reverse primers for the polymerase chain reaction (PCR) can be designed. The PCR greatly amplifies the target microsatellite, yielding billions of times more copies than the started one. After that the PCR-amplified product run on an electrophoretic gel, through which fragments of different size travel at different rates. Amplified fragments of the same size (e.g., AC26, AC27) will form bands in the gel that can be visualized by a variety of techniques like the use of a highly efficient system of fluorescent labeling that is analyzed by a laser beam in an automated DNA sequencer. The size variants are alleles-variants of the genetic material. At any particular locus, an individual has one band/allele (if it is a homozygote) or two bands (if it's a heterozygote). In the population as a whole, however, there may be many alleles.. Most of the observed changes in microsatelliteallele sizes are attributable to deletion or addition of a fewrepetitive units (Straub et al., 1993; Deka et al., 1995).Typical vertebrate populations can have as many as 5 to 15 alleles at a given microsatellite locus. The analyses of several or many loci, it is possible to perform a genetic analyses on the resulting data sets. Potential analyses of microsatellites range from individual identification, to parentage exclusion, to relatedness calculations, to diagnosis of genetically mediated diseases, and on up to analysis of genetic differentiation between populations or species. Thus microsatellites markers are the preferred markers for wide and varied applications like genetic diversity analysis (Yang et al., 1994), cultivar identification (Thomas and Scott, 1993),
determination of hybridity (Provan et al., 1996) and diagnosis of important traits in plant breeding programs (Yu et al., 1994).
1.2.1 Microsatellites amplification
Microsatellites can be amplified for identification using Polymerase Chain Reaction (PCR), using templates of flanking regions (primers). DNA is denatured at a high temperature, separating the double strand, allowing annealing of primers and the extension of nucleotide sequences along opposite strands at lower temperatures. This process results in production of enough DNA to be visible on agarose or acrylamide gels; only small amounts of DNA are needed for amplification as thermocycling in this manner creates an exponential increase in the replicated segment (Griffiths et al., 1996) with the abundance of PCR technology, primers that flank microsatellite loci are simple and quick to use, but the development of such primers is often a tedious and costly process.
1.2.2 Microsatellite primers
Microsatellite primers are developed by cloning random segments of DNA from the focal species. These are inserted into a plasmid or phage vector, which is in turn implanted into Escherichia coli bacteria. Colonies are then developed, and screened with fluorescently–labelled oligonucleotide sequences that will hybridise to a microsatellite repeat, if present on the DNA segment. If positive clones can be obtained from this procedure, the DNA is sequenced and PCR primers are chosen from sequences flanking such regions to determine a specific locus. This process involves significant trial and error on the part of researchers, as microsatellite repeat sequences must be predicted and primers that are randomly isolated may not display significant polymorphism (Queller et al., 1993; Jarne and Lagoda, 1996). Microsatellite loci are widely distributed throughout the genome and can be isolated from semi-degraded DNA of older specimens, as all that is needed is a suitable substrate for amplification through PCR.
1.3 Polymerase Chain Reaction (PCR)
Polymerase chain reaction (PCR) a revolutionary method of gene analysis was developed by Kary Mullis in mid-1980’s. The polymerase chain reaction is a test tube system for DNA replication that allows a "target" DNA sequence to be selectively amplified, or enriched, several million-fold in just a few hours (Fig.1) without the reliance to cloning. Within a dividing cell, DNA replication involves a series of enzyme-mediated reactions, whose end result is a faithful copy of the entire genome. Within a test tube, PCR product is amplified from the DNA template using a heat-stable DNA polymerase from Thermus aquaticus (Taq DNA polymerase) and using an automated thermal cycler to put the reaction through 30 or more cycles of denaturing, annealing of primers, and polymerization.
To perform a PCR reaction, a small quantity of the target DNA is added to a test tube with a buffered solution containing DNA polymerase, oligonucleotide primers that flank the sequence, the four deoxynucleotide building blocks of DNA, and the cofactor MgCl2. The PCR mixture is taken through 6 replication cycles consisting of:
i. Denature the DNA at 94˚C.
ii. Rapidly cool the DNA (37-65˚C) and anneal primers to complementary single stranded sequences flanking the target DNA.
iii. Extend primers at 70-75˚C using a heat-resistant DNA polymerase (e.g., Taq polymerase derived from Thermus aquaticus).
iv. Repeat the cycle of denaturing, annealing, and extension 20-45 times to produce 1 million (220)to 35 trillion copies (245) of the target DNA.
v. Extend the primers at 70-75˚C once more to allow incomplete extension products in the reaction mixture to extend completely.
Fig. 1. Polymerase Chain Reaction (PCR) 1.3.1 Resolving PCR products.
After amplification by PCR, the products are separated by Agarose or polyacrylamide gel electrophoresis and are directly visualized after staining with ethidium bromide. Another alternate method, which is commercially available called chip-based nucleic acid separation system can replace the earlier method.
1.3.2 Agarose Gel Electrophoresis.
The standard method used to separate, identify, and purify DNA fragments is electrophoresis through agarose gels. The technique is simple, rapid to perform, and capable of resolving mixtures of DNA fragments that cannot be separated adequately by other sizing procedures. Furthermore, the location of DNA within the gel can be determined directly: Bands of DNA in the gel are stained with the intercalating dye ethidium bromide ; as little as 1 ng of DNA can be detected by direct examination of the gel in ultraviolet light (Sharp et al., 1973).
Agarose, which is extracted from seaweed, is a linear polymer whose basic structure is shown in (Fig. 2).
Fig. 2. Agarose structure unit
Agarose gels are cast by melting the agarose in the presence of the desired buffer until a clear, transparent solution is achieved. The melted solution is then poured into a mold and allowed to harden. Upon hardening, the agarose forms a matrix, the density of which is determined by the concentration of the agarose. When an electric field is applied across the gel, DNA, which is negatively charged at neutral pH, migrates toward the anode. The electrophoretic migration rate of DNA through agarose gels is dependent upon four main parameters, which are as below:
The molecular size of the DNA. Molecules of linear, duplex DNA, which are believed to migrate in an end-on position (Fisher and Dingman, 1971; Aaij and Borst, 1972) travel through gel matrices at rates that are inversely proportional to the logarithm of their molecular weights (Helling et al., 1974).
The agarose concentration. A DNA fragment of given size migrates at different rates through gels containing different concentrations of agarose. There is a linear relationship between the logarithm of the electrophoretic mobility of DNA (µ) and gel concentration (τ), which is described by the equation:
log µ = log µ
0 – Kτ
where µ0 is the free electrophoretic mobility and ĸ is the retardation coefficient, a constant that is related to the properties of the gel and the size of the migrating molecules. Thus, by using gels of different concentrations, it is possible to resolve a wide-range of DNA fragments.
The conformation of the DNA. Closed circular, nicked circular and linear DNA of the same molecular weight migrate through agarose gels at different rates. The relative mobilities of the three forms are dependent primarily on the agarose concentration in the
gel but are also influenced by the strength of the applied current, the ionic strength of the buffer, and the density of superhelical twists in the DNA.
The applied current. At low voltages, the rate of migration of linear DNA fragments is proportional to the voltage applied. However, as the electric field strength is raised, the mobility of high-molecular-weight fragments of DNA is increased differentially. Thus, the effective range of separation of agarose gels decreases as the voltage is increased. Gels should be run at no more than 5 V/cm.
Base composition and temperature. The electrophoretic behavior of DNA in agarose gels (by contrast to polyacrylamide gels (Allett et al., 1973) is not significantly affected either by the base composition of the DNA (Thomas and Davis, 1975) or the temperature at which the gel is run. Thus, in agarose gels the relative electrophoretic mobilities of DNA fragments of different sizes do not change between 4psy176 C and 30psy176 C.
Fig. 3. Photograph of agarose gel, showing taped edges and well-forming comb in position.
The agarose concentration is varied for different fragment ranges. For analyzing the complete 2ar codon (1239 bp), a 1% agarose gel is made by dissolving agarose in 1x TAE buffer by heating in a microwave oven. After cooling to about 60 psy 176 C, ethidium bromide is added to a final concentration of 0.5 µg/ml. The agarose solution is poured into a taped gel former mold to make the gel (Fig. 3). A well-forming comb (12 slots for minigels) is placed near one edge of the gel. The gel is cooled to harden until it becomes milky and opaque (approximately one hour). The gel mold is placed
horizontally into the electrophoresis tank, which is filled with 1xTAE (0.5 µg/ml ethidium bromide).
The gel loading buffer is applied to the samples and they are carefully added to individual wells. The electrophoresis is run by 70-100 V/20-80 mA for about an hour or at 20 to 30 V overnight. The size of fragments can be determined by calibrating the gel, using known standards (e.g., λDNA EcoRI / HindIII digest, Boehringer Mannheim, or 100bp ladder, BioVentures, Inc.), and comparing the distance the unknown fragment has migrated.
The most convenient method of visualizing DNA in agarose gels is by use of the fluorescent dye ethidium bromide (Sharp et al., 1973) (2,7-Diamino-10-ethyl-9-phenyl-phenanthridinium bromide). This substance (Fig. 4) contains a planar group that intercalates between stacked bases of DNA. The fixed position of this group and its close proximity to the bases causes dye bound to DNA to display an increased fluorescent yield compared to dye in free solution. UV-irradiation absorbed by the DNA at 260 nm and transmitted to the dye, or irradiation absorbed at 300 nm and 360 nm by the bound dye itself, is emitted at 590 nm in the red-orange region of the visible spectrum.
Fig. 4. Ethidium bromide
Ethidium bromide can be used to detect both single- and double-stranded nucleic acids. However, the affinity of the dye for single-stranded nucleic acid is relatively low and the fluorescent yield is poor.
Fig. 5. Verification of PCR product on Agarose gel.
1.3.3 Chip-based nucleic acid separation.
Principles of Nucleic Acid and Protein Analysis on a Chip2
The electrophoretic assays are based on traditional gel electrophoresis principles that have been transferred to a chip format. The chip format dramatically reduces separation time and sample consumption. The system provides automated sizing and quantitation information in a digital format. On-chip gel electrophoresis is performed for the analysis of DNA, RNA and proteins.
Fig. 6. Major components and DNA chip of Agilent 2100 Bioanalyzer
The chip accommodates sample wells, gel wells and a well for an external standard (ladder). Micro-channels are fabricated in glass to create interconnected networks among these wells (Fig. 6). During chip preparation, the micro-channels are filled with a sieving polymer and fluorescence dye. Once the wells and channels are filled, the chip becomes an integrated electrical circuit. The 16-pin electrodes of the cartridge are arranged so that they fit into the wells of the chip. Each electrode is connected to an independent power supply that provides maximum control and flexibility. Charged biomolecules like DNA or RNA are electrophoretically driven by a voltage gradient-similar to slab gel electrophoresis. Because of a constant mass-to-charge ratio and the presence of a sieving polymer matrix, the molecules are separated by size. Smaller fragments are migrating faster than larger ones. Dye molecules intercalate into DNA or RNA strands or Protein-SDS micells. These complexes are detected by laser-induced fluorescence. Data is translated into gel-like images (bands) and electropherograms (peaks) (Fig. 7). With the help of a ladder that contains fragments of known sizes and concentrations, a standard curve of migration time versus fragments size is plotted. From the migration times measured for each fragment in the sample, the size is calculated.
For DNA and protein assays, quantitation is done with the help of the upper marker. The area under the upper marker peak is compared with the sample peak areas. Because the concentration of the upper marker is known, the concentration for each sample can be calculated. Besides this relative quantitation, an absolute quantitation is available for protein assays, using external standard proteins.
The 2100 expert software plots fluorescence intensity versus migration time and produces an electropherogram for each sample.
Fig. 7. A DNA 7500 assay as displayed in the Aglent 2100 biosyzing software. Data is presented both as electrophograms and a slab gel-like image.
1.3.4 Polyacrylamide gel electrophoresis3
Separation of DNA molecules differing in length by just one nucleotide.
Polyacrylamide gel electrophoresis is used to examine the families of chain-terminated DNA molecules resulting from a sequencing experiment. Agarose gel electrophoresis cannot be used for this purpose because it does not have the resolving power needed to separate single-stranded DNA molecules that differ in length by just one nucleotide. Polyacrylamide gels have smaller pore sizes than agarose gels and allow precise separations of molecules from 10 1500 bp. As well as DNA sequencing, polyacrylamide gels are also used for other applications where fine-scale DNA separations are required, for instance in the examination of amplification products from PCRs directed at microsatellite loci, where the products of different alleles might differ in size by just two or three base pairs. A polyacrylamide gel consists of chains of
acrylamide monomers (CH2=CH-CO-NH2) crosslinked with N, N -methylenebisacrylamide units (CH2=CH-CO-NH-CH2-NH-CO-CH-CH2), the latter commonly called 'bis'. The pore size of the gel is determined by both the total concentration of monomers (acrylamide + bis) and the ratio of acrylamide to bis. For DNA sequencing, a 6% gel with an acrylamide : bis ratio of 19 : 1 is normally used because this allows resolution of single-stranded DNA molecules between 100 and 750 nucleotides in length. About 650 nucleotides of sequence can therefore be read from a single gel. The gel concentration can be increased to 8% in order to read the sequence closer to the primer (resolving molecules 50 400 nucleotides in length) or decreased to 4% to read a more distant sequence (500 1500 nucleotides from the primer). Polymerization of the acrylamide : bis solution is initiated by ammonium persulfate and catalyzed by TEMED (N, N, N , N -tetramethylethylenediamine). Sequencing gels also contain urea, which is a denaturant that prevents intra-strand base pairs from forming in the chain-terminated molecules. This is important because the change in conformation resulting from base-pairing alters the migration rate of a single-stranded molecule, so the strict equivalence between the length of a molecule and its band position, critical for reading the DNA sequence is lost.
Polyacrylamide gels are prepared between two glass plates held apart by spacers. This arrangement serves two purposes. First, it enables a very thin (<1 mm) gel to be made, which facilitates sequence reading by improving the sharpness of the bands. Second, it ensures that polymerization, which is inhibited by oxygen, occurs evenly throughout the gel. With such a thin gel the amount of DNA per band is small and the banding pattern is only barely visible after ethidium bromide staining. For this reason, a radioactively labeled nucleotide is usually included in the sequencing reactions so that the banding pattern can be visualized by autoradiography
1.4 DNA Sequencing.
Rapid and efficient methods for determining the nucleotide sequence of DNA were first devised in the mid-1970s. Two different procedures were published at almost the same time:
1.4.1 Principles of DNA Sequencing4
The process of determining the order of the nucleotide bases along a DNA strand is called sequencing. In 1977, twenty-four years after the discovery of the structure of DNA, two separate methods for sequencing DNA were developed: the chain termination method (Sanger et al., 1977) and the chemical degradation method (Maxam and Gilbert, 1977). Both methods were equally popular to begin with, but, for many reasons, the chain termination method is the method more commonly used today (Fig. 8). This method is based on the principle that single-stranded DNA molecules that differ in length by just a single nucleotide can be separated from one another using polyacrylamide gel electrophoresis, described earlier. All the steps in a sequencing reaction (like in PCR), which are repeated for 30 or 40 cycles. The DNA to be sequenced, called the template DNA, is first prepared as a single-stranded DNA. Next, a short oligonucleotide is annealed, or joined, to the same position on each template strand. The oligonucleotide acts as a primer for the synthesis of a new DNA strand that will be complimentary to the template DNA. This technique requires that four nucleotide-specific reactions--one each for G, A, C, and T--be performed on four identical samples of DNA. The four sequencing reactions require the addition of all the components necessary to synthesize and label new DNA, including:
• A DNA template;
• A primer tagged with a mildly radioactive molecule or a light-emitting chemical; • DNA polymerase--an enzyme that drives the synthesis of DNA;
• Four deoxynucleotides (G, A, C, T); and
• One dideoxynucleotide, either ddG, ddA, ddC, or ddT.
After the first deoxynucleotide is added to the growing complementary sequence, DNA polymerase moves along the template and continues to add base after base. The strand synthesis reaction continues until a dideoxynucleotide is added, blocking further elongation. This is because dideoxynucleotides are missing a special group of molecules, called a 3'-hydroxyl group, needed to form a connection with the next nucleotide. Only a small amount of a dideoxynucleotide is added to each reaction,
4
allowing different reactions to proceed for various lengths of time, unti, by chance, DNA polymerase inserts a dideoxynucleotide , terminating the reaction. Therefore, the result is a set of new chains, all of different lengths. To read the newly generated sequence, the four reactions are run side-by-side on a polyacrylamide sequencing gel. The family of molecules generated in the presence of ddATP are loaded into one lane of the gel and the other three families, generated with ddCTP, ddGTP, and ddTTP, are loaded into three adjacent lanes. After electrophoresis, the DNA sequence can be read directly from the positions of the bands in the gel.
1.4.2 Separation of the molecules.
After the sequencing reactions, the mixture of strands, all of different length and all ending on a fluorescently labeled ddNTP have to be separated; This is done on an acrylamide gel, which is capable of separating a molecule of 30 bases from one of 31 bases, but also a molecule of 750 bases from one of 751 bases. All this is done with gel electrophoresis. DNA has a negative charge and migrates to the positive side. Smaller fragments migrate faster, so the DNA molecules are separated on their size.
1.4.3 Automated DNA sequencing with fluorescently labeled dideoxynucleotides.
Variations of this method have been developed for automated sequencing machines. In one method, called cycle sequencing, the dideoxynucleotides--not the primers--are tagged with different colored fluorescent dyes, thus all four reactions occur in the same tube and are separated in the same lane on the gel. As each labeled DNA fragment passes a detector at the bottom of the gel, the color is recorded and the sequence is reconstructed from the pattern of colors representing each nucleotide in the sequence (Fig. 9).
Fig. 9. A. The basic set up of a capillary system. The fluorescently labelled fragments that migrate trough the gel, are passing a laser beam at the bottom of the gel. The laser exites the fluorescent molecule, which sends out light of a distinct color. That light is collected and focused by lenses into a spectrograph. Based on the wavelength, the spectrograph separates the light across a CCD camera (charge coupled device). Each base has its own color, so the sequencer can detect the order of the bases. B. The final sequence electropherogram output.
1.5 Phylogenetics.5
The word derived form (Greek: phylon = tribe, race and genetikos = relative to birth, from genesis = birth) is the study of evolutionary relatedness among various groups of organisms (e.g., species, populations).
1.5.1 Purpose of phylogenetics.
With the aid of sequences, it should be possible to find the genealogical ties between organisms. Experience learns that closely related organisms have similar sequences, more distantly related organisms have more dissimilar sequences. One objective is to reconstruct the evolutionary relationship between species.
An other objective is to estimate the time of divergence between two organisms since they last shared a common ancestor.
1.5.2 Disclaimers.
The theory and practical applications of the different models are not universally accepted.
With one dataset, different software packages can give different results. Changes in the dataset can also give different results. Therefore, it is important to have a good alignment to start with.
Trees based on an alignment of a gene represent the relationship between genes and this is not necessarily the same relationship as between the whole organisms. If trees are calculated based on different genes from organisms, it is possible that these trees result in different relationships.
Fig. 10. The tree terminology. node : a node represents a taxonomic unit. This can be a taxon (an existing species) or an ancestor (unknown species : represents the ancestor of 2 or more species). branch : defines the relationship between the taxa in terms of descent and ancestry. topology : is the branching pattern. branch length : often represents the number of changes that have occurred in that branch. root : is the common ancestor of all taxa. distance scale : scale which represents the number of differences between sequences (e.g. 0.1 means 10 % differences between two sequences)
1.5.3 Methods of phylogenetic analysis
There are two major groups of analyses to examine phylogenetic relationships between sequences:
i. Phenetic methods: trees are calculated by similarities of sequences and are based on distance methods. The resulting tree is called a dendrogram and does not necessarily reflect evolutionary relationships. Distance methods compress all of the individual differences between pairs of sequences into a single number.
ii. Cladistic methods : trees are calculated by considering the various possible pathways of evolution and are based on parsimony or likelihood methods. The resulting tree is called a cladogram. Cladistic methods use each alignment position as evolutionary information to build a tree.
1.5.4 Phenetic methods based on distances.
i. Starting from an alignment, pairwise distances are calculated between DNA sequences as the sum of all base pair differences between two sequences (the most similar sequences are assumed to be closely related). This creates a distance matrix. All base changes can be considered equally or a matrix of the possible replacements can be used.
Insertions and deletions are given a larger weight than replacements. Insertions or deletions of multiple bases at one position are given less weight than multiple independent insertions or deletions. it is possible to correct for multiple substitutions at a single site.
ii. From the obtained distance matrix, a phylogenetic tree is calculated with clustering algorithms. These cluster methods construct a tree by linking the least distant pair of taxa, followed by successively more distant taxa.
UPGMA clustering (Unweighted Pair Group Method using Arithmetic averages) : this is the simplest method.
Neighbor Joining : this method tries to correct the UPGMA method for its assumption that the rate of evolution is the same in all taxa.
2. PROTEOMICS.
Proteomics is the study of the function of all expressed proteins (Tyers and Mann, 2003). The term proteome was first coined to describe the set of proteins encoded by the genome (Wilkins et al., 1996). The study of the proteome, called proteomics, which deal with all the proteins in a cell, all protein isoforms, post-translational modifications. Proteomics is much more diverse and complicated than genomics. Most importantly, while the genome is a rather constant entity, the proteome differs from cell to cell and is constantly changing through its biochemical interactions with the genome and the environment. One organism has radically different protein expression in different parts of its body, in different stages of its life cycle and in different environmental conditions.
Proteomics is a quite new field of research that study and analyse the proteome of an individual. This new discipline can be defined as “the qualitative and quantitative comparison between the proteome in different conditions with the objective of understanding the cellular processes which subject the biological one (Anderson and Anderson, 1996).
Furthermore, proteomics is a complex methodology because it is made by the combination of more than one techniques, mixed together to obtain complete information about all the proteins inside of a cell. There are many possible applications: identification and characterization of single or mixture proteins; analysis of proteins profile; finding of new proteins, post-traditional modifications and of new markers; characterization of glycosilation and phosphorilation sites; assays of peptides and proteins. Many research groups use also this discipline for the characterization of protein mutations by the comparison between healthy and diseased cells (David et al., 2005). Proteomics can detect and assay with accuracy all the changes induced by a specific alteration as for examples, a genetic mutation and/or pharmacological and pathological matters(Gygi and Ruedi, 2000)
Nowadays, the proteomics research can be divided into two principal branches expression proteomics and functional proteomics (Tyers and Mann, 2003). Expression
proteomics target the qualitative and quantitative definition of the growth and reduction of the protein expression levels induced by variations of cellular conditions. The main targets of the functional proteomics are, instead, the recognition of biological function of proteins, which nowadays unknown, and the identification of in vivo protein-protein interactions, with the purpose of description cellular processes at molecular level.
The great versatility of the proteomic approach is substantially legacy to the multiple techniques employed for the study of proteome. Generally it is carried out by an efficient extraction/isolation and purification of protein from complex mixtures. The separation of simple protein mixtures by using one- dimension (1-D) sodium dodecyl sulphate polyacrylamide gel electrophoresis (SDS-PAGE). While the complex protein mixtures, such as total cell lysates, require the use of the highly resolving two-dimensional (2-D) SDS-PAGE. And the identification by using the mass spectrometry, MALDI-MS (Matrix Assisted Laser Desorption Ionization-Mass Spectrometry) and/or MSMS followed by extensive database searches. In some cases if more structural information is required form the separated protein mixture the liquid chromatography (LC)-electrospray ionization (LC-ESI- MS and LC-ESI-MS/MS) is often employed (Fenn et al., 1989).
2.1 Proteomics Strategy.
2.1.1 Protein extraction and sample preparation.
The extraction and preparation of samples is a critical step and has a great impact on any proteomics study. Since proteins are not a homogeneous entity, having different biophysical and chemical properties, it is important to characterize the correct conditions for solubilization of biological samples (Herbert, 1999). Protein solubilization is the process of breaking interactions involved in protein aggregation (Rabilloud, 1996). Sample solubilization solutions typically contain a number of compounds including detergents, reducing agents, phosphatase and protease inhibitors and also some time denaturing solvents are used for the "linearization” of proteins which facilitate the solubilization. The successive step follows after the sample
preparation is the separation of proteins. The method more common in order to separate the protein mixture by electrophoresis mono or bidimensional (1-D or 2-D SDS-PAGE ) (Rabilloud, 1996).
Fig. 11. Proteomics strategy
2.1.2 Protein separation.
Various approaches are possible for protein separation (Fig. 11) including 1-D SDS-PAGE. However, for quantitative and comparative proteomic analysis, there is still no widely available technology that surpasses 2-D gel electrophoresis (2-DE), which has been the method of choice for separation of complex protein mixtures for several decades (Rose et al., 2004). In the 2-D-PAGE the protein mixtures resolved first in one dimension isoelectrofocusing (IEF), that separates proteins on the basis of isoelectric point (pI). These proteins are then resolved on a second dimension SDS- PAGE, which separate according to molecular weight (MW). The proteins, that run on the gel, that have been separated during electrophoresis, can be visualized using different staining techniques, most common are Coomassie Brilliant Blue staining is relatively easy, cost-effective and compatible with subsequent protein identification by mass spectrometry (MS), but it is only moderately sensitive, with a limit of approximately 10 ng protein. The other alternative has been silver-staining, which is more sensitive, detecting as little as 0.5 ng protein (Heazlewood and Millar, 2003) but not particularly quantitative and less suitable for MS identification (Lopez, 2000; Patton, 2000). Moreover, although the
two dimension gel electrophoresis (2-DE) is the method of choice for separation of complex protein mixtures. The basic proteins and/or the proteins of low molecular weight are difficult to separate by electrophoresis, an alternative approach is the protein fractionation is pre-fractionation at the peptide level. Then the protein are digested in solution and resulting peptides are separated using 2-D chromatography: in the first dimension according to their charge (typically SCX chromatography) and in the second dimension according to hydrophobicity by reversed-phase chromatography. (Stasyk et al., 2004).
2.1.3 Protein identification
The mass spectrometry is widely used and is the method of choice for both protein identification and characterization. The first step toward protein identification is typically excision of 1-D or 2-D gel containing the protein bands or spots of interest, in-gel digestion with a site-specific protease (commonly trypsin), and finally MS analysis of the resultant eluted peptides (Figure 11). Two MS platforms in particular represent powerful tools for proteomic studies. The first, matrix-assisted laser desorption/ionization time-of-flight (MALDI-TOF) MS is typically used to measure the masses of the peptides derived from the trypsinized parent protein spot, generating a ‘peptide mass fingerprint’ (PMF). A common alternative to the PMF approach is de novo sequencing by electrospray ionization tandem mass spectrometry (ESI) MS/MS, which yields amino acid sequences of selected tryptic peptides (Figure 11). The first step of tandem MS involves ionization of a sample and separation based upon the mass-to-charge ratio (m/z) of the primary ions. An ion with a specific m/z value is then selected, fragmented, and the fragment ions detected after passing through the second mass spectrometer. This process produces a series of fragment ions that can differ by single amino acids allowing a portion of the peptide sequence, termed an ‘amino acid sequence tag’, to be determined and used for database searching (Rose et al., 2004).
2.2 Electrophoresis of Proteins.
2.2.1 One-Dimensional SDS-PAGE.
The single most widely used analytical separation in all of protein chemistry, is reasonably useful for proteomic analysis. SDS-PAGE, officially sodium dodecyl sulfate polyacrylamide gel electrophoresis, uses a discontinuous polyacrylamide gel as a support medium and sodium dodecyl sulfate (SDS) to denature the proteins a very common method for separating proteins according to their size (length of polypeptide chain or molecular weight). One-dimensional-SDS-PAGE is done on gels in which the extent of cross-linking (i.e., polymerization of the acrylamide). There are many different methods of performing SDS-PAGE based on whether analysis is required in a native or denatured state and the size of the molecules being analysed.The first ever published paper by Laemmli (1970) using SDS-PAGE is the method of choice, while the method of (Schägger et al., 1987) is popular for polypeptides of 10 kDa or less.
SDS (also called lauryl sulfate) is an anionic detergent that binds to proteins according to a constant weight ratio (1.4 g SDS per gram of protein) independent of the nature of the protein (Reynolds and Tanford, 1970). The intrinsic charges of polypeptides are negligible compared to the negative charges provided by SDS, so that SDS-polypeptide complexes have essentially identical charge densities. Under this condition, proteins migrate in polyacrylamide gels strictly according to their size (Weber and Osborn, 1969). Separation of Proteins under Denaturing conditions, it is usually necessary to reduce disulphide bridges in proteins before they adopt the random-coil configuration necessary for separation by size: this is done with β-mercaptoethanol or dithiothreitol. In denaturing SDS-PAGE separations therefore, migration is determined not by intrinsic electrical charge of the polypeptide, but by molecular weight.
2.2.2 Determination of Molecular Weight.
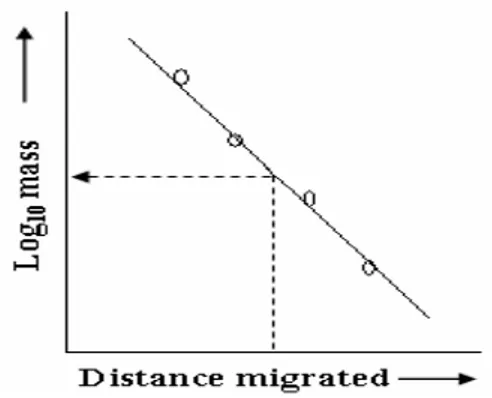
This is done by SDS-PAGE of proteins or PAGE or agarose gel electrophoresis of nucleic acids of known molecular weight along with the protein or nucleic acid to be characterised. A linear relationship exists between the logarithm of the molecular weight
of an SDS-denatured polypeptide, or native nucleic acid, and its Rf. The Rf is calculated as the ratio of the distance migrated by the molecule to that migrated by a marker dye-front. A simple way of determining relative molecular weight by electrophoresis (Mr) is to plot a standard curve of distance migrated vs. log10MW for known samples, and read off the logMr of the sample after measuring distance migrated on the same gel (Fig. 12).
Fig. 12. Determining relative molecular weight of an unknown protein by comparison of its electrophoretic mobility with markers of known mass
2.2.3 Buffer Systems.
There are two types of buffer systems in electrophoresis, continuous and discontinuous. Most protein separations are performed using a "discontinuous" buffer system that significantly enhances the sharpness of the bands within the gel. During electrophoresis in a discontinuous gel system, an ion gradient is formed in the early stage of electrophoresis that causes all of the proteins to focus into a single sharp band. This occurs in a region of the gel that has larger pores so that the gel matrix does not retard the migration during the focusing or "stacking" event. Negative ions from the buffer in the tank then "outrun" the SDS-covered protein "stack" and eliminate the ion gradient so that the proteins subsequently separate by the sieving action in the lower, "resolving" region of the gel.
Many labs use a tris-glycine or "Laemmli" buffering system that stacks and resolves at a pH of ~8.3-9.0. These pHs promote disulfide bond formation between cysteine residues in the proteins, especially when they are present at high concentrations because the pKa of cysteine ranges from 8-9 and because reducing agent present in the loading buffer doesn't co-migrate with the proteins. Recent advances in buffering technology alleviate
this problem by resolving the proteins at a pH well below the pKa of cysteine (e.g., bis-Tris, pH 6.5) and include reducing agents (e.g. sodium bisulfite) that move into the gel ahead of the proteins to maintain a reducing environment. An additional benefit of using buffers with lower pHs is that the acrylamide gel is more stable so the gels can be stored for long periods of time before use.
2.2.4 Two-Dimensional SDS-PAGE.
O’Farrell in 1975 described Two-dimensional (2-D) gel electrophoresis, separates proteins in the first dimension according to their isoelectric point (pI), and in the second dimension according to their molecular weight (Fig. 13). It is possible to separate several hundred proteins from a total cellular extract. 2-D gel electrophoresis proved a very useful tool for proteomic studies when combined with microsequencing, amino acid composition and mass spectrometry.
The two different ways of separating proteins in the first dimension on the basis of their isoelectric point. The first proteins are separated in a pH gradient generated by applying an electric field to a gel containing a mixture of free carrier ampholytes (An der Lan and Chrambach, 1985). Carrier amphoiytes are low molecular mass components with both amino and carboxyl groups. According to the second way, the pH gradient is generated by a different type of chemicals, the immobilines (Bjellqvist et al., 1982). The immobilines are acrylamide derivatives carrying amino or carboxyl groups. These immobilines are copolymerized with the acrylamide gel matrix such that an immobilized pH gradient is generated.
2.2.5 Principles of Two-Dimensional Gel Electrophoresis.
Two-Dimensional gel electrophoresis of proteins is carried out under denaturing conditions. In order to separate proteins in the first dimension, proteins are solubilized in the presence of urea which essentially works by disrupting hydrogen bonds. This denaturant has the advantage that it does not affect the intrinsic charge of proteins so that it allows us to separate proteins only on the basis of their charge. When loaded on a
pH gradient of adequate porosity, proteins will migrate until they have no net charge, i.e when they reach the pH of the gradient corresponding to their isoelectric point (PI). After separation of proteins according to their charge, proteins are separated in a second dimension in the presence of sodium dodecylsulfate (SDS).
Fig. 13.Two-dimensional gel electrophoresis. The protein mixture is first subjected to
isoelectric focusing (IEF) in one dimension and then to SDS-PAGE in the second dimension.
2.2.6 Isoelectric focusing (IEF)6.
This technique is similar to the first step in 2D-SDS-PAGE. Isoelectric focusing (IEF) is an electrophoretic method that separates proteins according to their isoelectric points (pI). Proteins are amphoteric molecules; they carry either positive, negative, or zero net charge, depend-ing on their amino acid composition and the pH of their surroundings. The net charge of a protein is the sum of all the negative and positive charges of its amino acid side chains and amino- and carboxyl-termini. The isoelectric point is the specific pH at which the net charge of the protein is zero. Proteins are positively charged at pH values below their pI and negatively charged at pH values above their pI (Fig. 14).
Fig.14.Net charge on a protein as a function of pH. In this example the protein has a net charge of +2 at pH 5.5, 0 at pH 7.5 (the isoelectric point), and -1 at pH 8.5.
The presence of a pH gradient is critical to the IEF technique. In a pH gradient, under the influence of an electric field a protein will move to the position in the gradient where its net charge is zero. A protein with a positive net charge will migrate toward the cathode, becoming progressively less positively charged as it moves through the pH gradient until it reaches its pI. A protein with a negative net charge will migrate toward the anode, becoming less negatively charged until it also reaches zero net charge. If a protein should diffuse away from its pI, it immediately gains charge and migrates back to its isoelectric position. This is the focusing effect of IEF, which concentrates proteins at their pIs and separates proteins with very small charge differences. Because the degree of resolution is determined by electric field strength, IEF is performed at high voltages (typically in excess of 1000 V). When the proteins have reached their final positions in the pH gradient, there is very little ionic movement in the system, resulting in a very low final current (typically below 1 mA).
One method for generating pH gradients in IEF gels relies on carrier ampholytes. Carrier ampholytes are small, soluble, amphoteric molecules with a high buffering capacity near their pI. Commercial carrier ampholyte mixtures comprise hundreds of individual polymeric species with pIs spanning a specific pH range. When a voltage is applied across a carrier ampholyte mixture (Fig 15) , the carrier ampholytes with the lowest pI (and the most negative charge) move toward the anode, and the carrier ampholytes with the highest pI (and the most positive charge) move toward the cathode.
The other carrier ampholytes align themselves between the extremes, according to their pIs, and buffer their environment to the corresponding pH. The result is a continuous pH gradient.
Fig 15.Creating a carrier ampholyte pH gradient. (A) No voltage applied. (B) Ampholytes and
proteins move by electrophoresis when charged. (C) At isoelectric pH, ampholytes and proteins are focused.
IEF can be run in either a native or a denaturing mode. Native IEF is the more convenient option, as precast native IEF gels are available in a variety of pH gradient ranges. This method is also preferred when native protein is required, as when activity staining is to be employed. The use of native IEF, however, is often limited by the fact that many proteins are not soluble at low ionic strength or have low solubility close to their isoelectric point. In these cases, denaturing IEF is employed. Urea is the denaturant of choice, as this uncharged compound can solubilize many proteins not otherwise soluble under IEF conditions. Detergents and reducing agents are often used in conjunction with urea for more-complete unfolding and solubilization. Urea is not stable in aqueous solution, so precast IEF gels are not manufactured with urea. Dried precast gels are a convenient alternative; they have been cast, rinsed, and dried and can be rehydrated with urea, carrier ampholytes, and other additives before use. Although useful, carrier ampholytes have some limitations. Because the carrier ampholyte– generated gradient is dependent on the electric field, it breaks down when the field is removed. The pH gradients are also susceptible to gradient drift (or cathodic drift), a phenomenon in which there is a gradual decrease in pH at the cathodic (–) end of the gel and a flattening out of the pH at the anodic (+) end. For this reason it is important to not over focus the protein, because cathodic drift will increase over time. There can be
significant batch-to-batch and company-to-company variations in the properties of carrier ampholytes, which limits the reproducibility of focusing experiments. Another problem encountered with carrier ampholytes is their tendency to bind to the sample proteins, which may alter the migration of the protein and render the separation of carrier ampholytes from the focused protein difficult.
Acrylamido buffers are an alternative means to form pH gradients that circumvent most of the limitations of carrier ampholytes. Chemically, they are acrylamide derivatives of simple buffers and do not exhibit amphoteric behavior. The acrylic function of an acrylamido buffer co-polymerizes with the gel matrix and, by pouring a gel that incorporates an appropriate gradient of acrylamido buffers, an immobilized pH gradient (IPG) is formed. The protein sample can be applied immediately (no prefocusing is needed). The pH gradient is stable and does not drift in an electric field. Additionally, the gels are not susceptible to cathodic drift, because the buffers that form the pH gradient are immobilized within the gel matrix. Acrylamido buffers are available commercially with a specific pK value (or optimum pH buffering range), suitable for casting gradients from pH 3–10.
Because reproducible linear gradients with a slope as low as 0.01 pH units/cm can separate proteins with pI differences of 0.001 pH units, the resolution possible with immobilized pH gradient gels is 10–100 times greater than that obtained with carrier ampholyte–based IEF. IEF is best performed in a flatbed electrophoresis apparatus. This type of apparatus allows very effective cooling, which is necessary due to the high voltages employed for IEF. Manufactures offers a variety of precast gels for IEF, including ready to use carrier ampholyte gels, dried IPG gels, and dried acrylamide gels ready for reswelling in a mixture of carrier ampholytes and any other additives desired, such as detergent and denaturants.
2.3 Mass spectrometry7.
Mass spectrometry is an analytical tool used for measuring the molecular mass of a sample. For large samples such as biomolecules, molecular masses can be measured to within an accuracy of 0.01% of the total molecular mass of the sample i.e. within a 4 Daltons (Da) or atomic mass units (amu) error for a sample of 40,000 Da. This is sufficient to allow minor mass changes to be detected, e.g. the substitution of one amino acid for another, or a post-translational modification. For small organic molecules the molecular mass can be measured to within an accuracy of 5 ppm or less, which is often sufficient to confirm the molecular formula of a compound, and is also a standard requirement for publication in a chemical journal. Structural information can be generated using certain types of mass spectrometers, usually those with multiple analysers which are known as tandem mass spectrometers. This is achieved by fragmenting the sample inside the instrument and analysing the products generated. This procedure is useful for the structural elucidation of organic compounds and for peptide or oligonucleotide sequencing.
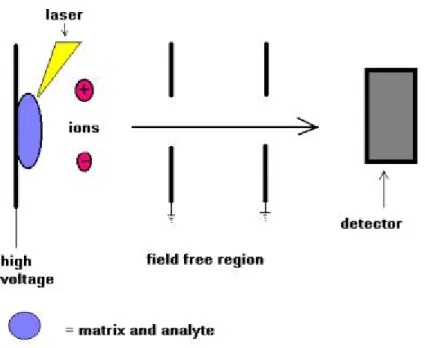
Mass spectrometers can be divided into three fundamental parts, namely the ionisation source , the analyser , and the detector.
The sample has to be introduced into the ionisation source of the instrument. Once inside the ionisation source, the sample molecules are ionised, because ions are easier to manipulate than neutral molecules. These ions are extracted into the analyser region of the mass spectrometer where they are separated according to their mass (m) -to-charge (z) ratios (m/z) . The separated ions are detected and this signal sent to a data system where the m/z ratios are stored together with their relative abundance for presentation in the format of a m/z spectrum .
The analyser and detector of the mass spectrometer, and often the ionisation source too, are maintained under high vacuum to give the ions a reasonable chance of travelling from one end of the instrument to the other without any hindrance from air molecules. The entire operation of the mass spectrometer, and often the sample introduction process also, is under complete data system control on modern mass spectrometers.
2.3.1 Sample introduction.
The method of sample introduction to the ionisation source often depends on the ionisation method being used, as well as the type and complexity of the sample.
The sample can be inserted directly into the ionisation source, or can undergo some type of chromatography en route to the ionisation source. This latter method of sample introduction usually involves the mass spectrometer being coupled directly to a high pressure liquid chromatography (HPLC), gas chromatography (GC) or capillary electrophoresis (CE) separation column, and hence the sample is separated into a series of components which then enter the mass spectrometer sequentially for individual analysis.
2.3.2 Methods of sample ionisation
Many ionisation methods are available and each has its own advantages and disadvantages The ionisation method to be used depend on the type of sample under investigation and the mass spectrometer available. The ionisation methods used for the majority of biochemical analyses are Electrospray Ionisation (ESI) and Matrix Assisted Laser Desorption Ionisation (MALDI).
2.3.3 Analysis and Separation of Sample Ions.
The main function of the mass analyser is to separate , or resolve , the ions formed in the ionisation source of the mass spectrometer according to their mass-to-charge (m/z) ratios. There are a number of mass analysers currently available, the better known of which include quadrupoles , time-of-flight (TOF) analysers, magnetic sectors , and both Fourier transform and quadrupole ion traps .
These mass analysers have different features, including the m/z range that can be covered, the mass accuracy, and the achievable resolution. The compatibility of different analysers with different ionisation methods varies. For example, all of the analysers listed above can be used in conjunction with electrospray ionisation, whereas MALDI is not usually coupled to a quadrupole analyser.
Tandem (MS-MS) mass spectrometers are instruments that have more than one analyser and so can be used for structural and sequencing studies. Two, three and four analysers have all been incorporated into commercially available tandem instruments, and the analysers do not necessarily have to be of the same type, in which case the instrument is a hybrid one. More popular tandem mass spectrometers include those of the quadrupole-quadrupole, magnetic sector-quadrupole , and more recently, the quadrupole-time-of-flight geometries.
2.3.4 Detection and recording of sample ions.
The detector monitors the ion current, amplifies it and the signal is then transmitted to the data system where it is recorded in the form of mass spectra . The m/z values of the ions are plotted against their intensities to show the number of components in the sample, the molecular mass of each component, and the relative abundance of the various components in the sample.
The type of detector is supplied to suit the type of analyser; the more common ones are the photomultiplier , the electron multiplier and the micro-channel plate detectors.
2.4 Electrospray.
Electrospray mass spectrometry (ESMS) has been developed for use in biological mass spectrometry by (Fenn et al., 1989).
2.4.1 Electrospray ionisation.
Electrospray Ionisation (ESI) is one of the Atmospheric Pressure Ionisation (API) techniques and is well-suited to the analysis of polar molecules ranging from less than 100 Da to more than 1,000,000 Da in molecular mass (Fig. 16).
Fig. 16. Standard electrospray ionisation source (Platform II)
During standard electrospray ionisation (Yamashita and Fenn, 1984), the sample is dissolved in a polar, volatile solvent and pumped through a narrow, stainless steel capillary (75 - 150 micrometers i.d.) at a flow rate of between 1 µL/min and 1 mL/min. A high voltage of 3 or 4 kV is applied to the tip of the capillary, which is situated within the ionisation source of the mass spectrometer, and as a consequence of this strong electric field, the sample emerging from the tip is dispersed into an aerosol of highly charged droplets, a process that is aided by a co-axially introduced nebulising gas flowing around the outside of the capillary (Fig. 17). This gas, usually nitrogen, helps to direct the spray emerging from the capillary tip towards the mass spectrometer. The