A Cytokine Pattern That Differentiates Preseroconversion
From Postseroconversion Phases of Primary HIV Infection
Lucia Pastor, MSc,*
†‡ Erica Parker, MD,§ Jorge Carrillo, PhD,*† Victor Urrea, PhD,*
Laura Fuente-Soro, MSc,
†k Durval Respeito, MD,k Chenjerai Jairoce, MVD,k
Inacio Mandomando, PhD,
k Julià Blanco, PhD,*‡¶ and Denise Naniche, PhD†
Background:During acute HIV infection, HIV actively replicates but seroconversion has not yet occurred. Primary HIV infection (PHI) is characterized by a transient nonspecific febrile illness, a massive inflammatory response, and the progressive appearance of anti-HIV-specific antibodies. In this study, we have identified patterns of inflammatory biomarkers associated with the innate
immunological reaction before completion of a full
humoral response.
Methods: A symptom-based screening was used to identify acute HIV infection in the Manhiça District Hospital in Mozambique. Plasma levels of biomarkers were determined by Luminex and enzyme-linked immunosorbent assay. Anti-HIV
antibodies were analyzed byflow cytometry and Western blot.
Statistical analyses used random forest and logistic
regression models.
Results:Of 3116 rapid test seronegative or indeterminate individ-uals, 85 (2.7%) had positive plasma HIV viral load and were enrolled as PHI, of which n = 45 (52.9%), n = 8 (9.4%), n = 12 (14.1%), and n = 20 (23.5%) were classified as Fiebig I-III, IV, V, and VI stages, respectively, by Western blot. Comparison of individuals at early (Fiebig I-IV) and late (Fiebig V-VI) immune stages identified significant differences in the expression level of plasma B-cell activating factor , monocyte chemotactic protein-1, sCD163, and monokine induced by interferon (IFN-g). This cytokine signature classified patients in the preseroconversion phase with a sensitivity of 92.5% and a specificity of 81.2%
Conclusions:Identification of a cytokine signature specific for the preseroconversion stage of PHI may help to understand the earliest HIV pathogenic events and identify new potential targets for immunotherapy aimed at modulating the cytokine response to HIV infection.
Key Words: acute HIV infection, sub-Saharan Africa, cytokines, HIV pathogenesis, Fiebig, antibodies
(J Acquir Immune Defic Syndr 2017;74:459–466)
INTRODUCTION
Acute HIV infection (AHI) is commonly defined as the period between the HIV transmission event and the develop-ment of an antibody response to HIV antigens defined as seroconversion.1Recent infection generally is considered the
phase up to 6 months after infection during which anti–HIV-1 antibodies are detectable. Throughout this article, the term primary HIV infection (PHI) is used to refer to both acute and recent HIV-1 infection.2
AHI is characterized by high HIV viral replication, massive gut-associated lymphoid tissue CD4+T-cell
destruc-tion, immune activadestruc-tion, and establishment of viral reser-voirs.3As a result of high viremia in bodily fluids and high
levels of genital viral shedding, individuals are considered hyperinfectious at this stage.4,5 Current HIV antibody tests
typically become positive within 3–6 weeks of infection and 1–3 weeks after the onset of acute HIV symptoms.6 This
seronegative window is thus of crucial importance for early treatment outcome, vaccine development, and public health.7,8
Received for publication August 11, 2016; accepted November 21, 2016. From the *AIDS Research Institute-IrsiCaixa, Hospital Germans Trias i Pujol,
Badalona, Spain; †ISGlobal, Barcelona Centre for International Health Research (CRESIB), Hospital Clínic, Universitat de Barcelona, Barcelona, Spain;‡Institut Germans Trias i Pujol (IGTP), Hospital Germans Trias i Pujol, Universitat Autonoma de Barcelona, Badalona, Spain; §School of Paediatrics and Child Health, University of Western Australia, Perth, Australia;kCentro de Investigação em Saúde da Manhiça (CISM), Maputo, Mozambique; and ¶Universitat de Vic—Universitat Central de Catalunya, Barcelona, Spain.
The ongoing acute HIV study is supported by Spanish Ministry of Science (Mineco) Grant SAF-2011-27901 and Bill and Melinda Gates Foundation Grant 02398001183. L.P. is supported by Spanish Ministry of Health through the Institute of Health Carlos III (ISCIII), Grant PFIS FI12/ 00096.
Meetings at which parts of the data were presented: 21st International AIDS Conference; July 18–22, 2016; Durban, South Africa.
The authors have no conflicts of interest to disclose.
D.N. and J.B. study design. L.P., E.P., L.F.-S., and D.R. recruited subjects and collected clinical data. L.P., E.P., L.F.-S., L.L., and C.J. performed laboratory analysis at the field. L.P. and J.C. performed biomarker quantification at the laboratory and validation of the data. L.P., E.P., and V.U. performed statistical analyses. L.P., E.P., J.C., J.B., and D.N. interpreted the data. L.P. and E.P. drafted the article. D.N., J.B., and I.M. coordinated the work and supervised manuscript writing. All authors read and approved thefinal version of the manuscript.
Supplemental digital content is available for this article. Direct URL citations appear in the printed text and are provided in the HTML and PDF versions of this article on the journal’s Web site (www.jaids.com). Correspondence to: Lucia Pastor, MSc, Barcelona Centre for International
Health Research (CRESIB), Hospital Clínic, Universitat de Barcelona, Rosselló 132, 08036 Barcelona, Spain (e-mail: [email protected]). Copyright © 2016 The Author(s). Published by Wolters Kluwer Health, Inc.
This is an open-access article distributed under the terms of the Creative Commons Attribution-Non Commercial License 4.0 (CCBY-NC), where it is permissible to download, share, remix, transform, and buildup the work provided it is properly cited. The work cannot be used commercially without permission from the journal.
Despite the importance of AHI, there are immense difficulties identifying AHI patients for treatment initiation. Patients are often asymptomatic or experience a nonspecific febrile illness; a diagnostic dilemma compounded in the African setting by a significant symptom overlap with malaria.3,9To diagnose AHI, the presence of the virus itself
must be detected by nucleic acids or proteins in the absence of HIV-specific antibodies. Fourth-generation HIV assays have demonstrated good sensitivity and specificity for detecting HIV infection and AHI but remain less sensitive than nucleic acid amplification technology.3 Thus, current gold standard
test for confirming viremia is reverse transcriptase– polymerase chain reaction for plasma HIV RNA,10whereas
the most widely accepted assay for confirmation of HIV antibody testing is Western blot (WB) or indirect immuno-fluorescence assay.11
PHI is a rapidly evolving phase characterized by the stepwise gain in positivity for the detection of HIV RNA and HIV-specific antibodies. Different HIV-1 antigen specificities appear in sequence after HIV-1 transmission as do immuno-globulin G (IgG) subclass responses.3 As such, using
different diagnostic tools, PHI has been categorized into “Fiebig stages”12 that are useful in approximating the
infection date with relative accuracy.13
As HIV viremia increases, there is a striking cascade response of acute phase reactants and inflammatory cyto-kines which has been referred to as the “cytokine storm.”3
Although many of the cytokines present are common inflammatory pathway effectors, their study can shed light on key pathogenic pathways occurring before the generation of the humoral response.14–18 We hypothesize that the expression patterns of these early response cytokines may be different between preseroconversion and postseroconver-sion stages of the PHI phase. These effectors could provide clues for vaccine or immunomodulator development aimed at reducing the irreversible immune damage inflicted during AHI.
METHODS
Study Population
The study population was enrolled between 2013 and 2014 at the Manhiça District Hospital (MDH) in the district of Manhiça, Southern Mozambique. The present analysis is a substudy of a prospective cohort of primary HIV-infected adults enrolled and followed up for 12 months in the study Gastrointestinal inflammation biomarkers in acute HIV-infected Mozanbican adults (GAMA cohort). This study was approved by local institutional review boards at Barcelona Clinic Hospital (2011/6264) and by the Ministry
of Health of Mozambique (461/CNBS/12). Written
informed consent was obtained from patients
before participation.
Adults older than 18 years, who were residents of the established District Surveillance System study area, and who presented to the outpatient clinic of the MDH for nonspecific febrile symptoms or voluntary HIV counseling and testing were invited to participate in the study.
HIV Diagnosis
Blood was collected by finger prick for HIV rapid antibody testing with Determine HIV 1/2 (Abbott Laborato-ries, Chicago, IL). Positive results were then confirmed with a more specific Uni-Gold rapid test (Trinity Biotech Co., Wicklow, Ireland) following the national guidelines. Individ-uals with a positive HIV serology in both rapid tests were referred for clinical management and were not eligible for enrollment into the study. PHI was diagnosed in patients with a negative or indeterminate rapid test serology (first test negative or first test positive and second test negative) and positive HIV viremia by reverse transcriptase–polymerase chain reaction testing on frozen plasma using Abbott Real-Time HIV-1 assay according to the manufacturer’s instruc-tions, with a sensitivity of detection of 150 copies/mL. HIV RNA was quantified by applying a multilevel pooling scheme of 10 samples/pool as described and validated in previous works.19A subgroup of HIV-negative time-matched controls
was selected by computer randomization.
Clinical Follow-up
Individuals identified with PHI and the control sub-group of HIV-negative individuals were invited to attend a study visit 1 month after the screening date to start the follow-up in the context of the GAMA cohort. In this article, the 1-month visit sample was only used to establish the reference level for the biomarkers in a nonfebrile non–HIV-infected group and the coinfections and CD4 and CD8 T-cell counts in both study groups. Demographic and clinical data were collected in a specific questionnaire. Medical consulta-tion and HIV counseling were provided. CD4 and CD8 T-cell counts were determined using CD3, CD8, CD4, and CD45 fluorochrome-labeled antibodies on fresh whole blood in a single platform system using Trucount tubes (BD Bio-sciences, Franklin Lakes, NJ). Clinical and microbiological evaluation was performed, testing for the most prevalent infections in the area.
For quantification of immunoglobulins and definition of PHI phases, see Detailed Methodology section in the Supple-mental Digital Content, http://links.lww.com/QAI/A958. HIV-specific antibodies present in plasma screening samples were assessed by WB assay for sg-p120, gp41, p31, p24, and p17 antigens and sgp105 and gp36 antigens for HIV type 2 infection using INNO-LIA HIV I/II Score (Innogenetics N.V., Gent, Belgium). Patients with a negative or indeterminate WB result were considered to be in the preserconversion acute stage, and patients with a positive WB result were considered to be in the postseroconversion recent stage of HIV infection. Thus, in our study cohort seropositive status was defined as positive WB result at screening. Viral load (VL) and WB results at the screening visit were used to categorize individuals into Fiebig stages I–III (VL positive, WB negative), IV (VL positive, WB indeterminate), V (VL positive, WB positive with p31 band negative), and VI (VL positive, WB positive with p31 band positive) according to previous work.12
Seven plasma antibody isotypes (IgA, IgM, IgG1, IgG2, IgG3, IgG4, and total IgG) were quantified in the
screening samples by an in-house enzyme-linked immuno-sorbent assay. HIV-specific antibodies of different subtypes (IgG1, IgG2, IgG3, and IgG4) for HIV antigens (gp41-Envelope, p24-Gag, and p31-integrase) were performed by multiparametricflow cytometry.
For quantification of plasma cytokines, see Detailed Methodology section in the Supplemental Digital Content (http://links.lww.com/QAI/A958), Multiplex cytokine profiling was performed for a total of 54 cytokines in screening plasma samples with particular interest in biomarkers of intestinal damage (10 biomarkers), T, B, and monocyte cells function (23 biomarkers), and general biomarkers of inflammation and cell death (21 biomarkers) (see Table 1, Supplemental Digital Content, http://links.lww.com/QAI/A958). Determinations were performed by enzyme-linked immunosorbent assay or Luminex multianalyte profiling technology.
Statistical Analysis
Group comparisons by Fiebig stage were performed using the nonparametric Kruskal–Wallis test and x2test for
categorical variables. Multiple tests were adjusted using the Bonferroni correction. Post hoc pairwise comparisons between Fiebig stages were performed by Dunn test with Bonferroni adjustment. Comparisons between PHI and non– HIV-infected controls were based on the nonparametric Mann–Whitney U test. Identification of cytokines with the best performance in distinguishing between preser-oconversion and postserpreser-oconversion stages was performed using random forest analysis. Random forest is a supervised learning method based on the ensemble of multiple classi fi-cation trees.20Relation between early and late Fiebig stages
with respect to the selected cytokines were explored by principal component analysis (PCA). Patterns of the selected cytokines by PHI phases were assessed by multivariate
logistic regression. Outcome was a binary variable where 1 represents preseroconversion AHI group (Fiebig I–IV) and 0 represents recent HIV-infected group (Fiebig V–VI). In both PCA and regression model, monokine induced by IFN-g (MIG), monocyte chemotactic protein-1 (MCP-1), and B-cell activating factor (BAFF) values were log transformed for a better adjustment of the data. Clinical variables (age, sex, VL, and other coinfections) were tested for inclusion in the model by backward stepwise elimination approach (inclusion criteria was P-value , 0.05 in multivariate analysis). Statistical analyses were performed using R-3.2.2 and Stata14 software.
RESULTS
Identification of Primary HIV-Infected
Individuals
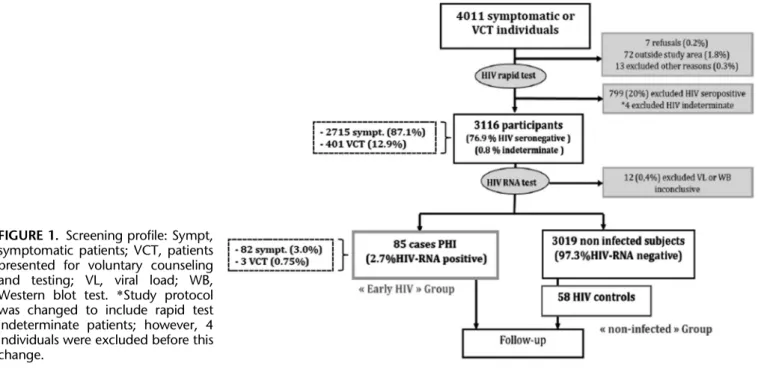
Among the 4011 outpatients screened at the MDH, 3000 (74.8%) presented with fever-like symptoms and 1011 (25.2%) for voluntary HIV testing. Seven hundred ninety-nine (20%) were seropositive on rapid testing, and a further 92 (2.3%) were excluded before serological testing, mainly because of residence outside the study area (Fig. 1). A majority (64.4%) of screened patients were younger than 30 years, and most (62.8%) were female. These age and sex tendencies were similar between seropositive patients and those subjects who met the criteria for inclusion in the study (data not shown).
Of the 3116 rapid test seronegative or indeterminate patients who entered pyramid pooling for HIV-RNA testing, 87.1% were individuals presented for nonspecific febrile symptoms. Ninety-three had a detectable level of HIV RNA, and 4 patients were excluded for presenting an inconclusive HIV-RNA result. Eight of these rapid test seronegative HIV-RNA–positive cases were found to be
FIGURE 1. Screening profile: Sympt, symptomatic patients; VCT, patients presented for voluntary counseling and testing; VL, viral load; WB, Western blot test. *Study protocol was changed to include rapid test indeterminate patients; however, 4 individuals were excluded before this change.
positive for antibodies against all the HIV antigens by sub-sequent WB testing and excluded (Fig. 1). Eighty-five individuals thus fulfilled criteria for PHI; a prevalence of 2.73% (95% confidence interval [CI] 2.18 to 3.36) among all enrolled patients, and 3.02% (95% CI 2.41 to 3.74) among those who were symptomatic at presentation.
Characteristics of the Primary HIV-Infected
Population
At the screening visit, the median age of PHI cases was 24 years (interquartile range [IQR] 20–30), 58% were female, and most (96%) presented with a nonspecific febrile syndrome to the outpatient ward including reported fever,flu, or headache (Table 1). There was no significant difference in age, sex balance, or malaria coinfection between the 85 PHI cases and the 3019 HIV-negative subjects. PHI cases reported a signifi-cantly greater total number of symptoms than the HIV-negative patients and were significantly more likely to report fever in the last 24 hours (P-value = 0.024) and intestinal complaint (diarrhea or abdominal pain) in the last week (P-value , 0.001). Fifty-six PHI cases (70%) returned to commence follow-up and n = 58 HIV-negative participants were randomly selected to attend the 1 month follow-up visit as a reference group. There was no significant difference in age, sex, or HIV RNA between patients with PHI who returned and those who were lost to follow-up (see Table 2, Supplemental Digital Content, http://links.lww.com/QAI/A958). After 1 month of follow-up, median CD4 T-cell count in individuals with PHI was significantly lower than those in the non–HIV-infected group, 585 (IQR 460–682) vs. 955 (IQR 773–1149) cells/mL, respectively (P-value , 0.0001), whereas median CD8 T-cell
count was significantly higher, 1119 (IQR 741–1650) vs. 591 cells/mL (IQR 417–746), respectively (P-value , 0.0001).
Fiebig Staging of Patients With PHI
Most PHI cases (74.1%) were seronegative at pre-sentation (Table 1), with the remainder indeterminate on rapid tests. Patient HIV-RNA levels at presentation were high, with a median of Log10 6.3copies/mL (IQR 5.2–7.3) (Table 1).
Classification according to Fiebig12revealed that most of the
85 PHI cases were in Fiebig I–III, 45 (52.9%), whereas 8 (9.4%), 12 (14.1%), and 20 (23.5%) were in Fiebig IV, V, and VI, respectively. There was no significant difference in age, sex balance, or initial complaint between Fiebig groups (Table 1). The later Fiebig stages did, however, have a higher prevalence of malaria infection (P-value = 0.049) and a higher rate of intestinal complaints in the previous week (P-value = 0.010), when compared with the earlier stages. As expected, the proportion of PHI cases with an indeterminate result for HIV rapid test was significantly higher in Fiebig VI (85%, P-value , 0.001) and the median HIV-RNA level lower (P-value = 0.0001) compared with the earlier Fiebig stages.
Kinetics of Subclass HIV-Specific Humoral
Responses During PHI
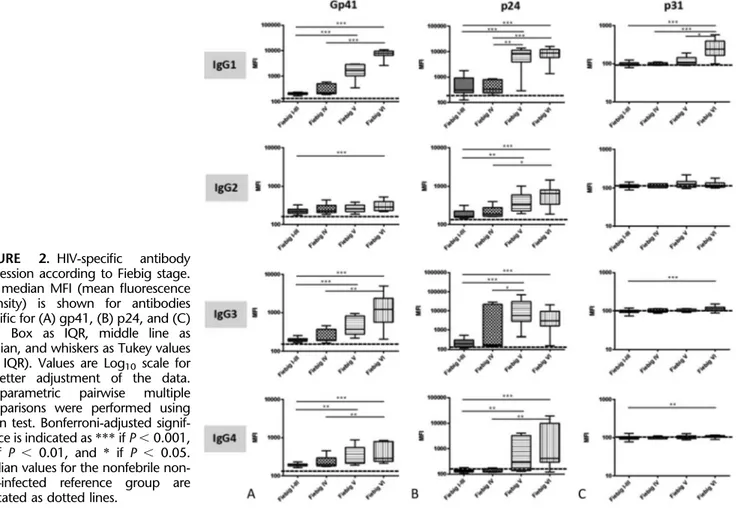
To quantify the nascent HIV-specific IgG response by Fiebig stage in our cohort, we assessed levels of IgG1, IgG2, IgG3, and IgG4 specific for p24, gp41, and p31 antigens. The levels of all antibodies against gp41 and p24 detected for subjects in Fiebig I–III were similar to those in Fiebig IV. HIV-specific antibody levels significantly increased in
TABLE 1. Clinic and Demographic Characteristics of Study Population According to HIV Status and Fiebig Stage HIV Neg at Screening (n = 3019) PHI at Screening (n = 85) P (1) Fiebig I–III (n = 45) Fiebig IV (n = 8) Fiebig V (n = 12) Fiebig VI (n = 20) P (2) Age, yrs, median (IQR) 26 (20–35) 24 (20–30) 0.083* 23 (19–32) 25 (20–35) 23 (19–31) 26 (20–28) 0.8994†
Sex, F (%) 1900 (63) 50 (58) 0.441‡ 28 (62) 3 (37) 8 (67) 11 (55) 0.543‡ Initial complaint, n (%) Headache 80 (3) 1 (1) 0.401‡ 1 (2) 0 (0) 0 (0) 0 (0) 0.395‡ Febrile syndrome 2385 (79) 75 (88) 0.039‡ 41 (91) 8 (100) 11 (92) 15 (75) Flu symptoms 153 (5) 6 (7) 0.412‡ 2 (4) 0 (0) 0 (0) 4 (20) Voluntary testing 395 (13) 3 (4) 0.010‡ 1 (2) 0 (0) 1 (8) 1 (5) Others 6 (0) 0 (0) 1‡ 0 (0) 0 (0) 0 (0) 0 (0) Fever last 24 h, n (%) 2503 (83) 80 (94) 0.024‡ 43 (96) 8 (100) 11 (91) 18 (90) 0.703‡ Malaria, n (%) 337 (17) 7 (11) 0.234‡ 1 (3) 0 (0) 3 (33) 3 (17) 0.049‡
Intestinal complaint last week, n (%) 84 (3) 9 (11) ,0.001‡ 1 (2) 1 (12) 1 (8) 6 (30) 0.010‡ Rapid test Serostatus n (%)
Negative — 63 (74) — 44 (98) 8 (100) 8 (67) 3 (15) ,0.001‡
Indeterminate 22 (26) 1 (2) 0 (0) 4 (33) 17 (85)
VL (RNA Log 10 copies/mL),
Median (IQR) —
6.3 (5.2–7.3) — 7.1 (6.2–7.5) 7.0 (6.3–7.4) 5.6 (4.9–6.3) 4.8 (4.3–5.5) 0.0001†
P-value obtained from (1) comparison by study group or (2) comparison by Fiebig group. *Continuous variables by Mann–Whitney U test.
†For the 2 groups, comparison and global comparison by Kruskal–Wallis test. ‡Comparisons for proportions were performed by x2test.
Fiebig V and Fiebig VI as compared to Fiebig I–III and IV (Fig. 2). As expected from WB results, in the case of antibodies against p31 antigen, only the Fiebig VI group demonstrated significantly higher median level of IgG1 compared with the rest of the Fiebig groups (P-value, 0.05).
Kinetics of Biomarker Expression Patterns
During PHI
From a total of 61 biomarkers assessed, 49 were quantifiable in more than 75% of the samples and were included for analysis (see Table 1, Supplemental Digital Content, http://links.lww.com/QAI/A958). Besides VL, 9 bio-markers were differentially expressed across Fiebig groups including total plasma IgG, IgG1, sCD163, MCP-1, sCD23, BAFF, MIG, TNF-related apoptosis-inducing ligand (TRAIL), and IFNa (P-value, 0.1, Fig. 3). Total plasma IgG and IgG1 were highly correlated (Spearman rho = 0.78, P-value , 0.0001); thus, only total IgG1 was maintained in subsequent analyses, and 8 biomarkers were then considered differentially expressed. Patients in Fiebig I–III showed a significantly different biomarker profile compared with those in Fiebig VI (P-value, 0.01). Levels of total IgG, IgG1, sCD163, sCD23, and MIG significantly increased with Fiebig stages and showed a weak negative correlation with VL (rho, 20.4). In contrast, MCP-1, BAFF, TRAIL, and INFa biomarkers were expressed
at high levels in Fiebig I–III and IV stages and decreased in Fiebig V and VI stages, significantly correlating with VL levels (P, 0.0001, MCP-1 Spearman rho = 0.60, BAFF rho = 0.60, TRAIL rho = 0.48, and INFa rho = 0.47). There was no significant difference in the plasma level of these biomarkers between Fiebig I–III and Fiebig IV or between Fiebig V and Fiebig VI (P-value. 0.05).
Cytokine Expression Profile Can Classify
Primary HIV Infection Into Phases
To determine whether the subgroup of 8 biomarkers was associated with the acute preseroconversion stage of the PHI, cases were grouped into 2 categories: (1) the preser-oconversion acute group roughly covering thefirst month of PHI (Fiebig I–IV) and (2) the postseroconversion group referring to recent PHI (Fiebig V–VI) when HIV-specific antibodies are detectable by WB.
Random forest analysis models consistently selected BAFF, MCP-1, sCD163, and MIG as having the best power to discriminate between the preseroconversion and postseroconversion phases. In addition, a biplot represen-tation generated from PCA showed differential expression patterns for the selected biomarkers according to the grouping (Fig. 4A). Multivariate regression was performed to assess the power of the 4 cytokines to distinguish
FIGURE 2. HIV-specific antibody
expression according to Fiebig stage. The median MFI (mean fluorescence intensity) is shown for antibodies specific for (A) gp41, (B) p24, and (C) p31. Box as IQR, middle line as median, and whiskers as Tukey values (1.5 IQR). Values are Log10 scale for
a better adjustment of the data.
Nonparametric pairwise multiple
comparisons were performed using Dunn test. Bonferroni-adjusted signif-icance is indicated as *** if P , 0.001, ** if P , 0.01, and * if P , 0.05. Median values for the nonfebrile non-HIV–infected reference group are indicated as dotted lines.
between the 2 categories (Fig. 4B). Based on regression diagnostics measures, 5 outlier observations were excluded from model fitting. Clinical variables (age, sex, VL, or other coinfections) showed no significant associ-ation or interaction with the selected biomarkers (data not shown) and were thus eliminated from the model.
BAFF and MCP-1 were positively associated with the preseroconversion group, whereas sCD163 and MIG were negatively associated (Fig. 4B). The multivar-iate model was capable of correctly identifying 49 of the 53 individuals in the preseroconversion phase and 26 of the 32 in the postseroconversion phase. This goodness of fit allowed the model to identify patients in the
preseroconversion phase with a sensitivity of 92.5% and a specificity of 81.2%.
DISCUSSION
This study has identified a signature of 4 cytokines composed of BAFF, MCP-1, sCD163, and MIG that is highly associated with PHI before development of the HIV-specific humoral response as determined by WB.12,13,21 BAFF and
MCP-1 are highly expressed in the first month of PHI, whereas sCD163 and MIG rise several weeks later.
Despite roll out of antiretroviral therapy (ART) and HIV prevention activities, the 3.0% (95% CI: 2.4 to 3.7) FIGURE 3. Expression of selected
parameters varies by Fiebig stage. Nine biomarkers were differentially
expressed across Fiebig groups
including total plasma IgG, IgG1, sCD163, MCP-1, sCD23, BAFF, MIG, TRAIL, and IFNa (P-value , 0.1), as
was VL (P-value , 0.001) by
Kruskall–Wallis range comparison
(Bonferroni adjusted P-value ,
0.01). Median levels of selected pa-rameters are represented as middle line, box as IQR, and whiskers as Tukey values (1.5 IQR). Comparison of individual difference in expression level by Fiebig group was performed by Dunn comparison test adjusted by Bonferroni for multiple compar-isons as shown above. Significance is indicated as *** if P , 0.001, ** if P , 0.01, and * if P , 0.05. Median values for the nonfebrile non–HIV-infected reference group are indi-cated as dotted lines.
FIGURE 4. Cytokines with best discriminatory power to differentiate between early and late Fiebig stages. A, Component analysis of cytokine levels. PCA of BAFF, MCP-1, MIG, and sCD163 levels in patients in preseroconversion or post-seroconversion stages (Fiebig I–IV, Fiebig V–VI, respectively). B, Multivariate logistic regression to
identify cytokines associated with
preser-oconversion stage of HIV infection (Fiebig I–IV). Significance of the variable in the model is indi-cated as ** if P , 0.01 and * if P , 0.05. In both PCA and regression models, MIG, MCP-1, and BAFF values were log transformed for a better adjustment of the data.
prevalence of PHI among people presenting with fever-like symptoms at the outpatient ward of this rural area of Mozambique has remained unchanged as compared with a study performed 5 years earlier which showed an PHI prevalence of 3.3% (95% CI: 1.3 to 6.7).19 Given the high
risk of transmission during this phase, these data represent an important threat to public health. Periodic cross-sectional PHI screening of people presenting with fever-like symptoms in malaria-endemic high HIV-incidence settings could act as an indirect surrogate to monitor evolution of HIV epidemic and compare tendencies between different communities or assess-ing the impact of prevention campaigns.
In our cohort of primary HIV-infected individuals, the nascent HIV-specific antibody response showed a distinct pattern of expression by Fiebig stages. The kinetics of antibody generation during PHI may vary according to individual factors, subtype, and dose of infecting virus.3
Previous studies have shown that anti-Envelope HIV-1 plasma antibodies are predominantly IgG1 subclass, followed by anti-Envelope IgG3 subclass during PHI.22 Results from
our cohort are largely similar. However, very few individuals in the earliest Fiebig stages (I–IV) showed positive IgG3 responses to gp41. These results slightly differ from Yates et al22,23where they found anti-gp41 IgG3 to be positive for
all individuals with PHI. The timing of detection of antibodies could be influenced by the extent of immune complex formation preceding detection of free antibody. This could differ by VL, geographic location, or HIV clade. In contrast to our Mozambican clade C cohort, their PHI cohort included 37% African individuals infected with HIV clade C, which could explain discrepancies.
In parallel to the stepwise HIV-specific antibody generation, AHI is a period when many other immune processes are occurring, specifically the innate immune response. A general cytokine storm occurring early after HIV infection has described peak levels of many in flamma-tory cytokines before seroconversion.14,16–18,24Tofine-tune the immune response pattern, we have assessed those previously described cytokines as well as other relevant innate immunity effector molecules. From a total of 49 analytes that were quantifiable in this cohort, 9 biomarkers demonstrated significant difference in the expression level across Fiebig groupings. Furthermore, 4 of these bio-markers, BAFF, MCP-1, sCD163, and MIG, exhibited the best predictive power to distinguish between individuals in preseroconversion and postseroconversion stages of PHI. The expression profile of these 4 cytokines identified with high sensitivity and specificity those individuals in which the antibody generation was still not developed.
Most of the participants (87.1%) were screened for PHI through sampling of individuals presenting with febrile syndrome. Although this is the most practical way offinding PHI, the cytokine and antibody expression profile in symp-tomatic individuals may not be generalizable to asympsymp-tomatic individuals. Although hepatitis B, syphilis, and intestinal pathogen coinfections were not found to be associated with stages of HIV infection or levels of cytokines, we cannot exclude that other infections commonly present in HIV-infected individual could affect plasma levels of these
biomarkers. Another limitation is the lack of resolution of early Fiebig stages due to sample volume restrictions. We cannot exclude that cytokine expression may differ between Fiebig I–III. A detectable gradient of cytokine expression could become visible particularly in the transition through Fiebig III, similar to Fiebig IV. However, this would likely maintain or even strengthen the signature association.
To our knowledge, no cytokine signature has been previously described to be associated with the version phase of PHI. In our cohort, increased preserocon-version expression of MCP-1 was accompanied by elevated BAFF. In contrast, sCD163 and MIG showed a delayed increase during the early infection process which paralleled the decrease in BAFF and MCP-1. MCP-1 and BAFF are both produced by monocytes, macrophages, and dendritic cells after infection or tissue inflammation to assure a proper immune response and maintenance of normal immunity.25–27 In contrast, macrophage low-grade inflammation marker (sCD163) and MIG are cytokines involved in T-cell traffick-ing to inflammatory sites and control of T-cell prolifera-tion.28–30Because BAFF and MCP-1 expression is associated with early innate responses, they may be the very first effectors in the HIV immune cascade followed closely by sCD163 and MIG, associated with the initiation of adaptive immune responses. Further studies including gut biopsies in humans or nonhuman primates may show whether BAFF and MCP-1 expression are associated with viral shedding or early HIV-induced gut-associated lymphoid tissue destruction.
There is an interest in approaching AHI as a phase of infection in which early ART coupled with adjunct targeted immune therapy could limit the destruction of the mucosal lymphoid tissue and seeding of the HIV reservoir. Ap-proaches include boosting HIV-specific immunity, reducing inflammation, activating latency, and targeting HIV apopto-sis regulatory pathways.7,31–33Recent studies also point out that ART initiated during early AHI either prevents loss of (at Fiebig stage I/II) or restores (at Fiebig stage III) mucosal Th17 cells.34 Consequently, very early ART is associated
with normalization of local and systemic immune activation, reversing a hallmark of HIV pathogenesis.34 Although
further analysis will be required to define whether there is a causal relationship between BAFF and MCP-1 expression and antibody generation, these cytokines might be potential targets to boost the humoral response in vaccination strategies or to accelerate the HIV-specific antibody response during PHI. Modulation of these cytokines might promote an earlier development of autologous neutralizing antibodies that may contribute to faster and long-lasting control of HIV.35,36
ACKNOWLEDGMENTS
The authors are grateful for the continued support of the clinical staff at the Manhiça District Hospital, as well as the study staff working exhaustively at thefield and labora-tory at the Centro de Investigaçao de Saúde de Manhiça (CISM). The authors thank Diana Barrios and Marisa Rodriguez for their contribution to biomarker quantification
together with Aina Casellas for her statistical support. The authors are particularly grateful to Laura Puyol, Mireia Piqueras, and Helder Bulo for their contribution to study and laboratory coordination between partner institutions.
REFERENCES
1. Douek DC, Roederer M, Koup RA. Emerging concepts in the immunopathogenesis of AIDS. Annu Rev Med. 2009;60:471–484. 2. Cohen MS, Gay CL, Busch MP, Hecht FM. The detection of acute HIV
infection. J Infect Dis. 2010;202(suppl 2):S270–S277.
3. McMichael AJ, Borrow P, Tomaras GD, Goonetilleke N, Haynes BF. The immune response during acute HIV-1 infection: clues for vaccine development. Nat Rev Immunol. 2010;10:11–23.
4. Wawer MJ, Gray RH, Sewankambo NK, et al. Rates of HIV-l transmission per coital act, by stage of HIV-l infection, in Rakai, Uganda. J Infect Dis. 2005;191:1403–1409.
5. Pilcher CD, Tien HC, Eron JJ, et al. Brief but efficient: acute HIV infection and the sexual transmission of HIV. J Infect Dis. 2004;189: 1785–1792.
6. Lindbäck S, Thorstensson R, Karlsson AC, et al. Diagnosis of primary HIV-1 infection and duration of follow-up after HIV exposure. Karolinska Institute Primary HIV Infection Study Group. AIDS. 2000; 14:2333–2339.
7. Laanani M, Ghosn J, Essat A, et al. Impact of the timing of initiation of antiretroviral therapy during primary HIV-1 infection on the decay of cell-associated HIV-DNA. Clin Infect Dis. 2015;60:1715–1721. 8. Gay C, Dibben O, Anderson JA, et al. Cross-sectional detection of acute
HIV infection: timing of transmission, inflammation and antiretroviral therapy. PLoS One. 2011;6:e19617.
9. Bebell LM, Pilcher CD, Dorsey G, et al. Acute HIV-1 infection is highly prevalent in Ugandan adults with suspected malaria. AIDS. 2010;24: 1945–1952.
10. Branson BM. The future of HIV testing. J Acquir Immune Defic Syndr. 2010;55(suppl 2):S102–S105.
11. Shanks L, Siddiqui MR, Abebe A, et al. Dilution testing using rapid diagnostic tests in a HIV diagnostic algorithm: a novel alternative for confirmation testing in resource limited settings. Virol J. 2015;12:75. 12. Fiebig EW, Wright DJ, Rawal BD, et al. Dynamics of HIV viremia and
antibody seroconversion in plasma donors: implications for diagnosis and staging of primary HIV infection. AIDS. 2003;17:1871–1879. 13. Lee HY, Giorgi EE, Keele BF, et al. Modeling sequence evolution in
acute HIV-1 infection. J Theor Biol. 2009;261:341–360.
14. Liovat AS, Rey-Cuillé MA, Lécuroux C, et al. Acute plasma biomarkers of T cell activation set-point levels and of disease progression in HIV-1 infection. PLoS One. 2012;7:e46143.
15. Kramer HB, Lavender KJ, Qin L, et al. Elevation of intact and proteolytic fragments of acute phase proteins constitutes the earliest systemic antiviral response in HIV-1 infection. PLoS Pathog. 2010;6:e1000893. 16. Roberts L, Passmore JA, Williamson C, et al. Plasma cytokine levels
during acute HIV-1 infection predict HIV disease progression. AIDS. 2010;24:819–831.
17. Borrow P, Shattock RJ, Vyakarnam A; EUROPRISE Working Group. Innate immunity against HIV: a priority target for HIV prevention research. Retrovirology. 2010;7:84.
18. Katsikis PD, Mueller YM, Villinger F. The cytokine network of acute HIV infection: a promising target for vaccines and therapy to reduce viral set-point? PLoS Pathog. 2011;7:e1002055. Manchester M, ed. 19. Serna-Bolea C, Muñoz J, Almeida JM, et al. High prevalence of
symptomatic acute HIV infection in an outpatient ward in southern Mozambique: identification and follow-up. AIDS. 2010;24:603–608. 20. Breiman L. Random forests. Mach Learn. 2001;45:5–32.
21. Keele BF, Giorgi EE, Salazar-Gonzalez JF, et al. Identification and characterization of transmitted and early founder virus envelopes in primary HIV-1 infection. Proc Natl Acad Sci U S A. 2008;105:7552–7557. 22. Yates NL, Lucas JT, Nolen TL, et al. Multiple HIV-1-specific IgG3 responses decline during acute HIV-1: implications for detection of incident HIV infection. AIDS. 2011;25:2089–2097.
23. Yates NL, Stacey AR, Nolen TL, et al. HIV-1 gp41 envelope IgA is frequently elicited after transmission but has an initial short response half-life. Mucosal Immunol. 2013;6:692–703.
24. Stacey AR, Norris PJ, Qin L, et al. Induction of a striking systemic cytokine cascade prior to peak viremia in acute human immunode-ficiency virus type 1 infection, in contrast to more modest and delayed responses in acute hepatitis B and C Virus infections. J Virol. 2009;83:3719–3733.
25. Deshmane SL, Kremlev S, Amini S, Sawaya BE. Monocyte chemo-attractant protein-1 (MCP-1): an overview. J Interferon Cytokine Res. 2009;29:313–326.
26. Schneider P, MacKay F, Steiner V, et al. BAFF, a novel ligand of the tumor necrosis factor family, stimulates B cell growth. J Exp Med. 1999; 189:1747–1756.
27. Lied GA, Berstad A. Functional and clinical aspects of the B-cell-activating factor (BAFF): a narrative review. Scand J Immunol. 2011;73: 1–7.
28. Lee HH, Farber JM. Localization of the gene for the human MIG cytokine on chromosome 4q21 adjacent to INP10 reveals a chemokine “mini-cluster”. Cytogenet Cell Genet. 1996;74:255–258.
29. Onofre G, Kolácková M, Jankovicová K, Krejsek J. Scavenger receptor CD163 and its biological functions. Acta Medica (Hradec Kralove). 2009;52:57–61.
30. Burdo TH, Lentz MR, Autissier P, et al. Soluble CD163 made by monocyte/macrophages is a novel marker of HIV activity in early and chronic infection prior to and after anti-retroviral therapy. J Infect Dis. 2011;204:154–163.
31. Passaes CP, Sáez-Cirión A. HIV cure research: advances and prospects. Virology. 2014;454-455:340–352.
32. Gaur R, Timilsina U. Modulation of apoptosis and viral latency—an axis to be well understood for successful cure of human immunodeficiency virus. J Gen Virol. 2016;97:813–824.
33. Massanella M, Martinez-Picado J, Blanco J. Attacking the HIV reservoir from the immune and viral perspective. Curr HIV/AIDS Rep. 2013;10: 33–41.
34. Schuetz A, Deleage C, Sereti I, et al. Initiation of ART during early acute HIV infection preserves mucosal Th17 function and reverses HIV-related immune activation. PLoS Pathog. 2014;10:e1004543.
35. Tomaras GD, Haynes BF. HIV-1-specific antibody responses during acute and chronic HIV-1 infection. Curr Opin HIV AIDS. 2009;4: 373–379.
36. Pelegrin M, Naranjo-Gomez M, Piechaczyk M. Antiviral monoclonal antibodies: can they be more than simple neutralizing agents? Trends Microbiol. 2015;23:653–665.