Nuclear Instruments and Methods m Physics Research A 336 (1993) 521-532
North-Holland
Study ofa possible scintillating fibre tracker at the LHC
and tests ofscintillating fibres
NUCLEAR INSTRUMENTS & METHODS IN PHYSICS RESEARCH Section A
D. Autiero, P. Camarri, A. Cardini, V. Cavasinni, T. Del Prete, B. Di Girolamo, V. Flaminio and E. Iacopini
Dipartimento di Fisica, Università di Pisa and Istituto Nazionale di Fcsica Nucleare, Sezione di Pisa, Italy
A. Gorin and I. Manuilov
IHEP, Protvmo, Russian Federation
Received 2 April 1993 and in revised form 2 July 1993
We present a possible scheme for a scintillating fibre tracker that could be used at the LHC in the central pseudorapidity region. The experimental environment at the LHC was simulated in detail by a Monte Carlo program using the GEANT package. We shall discuss the expected performance ofthe proposed tracker, mainly for electron identification. We also report on the results of laboratory measurements of scintillating fibre characteristics: we measured the time response, the light yield, the attenuation length and the light propagation speed in individual fibres, looking for the best candidates for the LHC. 1. Introduction
The experiments which will be performed at future high energy and high luminosity hadronic colliders (LHC, SSC) will face severe experimental problems: the most remarkable ones are a high proton-proton collision rate and a high radiation level [ 11 . In partic-ular a tracking detector operating in the central region
(1r11 < 2) should be:
- radiation resistant (-1 Mrad);
- accurate: for momentum and charge measure-ment up to - 1 TeV;
- granular enough to limit fake track reconstruc-tion;
- fast: it should provide signals every bunch-crossing (15 ns) ;
- transparent to electromagnetic radiation, i.e. to-tal thickness < 0.1 r.l.
We studied a central tracker made of scintillating fibers; its main aim is to contribute to identify (at the first level trigger) events with high pr leptons origi-nating in a pp collision - as well as to measure the lep-ton momentum - out of the - 109 events per second occurring at the LHC (pp collisions at 16 TeV) at the highest luminosity (1034CM -2 S - I ) .
0168-9002/93/$ 06.00 © 1993 - Elsevier Science Publishers B.V. All rights reserved
2. Monte Carlo simulation of the scintillating fibre tracker
We propose a scintillating fibre (SciFi, diameter - 0.5 mm) tracking device aiming to fulfil the above mentioned requirements, i.e.:
- high radiation hardness; - very fast time response; - good space resolution; - good transparency.
The tracker performances at the LHC were studied by a detailed Monte Carlo program providing a full simulation using the GEANT package [2 ] . The geom-etry of the SciFi tracker is the following (see fig. 1) :
- The fibres (each one with a diameterof 0.5 mm) positioned along the beam axis (to provide r,0
co-ordinates) are grouped into cylindrical "superlayers": a superlayer is made of two series of four fibre lay-ers each, with a spacing of 4.6 cm (the overall thick-ness of a superlayer is, therefore, 5 cm) ; a staggering of 125 urn (1/4 of the fibre diameter) between con-tiguous layers gives a space resolution rA0 ~ 40um at full efficiency (fig. 1). The simulation includes also a beryllium pipe and suitable carbon fibre supports for fibres.
- A first SciFi superlayer is positioned 0.5 m and another one 1 m from the beam axis, with acceptance Jill < 1 .9 (fig. 2) ; besides, the fibre layers are inter-rupted att] = 0 to separate left/right signals.
The detector includes a total of281 600 fibres and the total thickness at
n
= 0 is - 5% r.l. The lightsig-522 D. Autiero et al / A possible A-d
Fig. 1. Transverse section of a superlayer of the proposed scintillating fibre detector; possible hits for lowpTand high
pr charged particles are represented.
nal is brought far from the central region of the de-tector, so that the readout electronics are not affected by the high radiation dose; for this reason, in the
pro-Superlayere
intersection point
scintillating fibre tracker
posed scheme, each scintillating fibre is prolonged by using an 8 m long clear light guide. The price to pay is a low average number of photons arriving at the far end of the clear fibre; thus, the readout must be performed through high efficiency photon detectors. We assume to use the VLPCs (Visible Light Photon Counters, produced by Rockwell), which have quan-tum efficiency ti 85 % in the visible region of the elec-tromagnetic spectrum [3 ] .
The simulation includes trapping efficiency, at-tenuation effects (2.5 m in the scintillating fibres, 12 m in the clear fibres) and efficiency factors of clear/scintillating fibre junctions and VLPC.
The Monte Carlo calculation was performed with three kinds ofevents (generated in pp collisions at 16 TeV) :
- isolated electrons with energy > 20 GeV; - QCD jets (E, > 20 GeV) which fake
electro-magnetic clusters in the calorimeter; at the calorime-ter level the electromagnetic cluscalorime-ter was selected by:
a) Inl < 2;
b)Ee , (Ail x AO 0.06 x 0.06) > 20 GeV, c) Eleak (Arl x AO - 0.06 x 0.06) < 5 GeV,
d) E,,., (Orlx0O-0 .1x0.1)< 10 GeV, providing already a rejection factor - 240 against QCD jets;
- minimum bias events.
Fig. 2. Longitudinal section of the proposed detector; in this scheme only 1/4 of the whole section is
Beam axle
523
0
wa ~sa
uori~ ooma .m vwi. o.omo[ .ro
40 o6M~ wo~
n ros
uuu umooc.m
10 20
Cluster multiplicity for SO Cluster multiplicity for SI-2
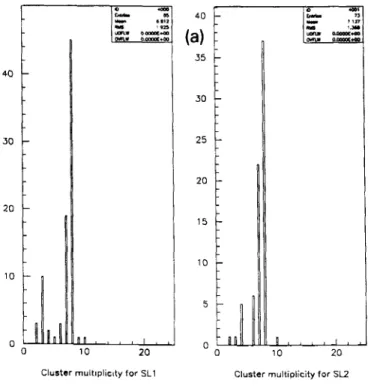
Fig. 3. (a) Distribution of cluster multiplicities in superlayers 1 and 2 for electron tracks at low luminosity. (b) Distribution of cluster multiplicities in superlayers 1 and 2 for QCD jet tracks at low luminosity.
40 30 30 25 20 20 15 10 10 ID fln C Roll 111111 9 1 10 20 0 10 20
Cluster multiplicity for SLl Cluster multiplicity for SL2
90 0aar n t mox.m (b) uw a 90 rosmv aaomc.oosr 80 ww wo 80 70 70 60 0 50 50 40 30 30 20 20 10 10
524
An "electron" is a charged track with recon-structed momentum matching the calorimeter energy and pointing to the electromagnetic cluster of the calorimeter within an angular fiducial region.
In order to simulate the high LHC luminosity, we superimpose minimum bias events on both electron and QCDjet events: at C = 1033 cm-2 s-1 the average rate is 1 minimum bias event per bunch crossing (rate 108 s-1 ) ; atL = 1034 cm-2 s- I the corresponding rate is 10 minimum bias events per bunch crossing
(rate - 109 s-1 ) .
By applying a solenoidal magnetic field, it is pos-sible to reconstruct the transverse momentum of the charged tracks; in a 2 T magnetic field, the transverse momentum p-r and the bending radius p of a track are linked through the following dependence:
pT(GeV/c) = 0.6p(m) .
ThePTresolution resulting from the proposed detector
geometry and the applied magnetic field is: 8Pr O.SpT (TeV/c) .
PT
The number of charged particles coming from a min-imum bias event at the LHC (per unit pseudorapid-ity) is [4]:
dn ch-6 . dn
Then, we estimate that about 230 charged particles per bunch-crossing will emerge from the interaction region atL = 1034 cm-2 s-' .
In our simulation of the LHC running conditions we neither did include the effect of back-splash par-ticles from the material surrounding the cavity of the central detector nor the signals produced by neutrons originated by the outer calorimeters. These effects de-pend on the configuration of the outer detectors and they could increase the noise in the fibre tracker. In the ATLAS experiment at the LHC [5 ] the amount of back-splash from the cryostat of the magnet coil sur-rounding the central region was estimated not to ex-ceed 10% of the total number of the minimum bias particles. In this experiment the neutron albedo was also calculated: at the maximum LHC luminosity the neutron fluence per year is 10'3 n/cm2 resulting in about 200 neutrons crossing a layer ofthe fibre tracker every 15 ns. We estimate an additional number of about 20 hits in a layer of fibres and this is still negligi-ble compared to the hits due to the primary particles. In our detector a stiff track (PT > 10 GeV/c) is
recognized because its hits in a superlayer (8 at full ef-ficiency) are lined up within one fibre diameter. Due to the high particle flux, random correlation of hits coming from minimum bias tracks could also mimic a
D. Autiero et al. / A possible scintillating fibre tracker
largePTelectron : we calculated this contamination to
be < 1 %, provided we know the
0
cone of the electron (f2.5°) defined by the calorimeter cluster position.In the Monte Carlo, high pr tracks are selected us-ing the followus-ing algorithm:
- "hits" are searched for within f2.5° around the electron or jet direction (set by the calorimeter spa-tial resolution): the average number ofphotoelectrons measured for each fibre is about 10;
- for each superlayer, >7 fibres lined up with the
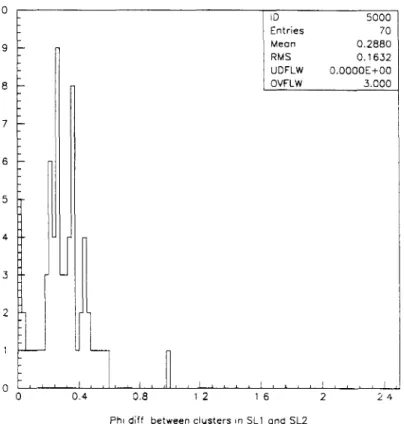
Fig. 4. AO distribution for electron tracks at low luminosity.
2 8
--2
I I 1-_e- .i, e s r S, I ard SL2
~ooo F~1-es Fo M .- 0351-KNS 0 31 .,JFi ~a 0 OCOCF+Oo wF_w lzoo I 1 -_ 2 6 z ..2
F- d, " oel-e^ d scers ^SL' anc SL2
10 20 ID 4pW Entoea 74E Mean 391i RMS 1204 ODFLW O -L . 00000-t00 1
Cluster multiplicity for ELI Cluster multiplicity for SL2 280 (b) 0 20 ID 4001 Entrwe 541 RMS ,.900 ODFLW 0 D000E .00 WFLW OOOOOEi00 aR ] I 10 20 0 10 20
Cluster multiplicity for SL1 Cluster multiplicity for SL2
Fig. 6. (a) Distribution of cluster multiplicities in superlayers 1 and 2 for electron tracks at high luminosity. (b) Distribution of cluster multiplicities in superlayers 1 and 2 for QCD jet tracks at high luminosity.
240 240 200 200 160 160 120 120 80 80 40 40 240 0 aow ID 400t EntRe4 782 200 Eatrlea 428 RMS -121911 MwaRM9 111 .2 .4
UDFLW OOOWErW UDFLW 0 OOp0-0
OVFLW OOOWE+W (a) O'JFLW 0~0E400
175 200 150 160 125 120 100 75 80 50 4C 25
526
10
interaction vertex within one fibre diameter (pT > 10 GeV) are selected ; average angular coordinates Q01) in the inner superlayer, (02) in the outer one) are as-signed to these "clusters";
finally, we study the histogram of the quantity
D. Autiero et al. / A possible scintillating fibre tracker
000 70 0 541 ; PNS 658 ~F,w coo00L100 CVF_w -4~ on-Pt 6-f be " ween c-,,-itSU anc SL2
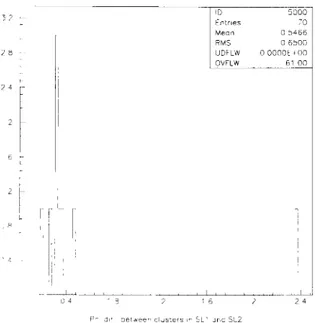
Fig. 8. AO distribution for QCDjet tracks at high luminosity.
0.4 0.8
Phi diff between clusters in SL1 and SL2
Fig. 7. AO distribution for electron tracks at high luminosity.
I (Y'1) -(02)I :ifthere is more than one possible
corre-lation between clusters in the two superlayers, we con-sider the pair of clusters for which JA01 is minimum.
This procedure was used first to analyse electron events and QCD jet events, with one minimum bias event overlapped (low luminosity) . For the electrons (fig. 3a), we see that the fibre multiplicity of most tracks in each superlayer equals 8 (it corresponds to a track crossing one fibre in each layer) ; from the ~A01
distribution (fig. 4), a clear correlation signal is visi-ble: setting a cut atAO - 0.8° we get an electron effi-ciency of 95%.
For the QCD jets (fig. 3b), however, the average multiplicity of the clusters in each superlayer is only 4 (ajet contains many low energy particles, and their paths do not cross all the layers in a superlayer within one fibre diameter). A similarAOcut in jet events re-tains - 5%, thus the tracker alone provides a rejection factor against jets ofr 20 (fig. 5).
We proceed in an analogous way to analyse events at high luminosity (- 1034Cm -2s-1 ) ; now the situa-tion is complicated by the 10 minimum bias events superimposed to a high pr electron or QCD jet. As shown in fig. 6a (electron events), most clusters (orig-inating from low pr particles) have low multiplicity and are filtered out by the selection criteria, and again, the electron efficiency atAO< 0.8° is ti 95% (fig. 7) . A more difficult situation arises in the reconstruction
I D 5000 Entries 70 Mean 0.2880 RMS 0.1632 UDFLW 0.0000E+00 OVFLW 3.000
FIAT I
t f- I gg. e r c o 11111 E r
-Fig. 9. Longitudinal view of the set-up used in the RIFOS experiment for the measurements of scintillating fibres.
-12 mm
0
1s
I- 2s
Be Ir,t I I I st I r , çl 1 I LG,
Fig. 10. Scheme of the transverse section of the trigger sys-tem used in the RIFOS experiment.
60 240 280
qVt channel Kuraray SCSF.i8 (0 5 mm)
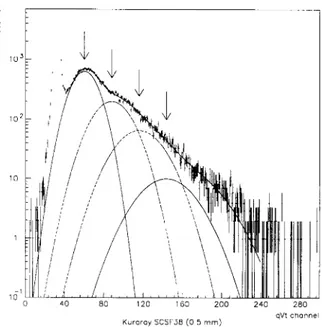
Fig. 11 . Example ofan experimentalq Vtcharge distribution recorded in the RIFOS experiment; the contributions of 1,
2, 3 and 4 photoelectrons are shown.
D. Autiero et al. / A possible scintillatingfibre tracker d 200 SOURi_E (N) - 0 94 PMT r e,.d,str I
,t-Fig. 12. Poisson distribution fitting the values of the photo electron peak amplitudes obtained from fig. 11; in this case
we get 0.94 for the average number of photoelectrons. of tracks in the jets: the superlayer clusters (fig. 6b) still have low multiplicity, on average, but the proba-bility ofrandom clustering rises due to the large num-ber ofclusters and statistical fluctuations: now we find 25% ofjet events with X001 < 0.8o, and the resulting hadron rejection factor is poorer (- 4, see fig. 8) .
To use the information of highPT electron tracks
for event selection at the first level trigger requires an electron/jet rejection factor of - 10-102 provided by the tracker alone [6]. Therefore the proposed scheme is adequate at low luminosity; at high luminosity we estimate that a third superlayer added to the proposed detector will provide the required rejection factor.
We recall the parameters used in our simulation: - fibre attenuation length (at great distance) _ 2.5 m; 12 m for clear fibres;
- clear fibre/scintillating fibre junction efficiency: 95%;
- photomultiplier quantum efficiency: 85%; - time interval between two readouts of the same fibre: 15 ns (interval between two bunch-crossings at the LHC) .
528
_2 10
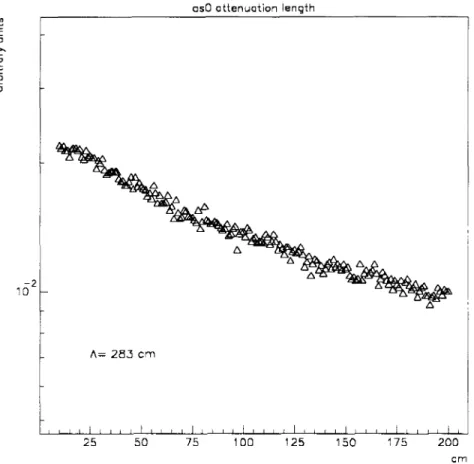
A= 283 cm
3. Measurements of scintillating fibres I I
I I I I I
25 50 75
Fig. 13. Example of an experimental attenuation plot of the RIFOS experiment, in this case we get an attenuation length of 283 cm.
fibre (extrapolated to zero distance) no = 15. These values have to be kept in mind as a reference for the laboratory tests of scintillating fibres .
The RIFOS experiment, performed at the INFN laboratories in Pisa, aims to assess the performance of various kinds of scintillating fibres . The scintillation process is stimulated by a collimated beam of elec-trons coming from the 6 - decay of a 3.7 MBq 90Sr source.
Here are the features of the experimental set-up (fig. 9) :
- a 3 m long fibre is stretched horizontally, 10 cm above the plane of an optical bench;
- the source is fixed to a small carriage which can be moved all along the fibre on a railway by a stepping motor: a CAMAC module controls the motor move-ment, and a single step corresponds to a carriage dis-placement of 0.47 mm;
- the fibre ends are in contact with the input win-dows of two Hamamatsu R1635-02 photon
count-D. Autiero et al. / A Possible scintillating fibre tracker cs0 attenuation length
I I I I A. I I ,. , ,II
100 125 150 175 200
cm
ing photomultipliers, reading the scintillation pulses; the photocathode is bialkah, with quantum efficiency 25% for visible light with .l = 420-430 nm, and - 10% for ~ = 530 nm;
- a trigger system is also fixed to the carriage (fig. 10) : a collimating slit and two small segments of a scintillating fibre are placed beneath the test fibre; each segment is in contact with a photomultiplier;
- the whole set-up is mounted inside a room which is totally darkened during the measurements .
The following scintillating fibres were measured: - Pol. Hi. Tech. *1 fibres 0 mm and 0.5 mm thick) emitting scintillation light at 420, 430, 460, 530, 590, 600 and 650 nm (referred to as al for 1 mm and as for 0.5 mm diameter) .
- Kuraray12 fibres (0.8 inm thick) emitting scin-tillation light at 530 nm (referred to as K3HF) .
x2
Pol. Hi. Tech. s.r.l., S.P. Turanense km 44.400, 67061 Carsoli (AQ), Italy.
Kuraray Co., Ltd., Methacrylic Resin Division, Shuwa Higashi-Yaesu Building 9-1, Hatchobory 2-Chome, Chuo-ku, Tokyo 104, Japan.
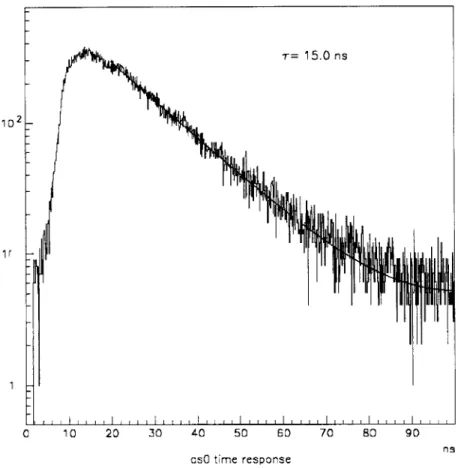
as0 time response
Fig. 14. Example of a time response measurement performed in the RIFOS experiment . 20 17.5 15 12.5 0 10 20 30 40 50 6D 70 80 90 10 7.5 5 2.5 D ns 0 0.2 0.4 0.6 0.8 1 1 .2 1 .4 1 .6 1 .8 2 m as0 light propagation speed
530
On each fibre, the following measurements have been performed :
- average number of produced photoelectrons ; - attenuation length;
- time response;
- light propagation speed in the fibre. 3.1. Attenuation length and average number of photoelectrons
The attenuation length is computed by measuring the average number of photoelectrons produced by the photocathode of a photomultiplier placed at one end of the fibre, as a function of the source distance from the photocathode. If the source is far enough (> 0.5 m) from the photocathode, the following formula may be used:
Npe = No exp (-X/Aatt) ,
where Aatt is, by definition, the fibre attenuation length; No is the number of photoelectrons extrapo-lated to zero distance. We extract the average num-ber of photons produced by the fibre by dividing No by the photocathode quantum efficiency for that scintillation light wavelength .
For this measurement, a q Vt module, used in q mode and gated by the trigger system, receives the signal from the photomultiplier . Fig. 11 shows an ex-ample of a q Vt charge spectrum collected at a given position of the source along the fibre: the experimen-tal distribution receives contributions from the noise (pedestal) and from the signals originated by 1, 2, .. . photoelectrons, smeared out by the statistical fluctua-tions in the multiplication process (we assume Gaus-sian distributions). Thus the qVt histogram was fit-ted by the following expression:
2 f (X) = ty ped exp [-(X _ 2azped) ] ,/f27TUped ped M
M is the number of Gaussian photoelectron peaks contributing to the measured spectrum ; Xped and Uped are the pedestal position and width respectively, z, andU,are the parameters ofthe ith photoelectron con-tribution. We assume z,+ , - X, =constant andU, = fU t ;Xped, Uped, X,,U twere determined in special runs with low light yield; w,, weed are the peak areas, to be determined through the fitting procedure. The peak areas w, reasonably match a Poisson distribution with mean value u:
e-uh~ w,(i;p) = K i ., ,
where K is a normalization factor ; a is the average
D. Autiero et al. / A possible scintillating fibre tracker
number ofphotoelectrons produced by the photocath-ode and it is obtained by a fit of the experimental pa-rameters w, with the Poisson distribution (see fig. 12 as an example of this computation) . We also tried a more complicated parameterization of the spectrum, allowing for Landau tails too: the differences in the results are not larger than 10%; therefore we estimate the final uncertainty on the determination of 1t to be f 10%. As a matter of fact we performed this proce-dure only at a few points of the attenuation curve to obtain absolute normalization : the attenuation curve was obtained simply by measuring the anode current as a function ofthe source position. An example ofan attenuation plot is shown in fig. 13 .
3.2. Time response
The time characteristic of a fibre is evaluated by using a LeCroy qVt module in t mode: the time behaviour of the scintillation pulse produced as the source is placed 5 cm away from the fibre end is measured . The start is given by the trigger system, and the stop by the first photon arriving at the photo-multiplier. A high photon rate can lead to misleading results . For this reason, it is necessary to use filters in order to decrease the light yield seen by the photo-multiplier to the level of a single photon per trigger, especially for blue scintillation light (420-430 nm) . As foreseen by the theory [8], the scintillation pulse rises quite fast (it reaches its maximum value in about 1-2 ns), it then decreases exponentially owing to the fluorescence decay time of the dye contained in the fibre; more precisely, the observed behaviour can be parameterized by the sum of several expo-nential functions, depending on the nature of dyes in the fibre. We estimate the electronic time resolution contributing to the time measurement to be < 0.6 ns. An example of this measurement is shown in fig. 14. 3.3. Light propagation speed
The light propagation speed in each fiber is com-puted by moving the source along the fibre and per-forming 25 measurements of arrival time at each po-sition . Moreover, we can measure the time spread of the arriving signals at each position: this time reso-lution is dominated by the fibre time response, and, together with the light propagation speed, it sets an ultimate limit to the "promptness" of the signals ob-tained by the fibre system. An example of these mea-surements is shown in fig. 15.
3.4. Photomultiplier quantum efficiency
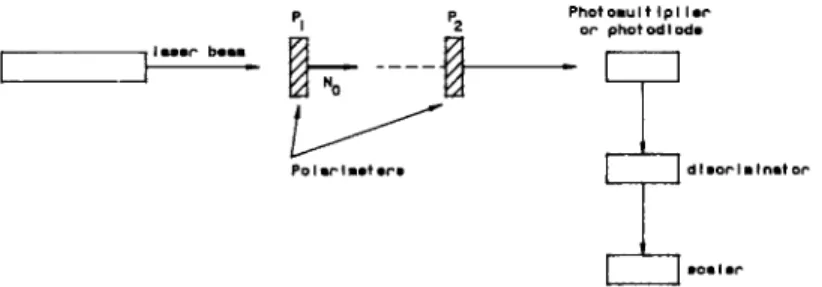
The quantum efficiency of the photomultipliers used in our tests was measured as follows (fig. 16) . A
Fig. 16. Schematic representation of the experimental set-up used for measuring the quantum efficiency ofthe photomultiplier used in the RIFOS experiment.
laser beam crosses two polarimeters, before imping-ing onto either a photodiode or a photomultiplier; the axis of the first polarimeter was fixed, while the axis of the second one is rotated in order to increase or decrease the photon flux reaching the photon de-tector. IfNo isthe photon rate coming out ofthe first polarimeter, the number of photons per unit time reaching the photodiode is No (cost0 + k),where
0
is the angle between the two polarimeter axes, andk
is a constant to be determined; we chose
0
= n/4 so that the photon beam reaching the photodiode was intense enough for a reliable measurement of the cur-rent in the photodiode. Ifep isthe photodiode quan-tum efficiency (60% ± 5%), we get the photodiode current:Table 1
Experimental values for the main parameters of the scintillating fibres used for the RIFOS experiment
1- bw.
I=eeN
p o(2
1 + k) .Ifk is negligible (and in fact it is - 10-7 ) we can
extract the photon flux No.
Afterwards, the photodiode was replaced by a pho-tomultiplier; the second polarimeter axis was rotated so that the final photon flux reached a minimum around
0
= n/2, and the resulting photoelectron rateN (epm is the photomultiplier quantum efficiency)
was measured around the minimum value as a func-tion of
0:
N(0) = epmNo(COSZ
0
+ K) .Kis another experimental constant. The values ofEpm 531
No. - A,,,, [nm] Fibre characteristics General
Diam. [mm] Aatt [Cm] No Luminescencer [ns] v -Propagationt [ns/m] a [ns]
all - 650 1 91 < 0.3 6.0 ± 0.3 6.2 ± 1 .1 1 .3 ± 0.4 a12 - 600 1 83 0.3 3.2 ± 0.2 6.0 ± 0.9 0.5 ± 0.2 al3 - 590 1 133 0.3 5.7 ± 0.1 6.1 ± 0.1 0.9 ± 0.3 a10 - 530A 1 368 0.9 15.9±0.2 6.1±0.4 2.9±0.5 a15 - 530 1 354 1 .0 14.9±0.3 6.0±1 .8 2.6±0.5 al51 - 530/1 1 195 3.0 8.5 ± 0.1 5.8 ± 0.5 0.6 ± 0.2 a14 - 460 1 148 7.0 3.5 ± 0.1 6.6 ± 0.4 0.3 ± 0.2 al6 - 430 1 174 6.0 2.3 ± 0.1 6.6 ± 0.5 0.3 ± 0.2 a17 - 420 1 204 5.9 2.6 ± 0.2 6.6 ± 0.5 0.2 ± 0.1 al71 - 420A 1 161 6.0 2.9 ± 0.1 6.5 ± 0.5 0.3 ± 0.2 K3HF - 530 0.8 349 3.6 8.3 ± 0.1 6.5 ± 1 .3 0.3 ± 0.2 as l - 650 0.5 283 0.1 6.5 ± 0.3 5.8 ± 0.5 1 .5 ± 0.4 as2 - 600 0.5 55 0.2 2.8 ± 0.2 5.8 ± 0.5 1 .5 ± 0.4 as3 - 590 0.5 54 0.3 4.8 ± 0.2 6.5 ± 0.5 1 .0 ± 0.3 as0 - 530A 0.5 283 0.4 15.0 ± 1 5.5,± 1 .7 3.2 ± 0.6 as51 - 530/1 0.5 214 1.3 4.8 ± 0.2 6.6 ± 0.5 1 .0 ± 0.3 as52 - 530/2 0.5 221 0.5 17.2±0.3 5 .9±1 .6 3.1±0.5 as4 - 460 0.5 142 1 .1 3.5 ± 0.2 6.4 ± 1 .2 0.7 ± 0.3 as6 - 430 0.5 142 3.3 2.3 ± 0.1 6.9 ± 0.5 0.4 ± 0.2 as7 - 420 0.5 188 4.3 2.59±0.05 6.6±0.5 0.3±0.2 as71 - 420A 0.5 177 2.7 2.78 ± 0.05 6.7 ± 0.5 0.4 ± 0.2
532 D. Autiero et al. and K are given by a fit of N(¢) : e,m is 5% f 1% for green light (530 nm) lasers, in agreement with the nominal value for a photomultiplier with a bialkali photocathode [7 ] .
3.5. Experimental results
The experimental parameters for 1 mm, 0.8 mm and 0.5 mm diameter fibres are reported in table 1. Column 1 shows the conventional abbreviation and the emission wavelength of each sample; column 2 shows the diameter of each fibre; columns 3 and 4 show the experimental values of Aatt and No, respec-tively. Column 5 shows the results of the measure-ments of the luminescence decay time of each fibre. Finally, column 6 shows the experimental values of the inverse of the propagation speed of light in each fibre, and column 7 shows the statistical standard de-viation of v - ~ . These results will be discussed in sec-tion 4.
4. Concluding remarks
Looking at table 1 we see that several commercially available fibres have an attenuation length greater than 2.5 m (value taken as a guideline from the Monte Carlo simulation) even for 0.5 mm fibres. In partic-ular, let us consider the as51, as52 and as0, emitting green scintillation light (530 nm) : for these fibres, given a PM quantum efficiency of - 5%, the number of photons extrapolated to 0 (No' ) is -15-20, again in agreement with the Monte Carlo requirements.
From table 1 we see that the decay time for green fibres is generally longer than for blue fibres, but the spread of the arrival time is always - 3 ns. The in-verse of light propagation speed is - 6 ns/m for all the fibres; this speed, together with the arrival time spread, would limit the sensitive length of the fibres to - 2 m if the detector is to be ready at each bunch-crossing (every 15 ns) .
In conclusion, this investigation shows that the al-ready commercially available fibres (0.5-1 mm) in diameter are almost adequate for a tracker detector at future hadron colliders. Also the radiation resistance
/A possible scintillatingfibre tracker
of these fibres to the radiation doses expected at the LHC seems adequate [ 9 ] .
On the other hand, due to the relatively low num-ber of produced photons, a photon detector with high quantum efficiency (> 50%) and very low noise is necessary, and future efforts should be addressed mainly in this direction.
Acknowledgements
We would like to thank S. Lami for his contribution at the initial stage of the Monte Carlo calculation.
Also we warmly thank G. Stefanini for the contin-uous support and advice he has provided during this work.
M. Del Colletto, D. Rizzi and E. Pucciarelli gave a valuable technical support for the realization of this experiment.
References
[ 1 ] T. Mouthuy, ASCOT/EAGLE Internal Note, INDET-NO-012 (1992).
[2] R. Brun et al., GEANT User's Guide, DD Service, CERN (1991).
[ 3 ] M. Atac and M.D. Petroff, Scintillating fiber tracking using visible light photon counters, in: Proc. Symp. on Detector R&D for the SSC, Fort Worth, Texas, 1990. [4] D. Denegri, Standard model physics at the LHC (pp
collisions), in: Proc. of the Large Hadron Collider Workshop, Aachen, 1990, vol. l, eds. G. Jarlskog and D. Rein (CERN 90-10).
[5] ATLAS, Letter of Intent for a General Purpose pp Experiment at the Large Hadron Collider at CERN, CERN/LHCC/92-4,LHCC/12 .
[6] See, for instance: D. Crosetto and L. Love, SSCL-576 (1992).
[71 Photomultiplier Tubes, Hamamatsu Photonics K.K., Electron Tube Division, 314-5, Shimokanzo, Toyooka-village, Iwata-gun, Shizuoka-ken, 438-01 Japan. [8] J.M. Flournoy, An introduction to organic scintillators,
in: Proc. Workshop on Scintillating Fiber Detector Development for the SSC, Fermilab, 1988.
[9] D. Bisello et al., Nucl. Instr. and Meth. A 325 (1993) 446.