Introduction
Paratuberculosis (PTB), also known as Johne’s disease, is a chronic intestinal infection caused by Mycobacterium avium subsp. paratuberculosis (MAP) which primarily affects domestic and wild ruminants. However, many species were described as susceptible to the disease and transmission between wildlife and domestic animals has been reported (Stevenson et al. 2009). Particularly, deer and wild rabbits may play a significant role in MAP epidemiology (Carta et al. 2013). Wildlife may pose a risk for domestic animals, potentially introducing MAP into free herds (Corn et al. 2005). The infection is frequently subclinical and the clinical signs, including weight loss and unresponsive watery diarrhoea, develop at late‑stage of the infection, thus MAP can persist undetected for many years at herd level. In domestic ruminants, infection leads to economic losses due to milk production decrease and reduced slaughter value (Ott et al. 1999). At post‑mortem,the
pathogen might be responsible for terminal ileal mucosa thickening due to lymphocitic infiltrates (granulomatous enteritis) (Behr and Collins 2010). In cattle, the risk of infection decreases after six months of age. Juvenile animals are mostly infected via the fecal‑oral route or by the consumption of milk and colostrum from infected cows (Rathnaiah et al. 2017). Concerns on the zoonotic potential of the disease have been raised because of the similarity with Crohn’s disease, however, evidence linking MAP and Crohn’s disease is far from conclusive (Griffiths 2002). Due to the economic importance and potential public health threat, most of the European countries have established control programmes, mainly in cattle. These programmes are based on testing and culling strategy. In cattle, the use of vaccines may interfere with both intradermal and serological tests for the diagnosis of tuberculosis, and with tuberculosis control programmes (Garcia and Shalloo 2015). Nevertheless, the use of vaccines in small ruminants has been useful to reduce losses 1Department of Veterinary Sciences, University of Turin, Grugliasco (TO), Italy. 2Department of Veterinary Medicine, University of Bari, Valenzano (BA), Italy 3Department of Animal Health, Regional Campus of International Excellence ‘Campus Mare Nostrum’, University of Murcia, Murcia, Spain. *Corresponding author at: Department of Veterinary Sciences, University of Turin, Largo Paolo Braccini 2, 10090 Grugliasco (TO), Italy. E-mail: [email protected]. Keywords Paratuberculosis, Europe, Epidemiological status, Spatial distribution, Multilevel model, WAHIS. Summary
Mycobacterium avium subsp. paratuberculosis (MAP) is the etiological agent of paratuberculosis
(PTB), a disease affecting domestic and wild ruminants. MAP may also play a zoonotic role in Crohn’s disease. Although both governments and industries are carrying out programmes to prevent and control the infection, there is a lack of harmonization across Europe. Moreover, the success of these programmes is influenced by the current lack of sensitivity of the diagnostic tests used. For these reasons, it is complex to evaluate the overall epidemiological situation of this disease. This study describes the European distribution of PTB from 2010 to 2017 using the information reported by Member Countries to the OIE. Countries were classified in three categories (‘Absent’, ‘Epizootic’, ‘Enzootic’) depending on the disease epidemiology, and the trend of countries reporting the disease presence was computed throughout the study period. A multilevel model with random slope was built for twelve countries, with complete reporting history. Most of the countries (57.44%) were classified as ‘Enzootic’. The percentage of countries reporting the disease presence slightly increased along the study period, probably due to the improvement of PTB monitoring, rather than to a deterioration of the epidemiological situation of the disease in Europe. Results of the model account for different dynamics in the number of outbreaks reported by ‘Enzootic’ and ‘Epizootic’ countries.
Angela Fanelli
1*, Domenico Buonavoglia
2, Carlos Martinez Carrasco Pleite
3and Paolo Tizzani
1an overview from 2010 to 2017
Veterinaria Italiana 2020, 56 (1), 13‑21. doi: 10.12834/VetIt.1829.9692.3
Countries that regularly provided data for this eight‑year period were considered in the analysis (forty‑seven Member Countries). Quantitative data were grouped by semester, and Member Countries were classified in three categories:
a. ‘Absent’ Countries: Member Countries where the disease was reported as absent throughout the whole study period
b. ‘Epizootic’ Countries: Member Countries where the disease was reported as present but for which there was at least a two‑years period with no report of cases
c. ‘Enzootic’ Countries: countries where the disease was present and for which all periods of absence were shorter than two years. The two‑year period of absence, to identify epizootic and enzootic countries was used, as it is the most frequent time range used in the OIE Terrestrial Animal Health Code, to consider countries free from a disease (even if no specific chapter is available for PTB). However, it is important to notice that for countries in which in the previous two years the clinical disease was not reported, this does not mean that paratuberculosis is not present, if a surveillance program is not implemented, because the incubation period of PTB is 2‑15 years.
The disease status in the different countries was mapped using Quantum GIS version 3.2.0 (QGIS Development Team 2017), for both domestic animals and wildlife.
The trend in percentage of infected countries per semester was computed throughout the study period to evaluate the dynamics of the epidemiological situation of the disease.
Average yearly figures on number of veterinarians engaged in animal health activities as well as national bovine, sheep and goat populations, were obtained from the annual reports submitted to the OIE by the national veterinary authorities of the Member Countries3. The ratio between the
average number of veterinarians and selected animal populations was used as a proxy to evaluate countries capacity for disease monitoring. Pairwise one‑tailed Wilcoxon tests were used to compare the number of veterinarians (normalized to susceptible animals) in the three disease categories. Boxplots were drawn for graphical evaluation. All statistical analyses were performed using R software version 3.5.0 (R Core Team 2018). Significant differences were considered at p < 0.05.
A multilevel model was built to assess the effects (Fridriksdottir et al. 2000). Control programmes find
some constraints in being accepted by farmers and veterinarians because of the cost, the effort required and the duration (Khol and Baumgartner 2012). The European surveillance framework is heterogeneous, with countries such as Sweden performing a rigorous mandatory control programme with a stamping out policy (SFS 1999:657)1, other countries
such as Spain with voluntary regional programmes and countries with no control programmes at all. The success of disease control is influenced by the lack in sensitivity of diagnostic tests. Tests reliability is low at early stages of infection, representing one of the major limits for PTB control (Maroudam et al. 2015). Ante mortem diagnostic tests include direct and indirect methods, however, none of the available tests is recommended to be used alone, by the OIE Manual of Diagnostic Tests and Vaccines for Terrestrial Animals [World Organisation for Animal Health (OIE) 2018]. For these reasons, a negative test result is not enough to prove that the animal is MAP free (Manning and Collins 2001). The complexity of MAP infection and the different conditions across European countries represent the major constraint to set up an epidemiological framework at regional scale. Moreover, there is no disease case definition available in the OIE Terrestrial Animal Health Code. To assess the heterogeneity of PTB situation in Europe; Member Countries were classified into three disease categories depending on PTB occurrence throughout the study period (‘Absent’, ‘Epizootic’, ‘Enzootic’), b) maps on countries disease status and presence of PTB in wildlife were built to spatially describe the disease, c) the percentage of the affected Member Countries per semester was computed during the period 2010‑2017, d) a hierarchical model was built to examine the impact of individual‑level (country) and group‑level (disease status) on the number of MAP outbreaks reported per semester, and e) the level of disease surveillance was evaluated comparing the number of veterinarians (normalized by susceptible animal populations) at country level.
Materials and methods
A database containing data on the occurrence of PTB and disease outbreaks for the period 2010‑2017 was built for the European countries. Data were retrieved from the OIE World Animal Health Information System (WAHIS)2. WAHIS is a dynamic
database constantly updated, and data included in this study refers up to 1 February 2019. Only Member
1 Swedish Ministry of Agriculture.2018. Epizootic Act (SFS1999:657). http://rkrattsbaser.gov.se/sfst?bet=1999:657 (accessed on 5 January 2019).
2 https://www.oie.int/animal‑health‑in‑the‑world/the‑world‑animal‑health‑information‑system/the‑world‑animal‑health‑information‑system/.
Countries (Italy, Spain, and Belgium) report details at administrative division level.
Table I summarizes wild species reported by countries throughout the study period. Information on species affected is provided in the database since 2012.
Trend of the disease along the period of
study
The trend in percentage of countries reporting the disease ‘present’ per semester is depicted by Figure 3. A slight and constant increase in the number of countries reporting the disease presence was observed along the period of study (mean increase of 0.6% per semester).
Hierarchical model for number of
outbreaks reported
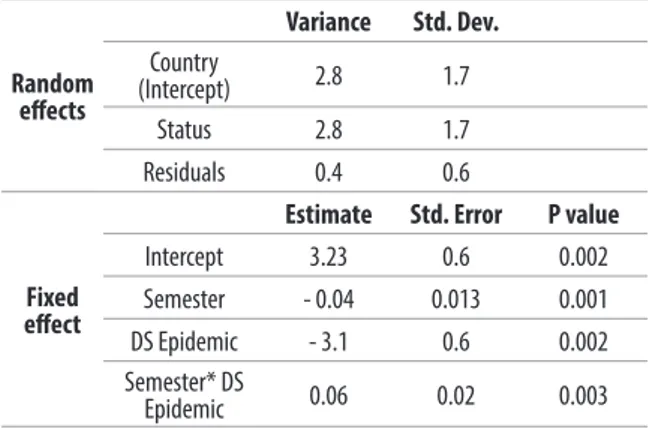
The best model is a random slope model with the relationship between number of outbreaks and disease status varying across countries. Table II presents model results, with all the variables that resulted significant (fixed and random effects). The percentage of variance explained by the selected model is high (adjusted R2 = 0.88).
Country and disease status contribute equally to the explained random effect variance (47%). The mean number of outbreaks per year reported across countries is 3.2. Outbreak number shows a significant decrease along the period of study, with significant differences among status: the average reduction in number of outbreaks in ‘Epizootic’ countries is 0.04 vs 3.1 in ‘Enzootic’ countries. In of group‑level (disease status) and individual‑level
(countries) on the number of outbreaks reported per semester. Countries that didn’t report quantitative data along with countries reporting PTB absent during the study period were excluded from the analysis (twelve countries selected). Data normalization was applied to the number of outbreaks (log transformation).
Hierarchical analysis was performed with R version 3.5.0 (R Core Team 2018). The lme4 v1.1‑20 (Bates et al. 2015) and the lmerTest v3.1‑0 (Kuznetsova et al. 2017) packages were used.
The Akaike’s Information Criterion (AIC) (Akaike 1973) and the likelihood ratio test were used to select the best model. Homogeneity of variance was assessed with diagnostic plots, from lattice v0.20‑35 (Sarkar 2008).
Results
Geographic distribution of the disease
and species affected
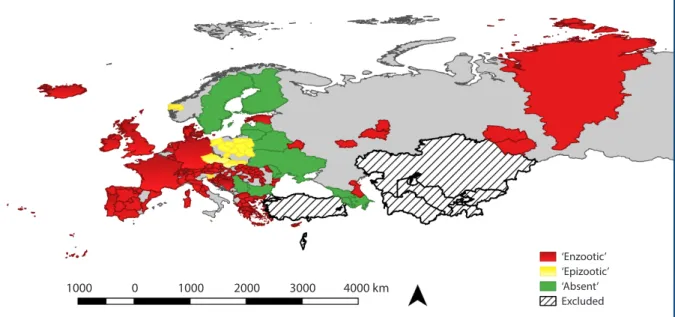
Figure 1 shows European countries based on their animal health status. The majority of Member Countries were classified as ‘Enzootic’ (57.4%). ‘Epizootic’ Member Countries are concentrated in Central Europe (12.7%). ‘Absent’ Member Countries (29.7%) are located both in Eastern and North Europe. Figure 2 shows wildlife status. Data accuracy for wildlife varies among the countries: four Member Countries (Germany, Hungary, Netherlands, and United Kingdom) provide the information at national scale, three Member
Figure 1. Status of PTB in European countries based on information reported by countries in the period 2010‑2017 (Data from World Animal Health
Information System, WAHIS).
1000 0 1000 2000 3000 4000 km
‘Enzootic’ ‘Epizootic’ ‘Absent’ Excluded
Veterinary surveillance
at country level
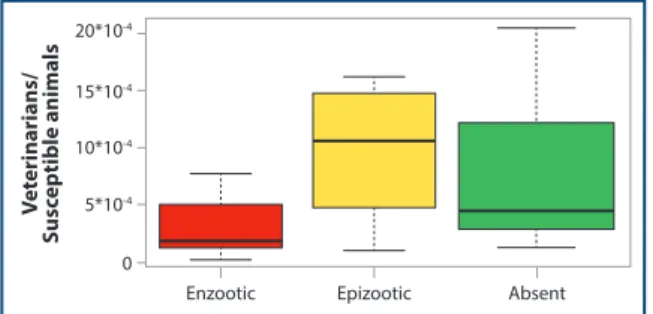
The number of veterinarians engaged in animal health activities (normalized to susceptible animals) was significantly lower for ‘Enzootic’ countries compared to ‘Epizootic’ (p value = 0.02) and to ‘Absent’ countries (p value = 0.02) (Figure 5). No statistically significant differences were observed between ‘Absent’ and ‘Enzootic’ countries (p value = 0.2).
Discussion
This paper reports the status of PTB at European level, summarizing the official information reported particular, the divergence between disease status is
0.06 for time unit. The selected model fits very well with the heterogeneous data on reported outbreaks (Figure 4).
Table I. Reported wild species for the selected countries for PTB from 2012
to 2017 [Data from World Animal Health Information System (WAHIS)]. Country Reported wild species affected by PTB
Belgium
Capreolus capreolus Cervus elaphus
Cabra ibex
Germany Cervidae
Hungary Cervus elaphus
Sus scrofa Italy Cervus elaphus Capreolus capreolus Rupicapra rupicapra Cabra ibex Argali sheep Muflon Ovis ammon Ovis musimon Dama dama
Netherlands Cervidae (unidentified)
Spain
Capra pyrenaica Cervus elaphus
Dama dama
Switzerland Wildlife (species unkown)
United Kingdom of Great Britain & N. Ireland
Camelidae Cervidae 0.6 0.4 0.2 0.0 2010 2012 2014 2016
Figure 3. Percentage of countries reporting PTB presence from 2010 to
2017. Black line shows the real values and red line shows the trend. [Data from World Animal Health Information System (WAHIS)].
Figure 2. PTB presence in wild species reported by European countries in the period 2010‑2017 (Data from World Animal Health Information System
(WAHIS).
1000 0 1000 2000 3000 4000 km Present
European countries, and that a significant increase of the percentage of countries reporting the disease as present was observed during the study period. This finding may reflect the improvement of countries efforts for the early identification of MAP, through ad hoc programmes for active surveillance, rather than a deterioration of the epidemiological situation of the disease in the region. This is especially true if we considering the characteristics of the disease, that easily becomes endemic in affected countries, along with the difficulties in diagnosis and in performing proper monitoring. The success of targeted surveillance programmes requires a long term commitment from both government and agricultural sector (Benedictus and Kalis 2003). Levels of control vary over Europe being regional or national programmes, compulsory or voluntary based. For instance, in Italy, guidelines for the control of bovine PTB were developed to meet the request of China, India and Russia which are the leading importer of Italian milk and dairy‑products (Luini et al. 2013). Although reporting cases is compulsory, certification of farms is on voluntary basis and, therefore, disease monitoring and reporting is not homogeneous. In Spain a national surveillance programme is not implemented, and most of disease surveillance is based on regional initiatives. Among by veterinary services to the World Organisation
for Animal Health. Few papers have described a global overview of the epidemiological situation of the disease, being most of them more focused on national or subnational aspects. In this context the main value of the present work is to provide information on the current status of the disease under a European perspective, and its dynamics during the last eight years.
Data show that PTB is present in a large majority of
Table II. Multilevel model results. Details for random effects and fixed
effects are displayed.
Random effects Variance Std. Dev. Country (Intercept) 2.8 1.7 Status 2.8 1.7 Residuals 0.4 0.6 Fixed effect
Estimate Std. Error P value
Intercept 3.23 0.6 0.002 Semester - 0.04 0.013 0.001 DS Epidemic - 3.1 0.6 0.002 Semester* DS Epidemic 0.06 0.02 0.003 O utbr eaks (lo g sc ale) 6 4 2 0 Austria ‘Enzootic’ Semester 6 4 2 0 Greece ‘Enzootic’ 4 8 12 6 4 2 0 Poland ‘Epizootic’
Czech Republic ‘Epizootic’
Hrvatska ‘Enzootic’ 4 8 12 Slovenia ‘Epizootic’ Estonia ‘Enzootic’ Italy ‘Enzootic’ 4 8 12 Spain ‘Enzootic’ Germany ‘Enzootic’ Norway ‘Epizootic’ 4 8 12 Switzerland ‘Enzootic’
can be either conducted as general surveillance (passive surveillance) or targeted surveillance (active surveillance) (Kuiken et al. 2011). In case of PTB, specific targeted surveillance is declared by the following countries: Belgium, Bulgaria, Netherlands, Norway, Switzerland and United Kingdom (data reported on WAHIS interface ‑ www.oie.int/wahid.), while general surveillance programmes on wildlife are present also in other countries. Considering the difficulties in monitoring wildlife, the countries able to conduct active surveillance in wild population can be considered as having a high level of monitoring of the disease.
Concerning the affected species, PTB was reported in Europe mainly in cervids (Table I), however transmission of MAP between rabbits and cattle has been reported (Stevenson et al. 2009) and high prevalence of PTB in wild rabbit population may be associated with high prevalence in domestic animals (Shaughnessy et al. 2013). Despite these facts, no case in lagomorphs has been reported by countries during the study period. Some reports in unusual species (i.e. in Camelidae from UK), are due to the fact that monitoring of the disease concerns not only native wildlife, but also zoo and captive wild animals. The multilevel model presented in this study indicates that the number of outbreaks in ‘Epizootic’ countries significantly decreased in time compared with the ‘Enzootic’ countries. Considering that, the analysis focused only on countries with constant level and quality of information provided, this reduction may be considered as a real improvement of disease situation in the concerned countries, probably due to a successful implementation of control programmes. Multilevel models are routinely used in veterinary epidemiology, but most commonly in their simplest form using the random intercept approach (Stryhn et al. 2006). The model selected in this study is a random slope model, which accounts of both group (disease status) and individual (country) variability. This model was able to properly describe the variance in the number of outbreaks reported along the study period, and so to provide a better insight of the disease dynamics. Finally, our work shows that limited veterinary workforce in animal public health field may be a big constraint for successful control of diseases. A strong relationship was in fact observed between the number of veterinarians, normalized for the susceptible animals, and disease situation of countries. In particular, ‘Enzootic’ countries were found to have less veterinarians (normalized to susceptible animals) engaged in animal health activities than ‘Epizootic’ or ‘Absent’ countries. Nevertheless, the positive result of surveillance programme doesn’t depend only on the number of veterinarians but also on the quality of veterinary services as well as the extent to which farmers are them, a specific programme to reduce economic
losses of cattle infection is implemented in the Basque autonomous community (Nielsen 2009). Other countries like Sweden included the disease control in the Swedish Epizootic Act (SFS 1999:657), and currently declare the absence of PTB at national level (Frössling et al. 2013).
According to the criteria used, twenty‑seven countries were classified as ‘Enzootic’, fourteen as ‘Epizootic’, and six as ‘Absent’ . The number of ‘Absent’ countries is probably overestimated, considering the epidemiological aspects of the disease [few clinical cases expressed, disease difficult to detect at herd level, long incubation period (2‑15 years)] along with the poor sensitivity of diagnostic tests during the latent period (Maroudam et al. 2015). The geographic distribution of the disease, as it appears from the information officially reported by veterinary services, has to be evaluated critically, in the light of the difficulties in disease surveillance and detection. It is important to remind that the effectiveness of any surveillance strategies is influenced by a clear understanding of the advantages of PTB control. Although PTB is notifiable in most countries, there is a lack of awareness on the economic impact of the disease and, therefore, countries tend to allocate resources for other animal diseases. Moreover, countries that undertake a control program have difficulties in measuring its impact (Whittington et al. 2019). A correct assessment of a control programme and the understanding of PTB economic burden are fundamental for long‑term control activities.
Official data reported by countries concerned also wildlife but surveillance programmes are not homogeneous across countries, so the absence of reporting may not be considered as a true absence. Although surveillance of the disease in wildlife may be difficult, it must be considered as important as surveillance in domestic animals (Vallat 2008). In fact, wild animals can transmit MAP to domestic species, either by direct or indirect contact (Chiodini and Hermon‑Taylor 1993). As highlighted above, wildlife surveillance varies across Europe and it
Vet erinarians/ Susc eptible animals 20*10-4 15*10-4 10*10-4 5*10-4 0
Enzootic Epizootic Absent
Figure 5. Number of Veterinarians (normalized to susceptible animals)
in the three disease status categories [Data from World Animal Health Information System (WAHIS)].
describing the epidemiological situation of PTB at regional scale using data of the OIE reporting system (WAHIS). The different levels of reporting of the epidemiological situation of the disease, mainly for what concerns quantitative information (no constant quality of information provided by all the countries along the period of study), may bias some of our results. Despite this, the main strength of the study is that it takes into consideration only information reported by veterinary services at the OIE, and represents so the most complete officially reported situation of the disease in Europe. This is also one of the few epidemiological studies implementing a multilevel model to describe heterogeneous data on the number of outbreaks reported. The results presented must be carefully interpreted in the light of the disease epidemiology and different level of surveillance. For a better control of the disease, countries should improve their monitoring systems, in order to increase surveillance and probability of outbreaks detection in both domestic animals and wild species. This study will serve as a basis for further studies on the epidemiological status of PTB at regional scale.
willing to participate into surveillance programmes. For instance, in 2006 Denmark, which have reported MAP presence throughout the whole study period, has initiated a programme called ‘Operation Paratuberculosis’ characterized by standard education of farmers and local health advisors (Nielsen et al. 2007). Also in this case, these results must be considered cautiously as global indicator of the importance of veterinary services, and not as an index of each Member Countries efficiency in disease detection and control.
Conclusions
MAP infection leads to economic losses in farms. The bacteria may also have a role in the development of Crohn’s disease in humans. For these reasons, PTB control has arisen interest of countries over time. The restriction of livestock and dairy marketing in case of infection imposed by some countries has globally led to develop more efficient surveillance programmes. Despite these attempts, there is still a wide variation both in MAP reporting and monitoring among countries. This is the first study
Akaike H. 1973. Information theory and an extension of the maximum likelihood principle. In Proc. the 2nd International Symposium on Information Theory
(Petrov B.N. & Csaki F., eds). Akadémiai Kiadó, Budapest, 267‑281.
Bates D., Mächler M., Bolker B. & Walker S. 2015. Fitting linear mixed‑effects models using lme4. J Stat Softw, 67 (1), 1‑48.
Behr M.A. & Collins M. 2010. Paratuberculosis: organism, disease, control. CABI, 375 pp.
Benedictus G. & Kalis C.J.H. 2003. Paratuberculosis: eradication, control and diagnostic methods. Acta Vet
Scand, 44 (3‑4), 231‑241.
Carta T., Álvarez J., Pérez de la Lastra J.M. & Gortázar C. 2013. Wildlife and paratuberculosis: a review. Res Vet
Sci, 94 (2), 191‑197.
Chiodini R.J. & Hermon‑Taylor J. 1993. The thermal resistance of Mycobacterium paratuberculosis in raw milk under conditions simulating pasteurization. J Vet
Diagn Invest, 5 (4), 629‑631.
Corn J.L., Manning E.J.B., Sreevatsan S. & Fischer J.R. 2005. Isolation of Mycobacterium avium subsp.
paratuberculosis from free‑ranging birds and mammals
on livestock premises. Appl Environ Microbiol, 71 (11), 6963‑6967.
Fridriksdottir V., Gunnarsson E., Sigurdarson S. & Gudmundsdottir K.B. 2000. Paratuberculosis in Iceland:
References
epidemiology and control measures, past and present.
Vet Microbiol, 77 (3‑4), 263‑267.
Frössling J., Wahlström H., Ågren E.C.C., Cameron A., Lindberg A. & Sternberg Lewerin S. 2013. Surveillance system sensitivities and probability of freedom from
Mycobacterium avium subsp. paratuberculosis infection
in swedish cattle. Prev Vet Med, 108 (1), 47‑62.
Garcia A.B. & Shalloo L. 2015. Invited review: the economic impact and control of paratuberculosis in cattle. J Dairy
Sci, 98 (8), 5019‑5039.
Griffiths M. 2002. Mycobacterium paratuberculosis.
In Foodborne pathogens hazards, risk analysis
and control. (De W., Blackburn C. & McClure P.J., eds). Woodhead Publishing, Abington Cambridge, 489‑497.
Khol J.L. & Baumgartner W. 2012. Examples and suggestions for the control of paratuberculosis in European Cattle. Jpn J Vet Res, 60 (Supplement), S1‑S7. Kuiken T., Ryser‑Degiorgis M.P., Gavier‑Widén D. &
Gortázar C. 2011. Establishing a European network for wildlife health surveillance. Rev Sci Tech Off Int Epiz, 30 (3), 755‑761.
Kuznetsova A., Brockhoff P.B. & Christensen R.H.B. 2017. lmerTest package: tests in linear mixed effects models.
J Stat Softw, 82 (13), 1‑26.
Luini M., Foglia E., Andreoli G., Tamba M. & Arrigoni N. 2013. Control and certification plan for bovine
Shaughnessy L.J., Smith L.A., Evans J., Anderson D., Caldow G., Marion G., Low J.C. & Hutchings M.R. 2013. High prevalence of paratuberculosis in rabbits is associated with difficulties in controlling the disease in cattle. Vet
J, 198 (1), 267‑270.
Stevenson K., Alvarez J., Bakker D., Biet F., De Juan L., Denham S., Dimareli Z., Dohmann K., Gerlach G.F., Heron I., Kopecna M., May L., Pavlik I., Sharp J.M., Thibault V.C., Willemsen P., Zadoks R.N. & Greig A. 2009. Occurrence of Mycobacterium avium subspecies paratuberculosis across host species and European countries with evidence for fransmission between wildlife and domestic ruminants. BMC Microbiol, 9 (212), 1‑13. Stryhn H., De Vliegher S. & Barkema H.W. 2006. Contextual
multilevel models: effects and correlations at multiple Levels. In Proc. 11th International Symposium on
Veterinary Epidemiology and Economics (ISVEE). Cairns. Vallat B. 2008. Improving wildlife surveillance for its
protection while protecting us from the diseases it transmits. https://www.oie.int/eng/PDF_WORD_ Vademecum/DELEGUE_FINAL/Slide%207/EN/ Faune_Sauvage/15072008/Improving%20wildlife%20 surveillance.pdf.
Whittington R., Donat K., Weber M.F. ... de Waard J.H. 2019. Control of paratuberculosis: who, why and how. A review of 48 countries. BMC Vet Res, 15 (1), 198.
World Organisation for Animal Health (OIE). 2018. Paratuberculosis (Johne’s Disease). In The Manual of Diagnostic Tests and Vaccines for Terrestrial Animals, 27th Ed. Office International des Epizooties,
Paris, 544‑559. paratuberculosis of cattle: criteria and cost‑benefit
analysis. Large Anim Rev, 19 (6), 257‑265.
Manning E.J.B. & Collins M.T. 2001. Mycobacterium avium subsp. paratuberculosis: pathogen, pathogenesis and diagnosis. Rev Sci Tech Off Int Epiz, 20 (1), 133‑150. Maroudam V., Mohana Subramanian B., Praveen Kumar P.
& Dinahakar Raj G. 2015. Paratuberculosis: diagnostic methods and their constraints. J Veterinar Sci
Technol, 6, 259.
Nielsen S.S. 2009. Programmes on paratuberculosis in Europe. In Proc. 10 ICP, Minneapolis, 101‑108.
Nielsen S.S., Jepsen Ø.R. & Aagaard K. 2007. Control programme for paratuberculosis in Denmark. Bull Int
Dairy J, 410, 23‑29.
Ott S.L., Wells S.J. & Wagner B.A. 1999. Herd‑level economic losses associated with Johne’s Disease on US dairy operations. Prev Vet Med, 40, 179‑192.
QGIS Development Team. 2017. QGIS Geographic Information System. Open Source Geospatial Foundation.
R Core Team. 2018. A language and environment for statistical computing. R Foundation for Statistical Computing. Vienna, Austria. https://www.r‑project. org/.
Rathnaiah G., Zinniel D.K., Bannantine J.P., Stabel J.R., Gröhn Y.T., Collins M.T. & Barletta R.G. 2017. Pathogenesis, molecular genetics, and genomics of Mycobacterium
avium subsp. paratuberculosis, the etiologic agent of
Johne’s disease. Front Vet Sci, 4 (187), 1‑13.
Sarkar D. 2008. Lattice: multivariate data visualization with R. Springer, New York.
Annex 1
Publisher: Istituto Zooprofilattico Sperimentale dell'Abruzzo e del Molise ‘G. Caporale’ | Journal: Veterinaria
Italiana | Article Type: Reasearch Article | Volume: 56; Issue: 1; Year: 2020; doi: 10.12834/VetIt.1829.9692.3
Supplementary material. Model selection procedure.
Table A. Anova table: likelihood ratio test to find the best fixed structure.
Model Adjusted R2 AIC Loglik Pr (> Chisq)*
Linear - semester and status interaction (single level model) as explanatory variable 0.41 690 - 340.12
Random intercept - semester and disease status interaction as explanatory variable 0.86 431 - 209.84 < 2.2e-16***
Random slope - semester and disease status interaction as explanatory variable 0.88 420 - 202.11 0.0004415***
*P value of the likelihood ratio Chi-squared statistic. Signif. codes: 0 ‘***’ 0.001 ‘**’ 0.01 ‘*’ 0.05 ‘.’ 0.1 ‘ ’ 1
1. First step: finding the optimal structure of random component (Table A).
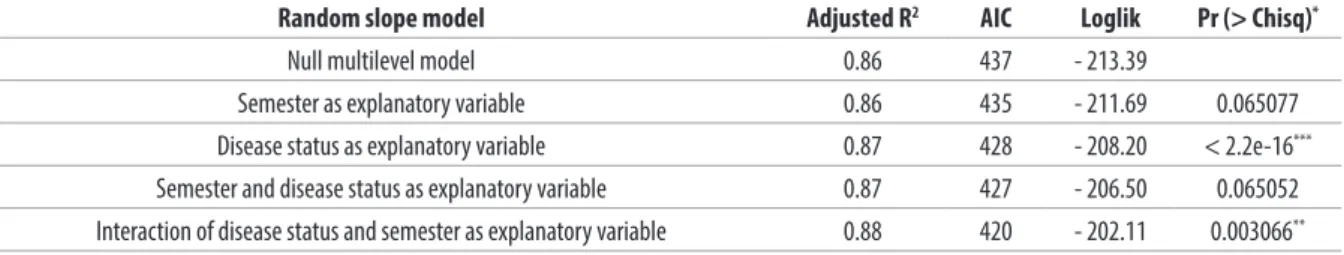
Table B. Anova table: likelihood ratio test to find the best fixed structure.
Random slope model Adjusted R2 AIC Loglik Pr (> Chisq)*
Null multilevel model 0.86 437 - 213.39
Semester as explanatory variable 0.86 435 - 211.69 0.065077
Disease status as explanatory variable 0.87 428 - 208.20 < 2.2e-16***
Semester and disease status as explanatory variable 0.87 427 - 206.50 0.065052
Interaction of disease status and semester as explanatory variable 0.88 420 - 202.11 0.003066**
*P value of the likelihood ratio Chi-squared statistic. Signif. codes: 0 ‘***’ 0.001 ‘**’ 0.01 ‘*’ 0.05 ‘.’ 0.1 ‘ ’ 1
2. Second step: finding the optimal fixed structure (Table B).