Family history of cancer as surrogate
predictor for immunotherapy with
anti-PD1
/PD-L1 agents: preliminary report of
the FAMI-L1 study
Alessio Cortellini*,1,2, Melissa Bersanelli‡,3, Sebastiano Buti‡,3, Elisabetta Gambale4,5, Francesco Atzori6, Federica Zoratto7, Alessandro Parisi1,2, Davide Brocco4,5, Annagrazia Pireddu6, Katia Cannita1, Daniela Iacono8, Maria R Migliorino8, Teresa Gamucci7, Michele De Tursi4,5, Tina Sidoni1, Maria Tiseo3, Maria Michiara3, Anselmo Papa9, Gesuino Angius9, Silverio Tomao10, Maria C Fargnoli11, Clara Natoli4,12& Corrado Ficorella1,2
1Medical Oncology Unit, St Salvatore Hospital, Department of Biotechnological & Applied Clinical Sciences, University of L’Aquila, Via Vetoio, 67100, L’Aquila, Italy
2Department of Biotechnological & Applied Clinical Sciences, University of L’Aquila, L’Aquila, Italy 3Medical Oncology Unit, University Hospital of Parma, Parma, Italy
4Medical Oncology Unit, SS Annunziata Hospita, Chieti, Italy
5Department of Medical, Oral & Biotechnological Sciences University G. D’Annunzio, Chieti-Pescara, Italy 6Medical Oncology Unit, University Hospital of Cagliari, Cagliari, Italy
7Medical Oncology Unit, F. Spaziani Hospital, Frosinone, Italy 8Pulmonary Oncology Unit, St. Camillo Forlanini Hospital, Rome, Italy
9Department of Medico-Surgical Sciences & Biotechnologies, University of Rome ‘Sapienza’, Latina, Italy
10Oncology Unit, Department of Radiological Sciences, Oncology & Pathology, University of Rome ‘Sapienza’, Latina, Italy 11Oncological Dermatology Unit, San Salvatore Hospital, University of L’Aquila, L’Aquila, Italy
12Department of Medical, Oral & Biotechnological Sciences & CeSI-MeT, University of Chieti-Pescara, Chieti and Pescara, Italy * Author for correspondence: Tel.: +39 08 6236 8709; Fax: +39 08 6236 8682; [email protected]
‡Authors contributed equally
Aim: Tumors related to hereditary susceptibility seem to have an immunosensitive phenotype. Materials & methods: We conducted a multicenter retrospective study, to investigate if family history of cancer, multi-ple neoplasms and early onset of cancer could be related to clinical outcomes of anti-PD-1/PD-L1 therapy. Activity and efficacy data of 211 advanced cancer patients (kidney, non-small-cell lung cancer, melanoma, urothelium, colorectal and HeN), treated at seven Italian centers with anti-PD-1/PD-L1 agents, were ana-lyzed. Results: In this preliminary report at multivariate analyses, positive family history of cancer showed a statistically significant relationship with a better objective response rate (p = 0.0024), disease control rate (p = 0.0161), median time to treatment failure (p = 0.0203) and median overall survival (p = 0.0221). Diagnosis of multiple neoplasms significantly correlates only to a better disease control rate, while in-terestingly non-early onset of cancer and sex (in favor of female patients) showed significant correlation with a better median overall survival (p = 0.0268 and p = 0.0272, respectively). Conclusion: This pilot study seems to individuate easily available patient’s features as possible predictive surrogates of clinical benefit for anti-PD-1/PD-L1 treatments. These preliminary results need to be confirmed with a greater sample size, in prospective trials with immunotherapy.
First draft submitted: 13 November 2017; Accepted for publication: 21 February 2018; Published online: 22 March 2018
Keywords: family history of cancer• immunotherapy • multiple neoplasms
The advent of immune checkpoint inhibitors (ICIs) has led to a revolution in the classical paradigm of cancer care. In some cases, responses are durable with extended median progression-free survival and median overall survival (OS) beyond previous standard of care therapies. Although it was initially hoped that ICIs could be ‘The Remedy’ for many types of cancers, limitations of clinical efficacy of this class of drugs are now emerging, and it is now clear that a large part of patients does not benefit from ICIs treatment. Currently in use checkpoint
inhibitors, all of which are monoclonal antibodies, fall into three main classes: anti-CTLA4, which target CTLA4 (such as ipilimumab), anti-PD-1, which target PD-1 (such as nivolumab and pembrolizumab) and anti-PD-L1, which target PD-L1 (such as atezolizumab, durvalumab and avelumab). Common clinical practice and health economics still suffer a lack of validated predictive biomarkers to select patients who would benefit from ICIs. PD-L1 protein expression, evaluated by immunohistochemistry staining, both in tumor and immune cells, has been investigated as a potential predictive biomarker[1], even in prospective trials[2], but its correlation with ICIs efficacy is still debated[3–5]. Different companion diagnostics, with different immunohistochemistry techniques and platforms were used in clinical trials, creating difficulties in routine use in clinical practice, despite the efforts of many ‘harmonization’ studies[6–9]. PD-L1 expression is probably a dynamic process influenced by many events, such as previous and/or concomitant treatments, and has a wide intra-/inter-patient variability[10–12]. The only exception that has led to reliable and routine use of the test came from positive experience of the Keynote-024 Trial, which established PD-L1 tumor expression>50% as predictive factor of benefit from pembrolizumab in first-line metastatic non-small-cell lung cancer (NSCLC) setting[13]. A different possible approach to predict immunotherapy efficacy is to analyze the somatic mutational landscape of the tumor, since a high mutational tumor burden has been shown to correlate with benefit from immunotherapy[14–16]. Microsatellite instability (MSI), a condition of genetic hypermutability that results from mismatch repair deficiency, correlates with the number of somatic mutations (especially in MSI-high cases), and many studies confirmed its positive correlation with ICIs treatment, particularly with anti-PD-1 antibodies[17,18]. MSI is known to be the hallmark of Lynch syndrome (LS), a familial clustering of colorectal and endometrial cancers. LS is caused by several germline mutations, which result in a defective mismatch repair and is inherited as dominant autosomal character. Similarly, BRCA 1 and 2 mutations, which have been associated with hereditary breast–ovarian cancer syndrome, may correlate with tumor mutational burden, because of the homologous recombination repair deficiency. ‘BRCA-like’ phenotype may be more sensitive to anti-PD-1/PD-L1 [19], thus prospective clinical trials with anti-PD1 for patients with germline BRCA 1/2 mutations are currently ongoing[20]. LS and breast–ovarian cancer syndrome are just two forms of inherited cancer susceptibility; even if notoriously only about 5–10% of all cancers result directly from germline mutations, we can hypothesize that much about family cancer syndromes and cancer predisposition is still unknown. Starting from this hypothesis and from the suggestion that tumors related to syndromes with inherited susceptibility to cancer seem to have an ‘immune-sensitive phenotype’, we investigated if positive family history of cancer (FHC) and diagnosis of metachronous and/or synchronous multiple neoplasms (MN), could be used as possible surrogate predictors of clinical benefit for anti-PD-1/PD-L1 treatments. Furthermore, among families with syndromes of inherited susceptibility to cancer, patients’ age at cancer diagnosis is typically lower when compared with those of non-hereditary cancer cases[21–23]. Thus, we hypothesized that there could also be a relationship between clinical outcomes with immunotherapy and early onset (EO) of cancer.
Materials & methods
Patient eligibility
This study evaluated advanced cancer patients who underwent treatment with anti-PD-1/PD-L1, regardless of the treatment line, at Medical Oncology Units of seven Italian centers. The patients were eligible if they had histologically confirmed diagnosis of measurable stage IV cancer, with filled records about FHC (positive or negative), and eventual history of metachronous or synchronous MN. All patients provided written, informed consent to the treatment with immunotherapy. The procedures followed were in accordance with the ethical standards of local responsible committees on human experimentation and precepts of Good Clinical Practice. Study design
A multicenter, retrospective, observational analysis of advanced cancer patients, treated with PD-1 or anti-PD-L1 monotherapy, as any treatment line, was performed. The aim of this study was to evaluate the correlations between FHC, MN, EO of cancer and clinical outcomes mostly used in clinical practice: objective response rate (ORR), disease control rate (DCR), median time to treatment failure (TTF) and median OS. ORR was defined as the portion of patients experiencing an objective response (complete response or partial response) as best re-sponse to immunotherapy; DCR was defined as the portion of patients which experienced an objective rere-sponse or demonstrated stable disease as best response to treatment. TTF was defined as the time from treatment’s start to discontinuation for any reason, including disease progression, treatment toxicity, patient preference or death; OS as the length of time between the beginning of treatment and death or to last contact. The correlations tests
were performed between clinical outcomes and the following patients’ features: FHC status (positive vs negative), diagnosis of MN (yes vs no), age at diagnosis (EO vs non-EO), sex (male vs female), Eastern Cooperative Oncology Group Performance Status (ECOG-PS) (0–1 vs ≥2), number of metastatic sites (including nonregional lymph nodes metastases) (≤2 vs >2) and treatment line (first vs nonfirst). Responses were evaluated with immune-related RECIST criteria[24].χ2 and Fisher’s exact test were used to correlate ORR and DCR with patient’s characteris-tics[25,26], using the appropriate test according to the sample size in contingency tables for each comparison. Odds ratio with 95% CI was used to estimate the association between ORR, DCR and predictor variables[27]. In the multivariate analysis, logistic regression was used to evaluate the role of parameters which resulted to be significant at the univariate analysis (including FHC and MN status) of ORR and DCR[28]. Median TTF and median OS were evaluated using the Kaplan–Meier method[29]. Median period of follow-up was calculated according to the reverse Kaplan–Meier method[30]. Cox proportional hazards model[31]was used to evaluate predictor variables in univariate and multivariate analysis for median TTF and median OS. Data cut-off period was November 2017. All statistical analyses were performed using MedCalc Statistical Software version 17.9.7 (MedCalc Software bvba, Ostend, Belgium; www.medcalc.org; 2017).
Definition of family history of cancer, multiple neoplasms & early onset
Family history was collected in straight and collateral lines, till the fourth degree of relatedness (cousins, children of parents’ siblings); positive FHC was defined, with at least one diagnosis of cancer found among the relatives. Diagnosis of metachronous and/or synchronous MN was defined according to the international association of cancer registry rules[32]. EO of cancer was defined for each primary tumor as follows: for NSCLC≤60 years[33], for kidney cancer≤46 years[34], for urothelial cancer≤40 years[35–37], for melanoma≤39 years[38,39], for colorectal cancer<50 years[40]and<45 years for head and neck carcinomas[41].
Results
Patients’ features
From April 2015 to October 2017, 211 stage IV cancer patients underwent a treatment with anti-PD-1/PD-L1 at 7 Italian centers (Medical Oncology units of: University Hospital of L’Aquila, University Hospital of Chieti, University Hospital of Parma, University Hospital of Cagliari, Hospital of Frosinone, Pulmonary Oncology Unit of St. Camillo-Forlanini Hospital of Rome and outpatient cancer care center of Aprilia). Median age was 68 years (range: 32–85), ECOG-PS 0–1, 179 patients (84.8%), ECOG-PS≥2, 32 patients (15.2%). Primary tumors were: renal cell carcinoma 41 patients (19.4%), melanoma 51 patients (24.2%), NSCLC 104 patients (49.3%), urothelial cancer 10 patients (4.7%), colorectal cancer three patients (1.4%) and head and neck carcinomas two patients (1%). Administered immunotherapies were: anti-PD-1 in 199 patients (94.3%) (pembrolizumab and nivolumab), anti-PD-L1 in 12 patients (5.7%) (atezolizumab and avelumab). Anti-PD-1/PD-L1 were administered as first-line treatment in 36 patients (17.1%), second-first-line in 103 patients (48.8%), third-first-line in 45 patients (21.3%), fourth-line in 19 patients (9.0%) and fifth-line in 8 patients (3.8%). Thirty-two patients (15.2%) had diagnosis of metachronous MN (no synchronous malignances were reported), 107 patients (50.7%) had positive FHC. The patients with EO of cancer were 21 (9.9%). All patients’ features, distinct by subgroup, are listed inTable 1. Activity & efficacy
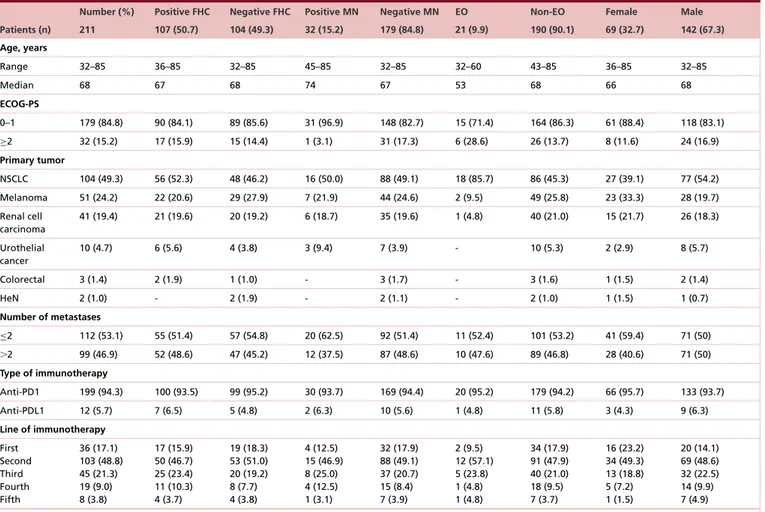
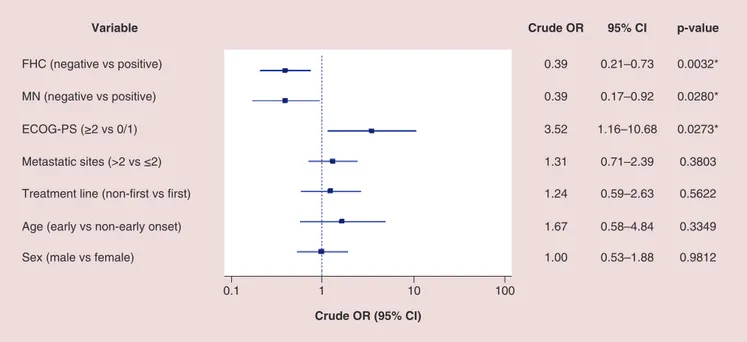
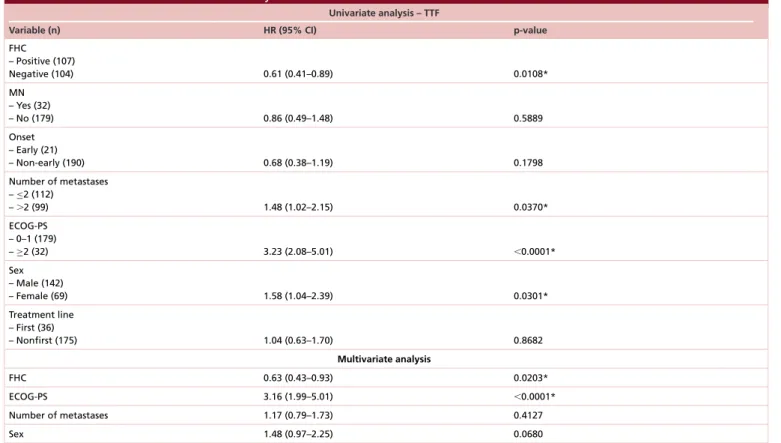
All activity data are summarized inTable 2. Among 211 patients, 190 (90.1%) were evaluable for activity; the other 21 patients (9.9%) had not yet evaluated the disease at the time of the data cut-off analysis. ORR and DCR in overall population were 37.4 and 60.5%, respectively. ORR and DCR among patients with positive FHC were 45.2 and 68.8%, while in patients with negative FHC were 24.7 and 52.6%. ORR and DCR among patients with diagnosis of MN were 53.8 and 84.6%, while in patients without diagnosis of MN were 31.7 and 56.7%. ORR and DCR among patients with EO of cancer were 25 and 55%, while in patients with non-EO of cancer were 35.9 and 61.2%. As the forest plot for univariate analysis shows (Figure 1), the variables which were significantly related to ORR are FHC (p = 0.0032), diagnosis of MN (p = 0.0280) and ECOG-PS (p = 0.0273). At multivariate analysis, FHC and ECOG-PS were confirmed as independent predictors for ORR (p = 0.0024 and p = 0.0295, respectively) while not diagnosis of MN (p = 0.0546) (Figure 2). Also regarding DCR, FHC (p = 0.0024), diagnosis of MN (p = 0.0085) and ECOG-PS (p = 0.0019) were significantly related at univariate analysis (Figure 3), and they all were confirmed as independent predictors at multivariate analysis (p = 0.0161, p = 0.0217 and p = 0051, respectively) (Figure 4).
Table 1. Patients’ features.
Number (%) Positive FHC Negative FHC Positive MN Negative MN EO Non-EO Female Male Patients (n) 211 107 (50.7) 104 (49.3) 32 (15.2) 179 (84.8) 21 (9.9) 190 (90.1) 69 (32.7) 142 (67.3) Age, years Range 32–85 36–85 32–85 45–85 32–85 32–60 43–85 36–85 32–85 Median 68 67 68 74 67 53 68 66 68 ECOG-PS 0–1 179 (84.8) 90 (84.1) 89 (85.6) 31 (96.9) 148 (82.7) 15 (71.4) 164 (86.3) 61 (88.4) 118 (83.1) ≥2 32 (15.2) 17 (15.9) 15 (14.4) 1 (3.1) 31 (17.3) 6 (28.6) 26 (13.7) 8 (11.6) 24 (16.9) Primary tumor NSCLC 104 (49.3) 56 (52.3) 48 (46.2) 16 (50.0) 88 (49.1) 18 (85.7) 86 (45.3) 27 (39.1) 77 (54.2) Melanoma 51 (24.2) 22 (20.6) 29 (27.9) 7 (21.9) 44 (24.6) 2 (9.5) 49 (25.8) 23 (33.3) 28 (19.7) Renal cell carcinoma 41 (19.4) 21 (19.6) 20 (19.2) 6 (18.7) 35 (19.6) 1 (4.8) 40 (21.0) 15 (21.7) 26 (18.3) Urothelial cancer 10 (4.7) 6 (5.6) 4 (3.8) 3 (9.4) 7 (3.9) - 10 (5.3) 2 (2.9) 8 (5.7) Colorectal 3 (1.4) 2 (1.9) 1 (1.0) - 3 (1.7) - 3 (1.6) 1 (1.5) 2 (1.4) HeN 2 (1.0) - 2 (1.9) - 2 (1.1) - 2 (1.0) 1 (1.5) 1 (0.7) Number of metastases ≤2 112 (53.1) 55 (51.4) 57 (54.8) 20 (62.5) 92 (51.4) 11 (52.4) 101 (53.2) 41 (59.4) 71 (50) ⬎2 99 (46.9) 52 (48.6) 47 (45.2) 12 (37.5) 87 (48.6) 10 (47.6) 89 (46.8) 28 (40.6) 71 (50) Type of immunotherapy Anti-PD1 199 (94.3) 100 (93.5) 99 (95.2) 30 (93.7) 169 (94.4) 20 (95.2) 179 (94.2) 66 (95.7) 133 (93.7) Anti-PDL1 12 (5.7) 7 (6.5) 5 (4.8) 2 (6.3) 10 (5.6) 1 (4.8) 11 (5.8) 3 (4.3) 9 (6.3) Line of immunotherapy First Second Third Fourth Fifth 36 (17.1) 103 (48.8) 45 (21.3) 19 (9.0) 8 (3.8) 17 (15.9) 50 (46.7) 25 (23.4) 11 (10.3) 4 (3.7) 19 (18.3) 53 (51.0) 20 (19.2) 8 (7.7) 4 (3.8) 4 (12.5) 15 (46.9) 8 (25.0) 4 (12.5) 1 (3.1) 32 (17.9) 88 (49.1) 37 (20.7) 15 (8.4) 7 (3.9) 2 (9.5) 12 (57.1) 5 (23.8) 1 (4.8) 1 (4.8) 34 (17.9) 91 (47.9) 40 (21.0) 18 (9.5) 7 (3.7) 16 (23.2) 34 (49.3) 13 (18.8) 5 (7.2) 1 (1.5) 20 (14.1) 69 (48.6) 32 (22.5) 14 (9.9) 7 (4.9) EO: Early onset; FHC: Family history of cancer; MN: Multiple neoplasm; NSCLC: Non-small-cell lung cancer.
Table 2. Activity data for overall population, and subgroups: positive family history of cancer, negative family history of cancer, diagnosis of multiple neoplasms, absence of multiple neoplasms, early onset of cancer and non-early onset of cancer.
Overall FHC Non-FHC MN Non-MN EO Non-EO
Number of evaluable patients 190 93 97 26 164 20 170 Objective response rate 37.4 (95% CI: 26.8–44.1) 45.2 (95% CI: 32.5–61.0) 24.7 (95% CI: 15.8–36.8) 53.8 (95% CI: 29.4–90.3) 31.7 (95% CI: 23.6–41.5) 25.0 (95% CI: 8.1–58.3) 35.9 (95% CI: 27.4–46.1) Partial/complete response 66 42 24 14 52 5 61 Disease control rate 60.5 (95% CI: 49.9–72.6) 68.8 (95% CI: 53.0–87.8) 52.6 (95% CI: 39.1–69.1) 84.6 (95% CI: 65.1–95.6)* 56.7 (95% CI: 45.7–69.4) 55.0 (95% CI: 27.4–98.4) 61.2 (95% CI: 49.9–74.1) Stable disease 49 22 28 8 41 6 43
EO: Early onset; FHC: Family history of cancer; MN: Multiple neoplasm.
*Used binomial confidence interval, beacuse of the small sample size of the subgroup.
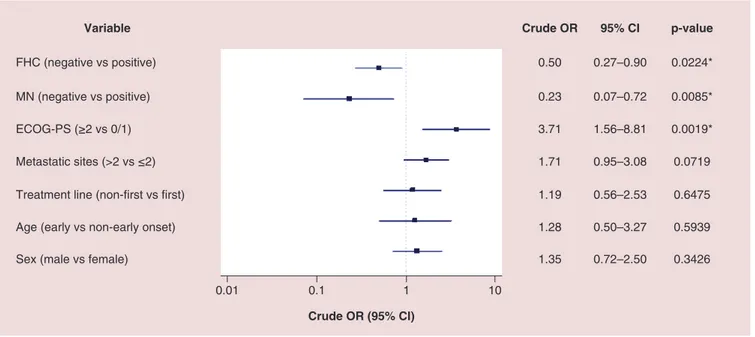
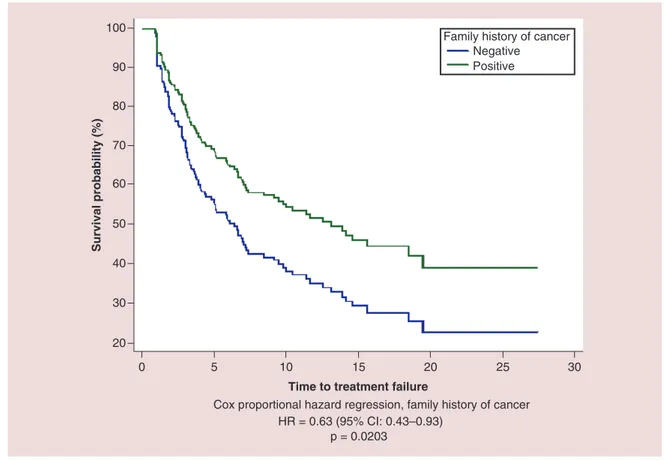
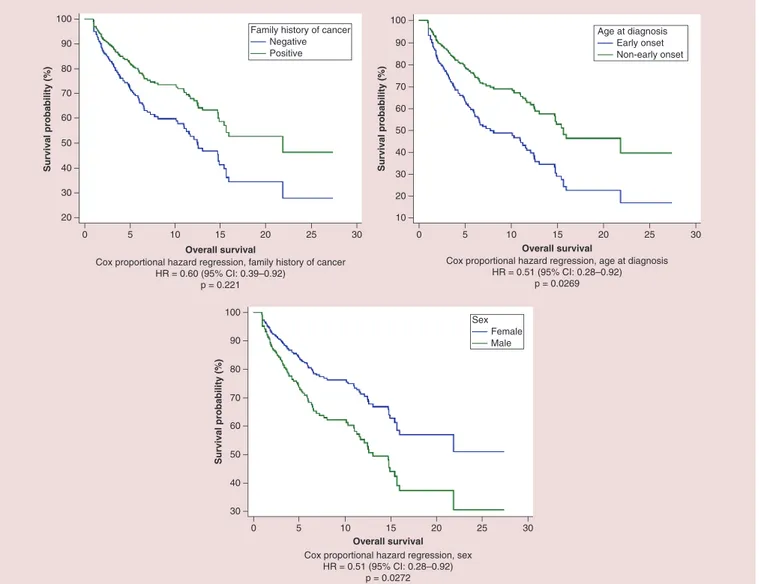
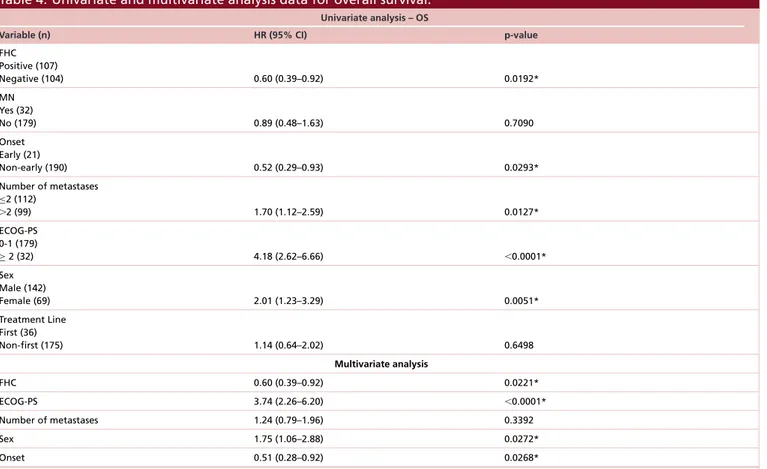
All the patients were evaluable for efficacy analysis; after a median follow-up of 12.6 months median TTF in overall population was 7.3 months (95% CI: 5.9–13.1) and median OS was 14.8 months (95% CI: 12.1–21.8) (Figure 5). At univariate analysis FHC (p = 0.0108), number of metastatic sites (p = 0.0370), ECOG-PS (p< 0.0001) and sex (p = 0.0301) were significantly related to median TTF, while only FHC (p = 0.0203) (Figure 6) and ECOG-PS (p< 0.0001) were confirmed as independent predictors at multivariate analysis (Table 3). At univariate analysis FHC (p = 0.0192), EO of cancer (p = 0.0293), number of metastatic sites (p = 0.0127), ECOG-PS (p< 0.0001) and sex (p = 0.0051) were significantly related to median OS. FHC (p = 0.0221), ECOG-PS (p< 0.0001), sex
0.1 1 10 100 Crude OR (95% CI)
Variable Crude OR 95% CI p-value
FHC (negative vs positive) MN (negative vs positive) ECOG-PS (≥2 vs 0/1) Metastatic sites (>2 vs ≤2) Treatment line (non-first vs first) Age (early vs non-early onset) Sex (male vs female)
0.39 0.39 3.52 1.31 1.24 1.67 1.00 0.21–0.73 0.17–0.92 1.16–10.68 0.71–2.39 0.59–2.63 0.58–4.84 0.53–1.88 0.0032* 0.0280* 0.0273* 0.3803 0.5622 0.3349 0.9812
Figure 1. Forest plot graph of univariate analysis of objective response rate. *Statistically significant.
0.1 1 10 100
Adjusted OR (95% CI)
Variable Adjusted OR 95% CI p-value
FHC (negative vs positive) MN (negative vs positive) ECOG-PS (≥2 vs 0/1) 0.37 0.42 3.53 0.19–0.70 0.17–1.01 1.13–11.04 0.0024* 0.0546 0.0295*
Figure 2. Forest plot graph of multivariate analysis of objective response rate. *Statistically significant.
(p = 0.0272) and EO of cancer (p = 0.0268) were confirmed as independent predictors at multivariate analysis (Figure 7&Table 3).
Discussion
The statistically significant correlations, at multivariate analyses, with a benefit in ORR, DCR, median TTF e (time to treatment failure calculated with kaplan-meier as a survival interval) median OS in favor of positive FHC, allow us to say that our preliminary results appear to confirm the hypothesis that FHC could be used as predictive surrogates of clinical benefit to anti-PD-1/PD-L1 therapy. Diagnosis of MN seems to have a less defined role, being significant related only to DCR. The lack of clinical decisional parameters for immunotherapy choice in advanced cancer patients makes it challenging to select the best treatment option, especially when not supported by the
0.01 0.1 1 10 Crude OR (95% CI)
Variable Crude OR 95% CI p-value
0.50 0.27–0.90 0.0224* 0.23 0.07–0.72 0.0085* 3.71 1.56–8.81 0.0019* 1.71 0.95–3.08 0.0719 1.19 0.56–2.53 0.6475 1.28 0.50–3.27 0.5939 1.35 0.72–2.50 0.3426 FHC (negative vs positive) MN (negative vs positive) ECOG-PS (≥2 vs 0/1) Metastatic sites (>2 vs ≤2) Treatment line (non-first vs first) Age (early vs non-early onset) Sex (male vs female)
Figure 3. Forest plot graph of univariate analysis of disease control rate. *Statistically significant.
0.01 0.1 1 10
Adjusted OR (95% CI)
Variable Adjusted OR 95% CI p-value
0.46 0.24–0.86 0.0161* 0.26 0.08–0.82 0.0217* 3.59 1.46–8.78 0.0051* FHC (negative vs positive) MN (negative vs positive) ECOG-PS (≥2 vs 0/1)
Figure 4. Forest plot graph of multivariate analysis of disease control rate. *Statistically significant.
presence of an indisputable biomarker. Sometimes, despite offering immune-checkpoint blockade as the probably best treatment chance for patients, we would like to improve our counseling to inform patients about their chance of benefit from this therapy. A simple anamnestic parameter, such as FHC, could be easily used, rather than as a method of selection, to provide a more tailored prediction of treatment outcomes. The hypothesis that there could be a relationship between clinical benefit with anti-PD-1/PD-L1 therapy and EO of cancer, was unexpectedly denied by our preliminary data, showing an opposite trend in favor of non-EO of cancer. A possible explanation could be represented by the higher incidence, among young patients, of very aggressive forms of cancers (such as renal carcinoma with Xp11.2 translocation). Our result of a statistically significant benefit in OS for patients with non-EO of cancer compared with whom with non-EO of cancer meets halfway the opposite evidences of immunosenescence and residual immunocompetence in elderly patients[42,43]. The statistically significant correlation between sex and median OS at multivariate analysis, in favor of female patients, remains partly unexplained, and needs further
30 40 50 60 90 Median TTF 7.3 months (95% CI: 5.9–13.1) Range: 1.0–20.1 No. of events: 112 Survival probability (%) 100 70 80 211 105 59 32 12 3 0 0 5 10 15 20 25 30 Number at risk 30 40 50 60 90 Median OS 14.8 months (95% CI: 12.1–21.8) Range: 1.0–20.1 No. of events: 89 Survival probability (%) 0 5 10 15 30 100 70 80 25 20 Number at risk 211 128 82 44 18 3 0
Figure 5. Kaplan–Meier survival estimate for median time to treatment failure and median overall survival in overall population.
0 5 10 15 20 25 30 20 30 40 50 60 70 80 90 100 Survival probability (%)
Time to treatment failure
Cox proportional hazard regression, family history of cancer HR = 0.63 (95% CI: 0.43–0.93)
p = 0.0203
Family history of cancer Negative
Positive
Figure 6. Cox proportional hazard regression survival estimate for positive versus negative family history of cancer in multivariate analysis.
confirmations. Even if it starts to be known that there are sex-driven differences in immunological responses, which could bring to different patterns of response to immunotherapy for male and female patients[44], asTable 1shows, male and female populations were unbalanced in two important categories: primary tumors (e.g., more NSCLC among male patients and more melanoma among female patients) and number of metastatic sites.
Among limits of the present study, the retrospective design with its selection biases, could partly explain that clinical outcomes in overall population are higher than what is generally reported with anti-PD-1/PD-L1 agents. We must also discuss about the heterogeneity of our population: analyzing in the same time different type of cancer and different treatment lines could bring us to misestimate results. In contrast of that,Table 1shows that patients’ features among patients with positive and negative FHC (ECOG-PS, age, primary tumor, number of metastases and line of immunotherapy) are well balanced in two subgroups. Even if TTF is a composite end point, influenced by factors unrelated to efficacy, in our opinion it better fits to our population, which came from clinical practice and had a spurious nature. We must further cite the lack of centralized imaging revision, and of a discussion about possible implications of previous/subsequent systemic treatments, which will be better analyzed in the future development of the study. As we said in the introduction, probably most of the genetic and molecular mechanisms that underlie inherited susceptibility to cancer are still unknown; in a similar way we still have not understand the mechanisms that allow some patients to benefit from immunotherapies more than others. For these reasons, the aim of this preliminary analysis is just to validate the hypothesis, deliberately without biomarkers assessment; our intention was to find a correlation between FHC and anti-PD1/PD-L1 therapy, “explaining from
afar a phenomenology that we are still not able to describe closely".
We have already planned to extend the study to other centers: with a bigger sample size and a longer follow-up, we could investigate the role of FHC, diagnosis of MN and EO of cancer in each type of primary tumor and in patients with homogeneous characteristics (e.g., second-line setting in NSCLC patients), planning a stratification for ‘burden’ of positive FHC. A tissue bank for biomarkers assessment will be included in the next phase of the
Table 3. Univariate and multivariate analysis data for time to treatment failure.
Univariate analysis – TTF
Variable (n) HR (95% CI) p-value
FHC – Positive (107) Negative (104) 0.61 (0.41–0.89) 0.0108* MN – Yes (32) – No (179) 0.86 (0.49–1.48) 0.5889 Onset – Early (21) – Non-early (190) 0.68 (0.38–1.19) 0.1798 Number of metastases –≤2 (112) –⬎2 (99) 1.48 (1.02–2.15) 0.0370* ECOG-PS – 0–1 (179) –≥2 (32) 3.23 (2.08–5.01) ⬍0.0001* Sex – Male (142) – Female (69) 1.58 (1.04–2.39) 0.0301* Treatment line – First (36) – Nonfirst (175) 1.04 (0.63–1.70) 0.8682 Multivariate analysis FHC 0.63 (0.43–0.93) 0.0203* ECOG-PS 3.16 (1.99–5.01) ⬍0.0001* Number of metastases 1.17 (0.79–1.73) 0.4127 Sex 1.48 (0.97–2.25) 0.0680
ECOG-PS: Eastern Cooperative Oncology Group Performance Status; FHC: Family history of cancer; MN: Multiple neoplasm; TTF: Time to treatment failure. *Statistically significant.
study. In case of confirmation of such interesting results, these evidences will deserve to be confirmed also in prospective trials.
Conclusion
In a scenario with lack of useful factors to make a proper selection among patients to treat or not with anti-PD-1/PD-L1 therapy, this pilot study seems to individuate easily available patient’s features as possible predictive surrogates of clinical benefit. These preliminary results need to be confirmed with a greater sample size, in order to extend the follow-up in each type of primary tumor. Assessment of FHC and MN should be preplanned in prospective trials with immunotherapy, to provide an external validation of their predictive role (Table 4).
Financial & competing interests disclosure
A Cortellini received honoraria as speaker at a scientific event from Boehringer Ingelheim. C Ficorella received honoraria for advisory role and as a speaker at scientific events from Sanofi and Pfizer. M Bersanelli received honoraria for advisory role and as speakers form Bristol-Myers Squibb, Pfizer and Novartis. S Buti received honoraria for advisory role and as a speaker from Bristol-Myers Squibb, Pfizer, Novartis and AstraZeneca, Roche and Merck, Sharp & Dohme. The authors have no other relevant affiliations or financial involvement with any organization or entity with a financial interest in or financial conflict with the subject matter or materials discussed in the manuscript apart from those disclosed.
No writing assistance was utilized in the production of this manuscript.
Informed consent disclosure
The authors state that they have obtained verbal and written informed consent from the patient/patients for the inclusion of their
60 70 40 20 30 50 80 90 100 0 5 10 15 20 25 30 Overall survival Survival probability (%)
Cox proportional hazard regression, family history of cancer HR = 0.60 (95% CI: 0.39–0.92) p = 0.221 60 70 40 20 10 30 50 80 90 100 0 5 10 15 20 25 30 Overall survival Survival probability (%)
Cox proportional hazard regression, age at diagnosis HR = 0.51 (95% CI: 0.28–0.92)
p = 0.0269 Family history of cancer
Negative Positive Age at diagnosis Early onset Non-early onset 60 70 40 30 50 80 90 100 0 5 10 15 20 25 30 Overall survival Survival probability (%)
Cox proportional hazard regression, sex HR = 0.51 (95% CI: 0.28–0.92)
p = 0.0272
Sex Female Male
Figure 7. Cox proportional hazard regression survival estimate for positive versus negative family history of cancer, early onset versus non-early onset of cancer and male versus female in multivariate analysis.
Open access
This work is licensed under the Creative Commons Attribution-NonCommercial 3.0 Unported License. To view a copy of this license, visithttp://creativecommons.org/licenses/by-nc-nd/3.0/
References
Papers of special note have been highlighted as:• of interest; •• of considerable interest
1. Taube JM, Klein A, Brahmer JR et al. Association of PD-1, PD-1 ligands, and other features of the tumor immune microenvironment with response to anti-PD-1 therapy. Clin. Cancer Res. 20(19), 5064–5074 (2014).
2. Rittmeyer A, Barlesi F, Waterkamp D et al. Atezolizumab versus docetaxel in patients with previously treated non-small-cell lung cancer (OAK), a Phase III, open-label, multicentre randomized controlled trial. Lancet 389, 255–265 (2017).
3. Kefford R, Ribas A, Hamid A et al. Clinical efficacy and correlation with tumor PD-L1 expression in patients with melanoma treated with the anti-PD-1 monoclonal antibody MK-3475. J. Clin. Oncol. 32(Suppl. abstr 3005), (2014).
4. Carbognin L, Pilotto S, Milella M et al. Differential activity of nivolumab, pembrolizumab and MPDL3280A according to the tumor expression of programmed death-ligand-1 (PD-L1), sensitivity analysis of trials in melanoma, lung and genitourinary cancers. PLoS
One 10(6), Article IDe0130142 (2015).
Table 4. Univariate and multivariate analysis data for overall survival.
Univariate analysis – OS
Variable (n) HR (95% CI) p-value
FHC Positive (107) Negative (104) 0.60 (0.39–0.92) 0.0192* MN Yes (32) No (179) 0.89 (0.48–1.63) 0.7090 Onset Early (21) Non-early (190) 0.52 (0.29–0.93) 0.0293* Number of metastases ≤2 (112) ⬎2 (99) 1.70 (1.12–2.59) 0.0127* ECOG-PS 0-1 (179) ≥ 2 (32) 4.18 (2.62–6.66) ⬍0.0001* Sex Male (142) Female (69) 2.01 (1.23–3.29) 0.0051* Treatment Line First (36) Non-first (175) 1.14 (0.64–2.02) 0.6498 Multivariate analysis FHC 0.60 (0.39–0.92) 0.0221* ECOG-PS 3.74 (2.26–6.20) ⬍0.0001* Number of metastases 1.24 (0.79–1.96) 0.3392 Sex 1.75 (1.06–2.88) 0.0272* Onset 0.51 (0.28–0.92) 0.0268*
ECOG-PS: Eastern Cooperative Oncology Group Performance Status; FHC: Family history of cancer; MN: Multiple neoplasm; OS: Overall surival. *Statistically significant.
5. Muro K, Bang Y, Shankaran V et al. Relationship between PD-L1 expression and clinical outcomes in patients (Pts) with advanced gastric cancer treated with the anti-PD-1 monoclonal antibody pembrolizumab (Pembro; MK-3475) in KEYNOTE- 012. J. Clin.
Oncol. 33(Suppl. abstr 3), 3–3 (2015).
6. Hirsch FR, McElhinny A, Stanforth D et al. PDL1 immunohistochemistry assays for lung cancer: results from Phase 1 of the ‘Blueprint PD-L1 IHC Assay Comparison Project’. J. Thorac. Oncol. 12(2), 208–222 (2016).
7. Neuman T, London M, Kania-Almog J et al. A harmonization study for the use of 22C3 PD-L1 immunohistochemical staining on ventana’s platform. J. Thorac. Oncol. 11(11), 1863–1868 (2016).
8. Scheel AH, Baenfer G, Baretton G et al. Interlaboratory-concordance of PD-L1 immunohistochemistry for non-small cell lung cancer. Histopathology. (2017) doi:10.1111/his.13375 (Epub ahead of print).
9. Marchetti A, Barberis M, Franco R et al. Multicenter comparison of 22C3 PharmDx (Agilent) and SP263 (Ventana) assays to test PD-L1 expression for NSCLC patients to be treated with immune checkpoint inhibitors. J. Thorac. Oncol. S1556–0864(17), 30662–30667 (2017).
• Evidence of unreliability of PD-L1 immunohistochemistry assessment in every patient.
10. Madore J, Vilain RE, Menzies M et al. PD-L1 expression in melanoma shows marked heterogeneity within and between patients: implications for anti-PD-1/PD-L1 clinical trials. Pigment Cell Melanoma Res. 28(3), 245–253 (2015).
11. Mitchell P, Murone C, Asadi K et al. PD-L1 expression in NSCLC: analysis of a large early stage cohort: and concordance of expression in primary, node and metastasis. J. Thorac. Oncol. 10(9, Suppl.2 S199 abstr) (2015).
12. Gainor JF, Sequist LV, Shaw AT et al. Clinical correlation and frequency of programmed death ligand-1 (PD-L1) expression in EGFR-mutant and ALK-rearranged non-small cell lung cancer (NSCLC). J. Clin. Oncol. 33(Suppl. abstr 8012) (2015).
13. Reck M, Rodr´ıguez-Abreu D, Robinson AG et al. Pembrolizumab versus chemotherapy for PD-L1–positive non-small-cell lung cancer.
N. Engl. J. Med. 375, 1823–1833 (2016).
14. Rizvi NA, Hellmann MD, Snyder A. Mutational landscape determines sensitivity to PD-1 blockade in non-small cell lung cancer.
15. Champiat S, Fert´e C, Lebel-Binay S et al. Exomics and immunogenics: bridging mutational load and immune checkpoints efficacy.
Oncoimmunology 3(1), e27817 (2014).
16. Campesato LF, Barroso-Sousa R, Jimenez L et al. Comprehensive cancer-gene panels can be used to estimate mutational load and predict clinical benefit to PD-1 blockade in clinical practice. Oncotarget 6(33), 34221–34227 (2015).
17. Le DT, Uram JN, Wang H et al. PD-1 blockade in tumors with mismatch-repair deficiency. N. Engl. J. Med. 372, 2509–2520 (2015). •• First evidence of efficacy of anti-PD-1 therapy in microsatellite instability-deficient patients.
18. Viale G, Trapani D, Curigliano G. Mismatch repair deficiency as a predictive biomarker for immunotherapy efficacy. Biomed. Res.
Int. 2017, 4719194. (2017).
19. Strickland KC, Howitt BE, Shukla SA et al. Association and prognostic significance of BRCA1/2-mutation status with neoantigen load,
number of tumor-infiltrating lymphocytes and expression of PD-1/PD-L1 in high grade serous ovarian cancer. Oncotarget 7(12), 13587–13598 (2016).
•• Evidence of immune-sensitive phenotype in BRCA 1/2 mutated tumors.
20. Pembrolizumab in advanced BRCA-mutated breast cancer. (2017). https://clinicaltrials.gov/ct2/show/NCT03025035
21. Dite GS, Jenkins MA, Southey MC et al. Familial risks, early onset breast cancer and BRCA1 and BRCA2 germline mutations. J. Natl
Cancer Instit. 95(6), 448–457 (2003).
22. Kharazmi E, Fallah M, Sundquist K et al. Familial risk of early and late onset cancer: nationwide prospective cohort study. BMJ 345, e8076. (2012).
23. Stigliano V, Sanchez-Mete L, Martayan A et al. Early onset colorectal cancer: a sporadic or inherited disease? World J.
Gastroenterol. 20(35), 12420–12430 (2014).
24. Wolchok JD, Hoos A, O’Day S et al. Guidelines for the evaluation of immune therapy activity in solid tumors: immune-related response criteria. Clin. Cancer. Res. 15(23), 7412–7420 (2009).
25. Mantel N. Chi-square tests with one degree of freedom: extensions of the Mendel-Haenszel procedure. J. Am. Stat. Assoc. 58, 690–700 (1963).
26. Fisher RA. On the interpretation ofχ2 from contingency tables, and the calculation of P. J. Royal Stat. Soc. 85(1), 87–94 (1992).
27. Mosteller F. Association and estimation in contingency tables. J. Am. Stat. Assoc. 63(321), 1–28 (1968).
28. Hosmer DW Jr, Lemeshow S. Sturdivant RX Applied Logistic Regression. Third Edition. John Wiley & Sons, NJ, USA (2013).
29. Kaplan EL, Meier P. Nonparametric estimation of incomplete observations. J. Am. Stat. Assoc. 53, 457–481 (1958).
30. Schemper M, Smith TL. A note on quantifying follow-up in studies of failure time. Control. Clin. Trials 17, 343–346 (1997).
31. Cox DR. Regression models and life tables (with discussion). J. Royal Statis. Soc. (Series B) 74, 187–200 (1972).
32. International Rules for Multiple Primary Cancers ICD-O Third Edition. Internal Report No.2004/02. Lyon: International Agency for Research on Cancer. IARC (2004).
33. Cassidy A, Myles JP, Duffy SW et al. Family history and risk of lung cancer: age-at-diagnosis in cases and first-degree relatives. Br. J.
Cancer 95(9), 1288–1290 (2006).
34. Such B, Vourganti S, Ricketts CJ et al. Defining early onset kidney cancer: implications for germline and somatic mutation testing and clinical management. J. Clin. Oncol. 32(5), 431–7 (2014).
35. Madrid Garc´ıa FJ, Parra Muntaner L, Rivas Escudero JA et al. Transitional cell bladder carcinoma in patients younger than 40 years of age. Arch. Esp. Urol. 51(10), 991–994 (1998).
36. Iori F, De Dominicis C, Liberti M et al. Superficial bladder tumors in patients under 40 years of age: clinical, prognostic and cytogenetic aspects. Urol. Int. 67(3), 224–7 (2001).
37. Blanchard JM, Graziana JP, Bonnal JL et al. Bladder tumor in young patients: a series of 26 cases. Comparison with a review of literature. Prog. Urol. 13(2), 227–233 (2003).
38. Purdue MP, Freeman LE, Anderson WF et al. Recent trends in incidence of cutaneous melanoma among US Caucasian young adults. J.
Invest. Dermatol. 128(12), 2905–2908 (2008).
39. Weir HK, Marret LD, Cokkinides V et al. Melanoma in adolescents and young adults (ages 15–39 years), United States, 1999–2006. J.
Am. Acad. Dermatol. 65(5 Suppl. 1), S38–S49 (2011).
40. Yeo H, Betel D, Abelson JS et al. Early onset colorectal cancer is distinct from traditional colorectal cancer. Clin. Colorectal Cancer 16(4), 293–299.e6 (2017).
41. Majchrzak E, Szybiak B, Wegner A et al. Oral cavity and oropharyngeal squamous cell carcinoma in young adults: a review of the literature. Radiol. Oncol. 48(1), 1–10 (2014).
42. Garcia B, Lage A. Immunosenescence: implications for cancer immunotherapy in elderly patients. Biotecnol. Apl. 23(3), 194–201 (2006).
43. Ferrara R, Mezquita L, Auclin E et al. Immunosenescence and immunecheckpoint inhibitors in non-small cell lung cancer patients: does age really matter? Cancer. Treat. Rev. 24(60), 60–68 (2017).
44. Mirandola L, Wade R, Verma R et al. Sex-driven differences in immunological responses: challenges and opportunities for the immunotherapies of the third millennium. Int. Rev. Immunol. 34(2), 134–142 (2015).