https://doi.org/10.1007/s11547-018-0895-2
CARDIAC RADIOLOGY
Grading of aortic stenosis severity: a head‑to‑head comparison
between cardiac magnetic resonance imaging and echocardiography
Cesare Mantini1 · Gabriele Di Giammarco2 · Jacopo Pizzicannella3 · Sabina Gallina3 · Fabrizio Ricci3 · Emilia D’Ugo3 ·
Marziale Marchetti3 · Antonio Raffaele Cotroneo1 · Nauman Ahmed4,5 · Chiara Bucciarelli‑Ducci4,5,6 ·
Armando Tartaro1 · Raffaele De Caterina3
Received: 5 September 2017 / Accepted: 20 April 2018 / Published online: 5 May 2018 © Italian Society of Medical Radiology 2018
Abstract
Aim To prospectively evaluate the accuracy of cardiac magnetic resonance (cMR) imaging for the assessment of aortic valve effective orifice area (EOA) by continuity equation and anatomical aortic valve area (AVA) by direct planimetry, as compared with transthoracic (TTE) and transesophageal (TEE) two-dimensional (2D) echocardiography, respectively.
Methods and results A total of 31 patients (21 men, 10 women, mean age 69 ± 10 years) with moderate-to-severe aortic stenosis (AS) diagnosed by TTE and scheduled for elective aortic valve replacement, underwent both cMR and TEE. AVA by cMR was obtained from balanced steady-state free-precession cine-images. EOA was computed from phase-contrast MR flow analysis. AVA at cMR (0.93 ± 0.42 cm2) was highly correlated with TEE-derived planimetry (0.92 ± 0.32 cm2)
(concordance correlation coefficient, CCC = 0.85). By excluding 11 patients with extensively thickened and heavily calci-fied cusps, the CCC increased to 0.93. EOA at cMR (0.86 ± 0.30 cm2) showed a strong correlation with TTE-derived EOA
(0.78 ± 0.25 cm2) (CCC = 0.82).
Conclusions cMR imaging is an accurate alternative for the grading of AS severity. Its use may be recommended especially in patients with poor transthoracic acoustic windows and/or in case of discordance between 2D echocardiographic parameters.
Keywords Aortic stenosis · Aortic valve area · Transesophageal echocardiography · Cardiac magnetic resonance imaging
Abbreviations
AVA Aortic valve area AS Aortic valve stenosis EOA Effective orifice area CMR Cardiac magnetic resonance TTE Transthoracic echocardiography TEE Transesophageal echocardiography CT Computed tomography
bSSFP Balanced steady-state free precession PC Phase-contrast
VENC Encoding velocity
CCC Concordance correlation coefficient LVEF Left ventricular ejection fraction LVOT Left ventricular outflow tract
LVOTCSA Left ventricular outflow tract cross-sectional area
VTI Velocity time integral V Peak jet velocity VAO Peak aortic jet velocity
VLVOT Peak left ventricular outflow tract jet velocity SV Stroke volume
Introduction
Degenerative aortic valve stenosis (AS) has become the most common valvular heart disease in developed countries, and its prevalence is expected to increase due to aging of the population [1]. The most common cause of AS in adults is the calcification of trileaflet or congenital bicuspid valve apparatus.
In patients with AS, the precise determination of dis-ease severity is of utmost importance for its management and therapeutic decision-making [2–5]. Given that AS should be intended as a disease continuum and no single
Electronic supplementary material The online version of this article (https ://doi.org/10.1007/s1154 7-018-0895-2) contains supplementary material, which is available to authorized users. * Raffaele De Caterina
parameter alone should define severity, grading of AS is usually performed on the basis of a spectrum of non-inva-sive hemodynamic measurements, i.e., peak aortic jet veloc-ity, mean pressure gradient, and aortic valve area (AVA). Particularly, aortic valve effective orifice area (EOA) and mean transvalvular pressure gradient (MPG) evaluation are the cornerstone of AS assessment [5]. Current ACC/AHA [5] and ESC [4] guidelines recommend EOA < 1.0 cm2
and MPG > 40 mmHg as the main criteria to define severe AS. Although the invasive quantification of AS severity by catheter-based hemodynamic techniques has been proposed as the gold standard for the grading of AS severity, it is rarely performed today because it is time-consuming, costly, and entailing substantial risk. In addition, it is well known that the use of the Gorlin equation to estimate the AVA is associated with several sources of error, as being directly influenced by cardiac output, blood viscosity, and flow turbulence [6]. Further, the original purpose of the Gorlin equation was to give an estimate of the anatomical AVA, but “what our eyes see is not necessarily what our heart feels”, and EOA by continuity equation better represents the hemodynamic burden caused by the stenosis. Also, similar AVA geometries may lead to different EOA, accounting for a non-trivial percentage of AS misclassifications. In daily clinical practice, transthoracic echocardiography (TTE) is the recommended imaging modality for the initial assess-ment of suspected aortic valve disease and for the evaluation of EOA and AVA (class I, Level of Evidence: B) [4, 5, 7].
Assessment of anatomical AVA by direct planimetry (AVApl) of the valve orifice is often necessary in question-able cases—importantly when assessment of EOA is unre-liable due to poor transthoracic acoustic windows and/or suboptimal Doppler angle alignment with flow direction— and this is usually done by transesophageal echocardiogra-phy (TEE), or—more recently—by cardiac magnetic reso-nance (CMR). MR planimetry does not rely on blood flow velocity quantification, pressure gradients or geometrical assumptions, thus, CMR may provide valuable information, especially in patients with reduced cardiac output or other
conditions affecting measured parameters [8]. CMR may also be used to assess the functional degree of AS severity, by using velocity-dependent analyses based on the continu-ity equation [9].
To date, only few studies have been performed to evalu-ate the accuracy of CMR for planimetric and continuity equation measurements of AVA in comparison with TTE and TEE. Therefore, in the present two-center study we performed a direct comparison between planimetric and continuity equation measurements of AVA as assessed by CMR, TTE and TEE, in a series of patients undergoing valve surgery, and examined inter-modalities diagnostic agreement and precision.
Methods
Patient population
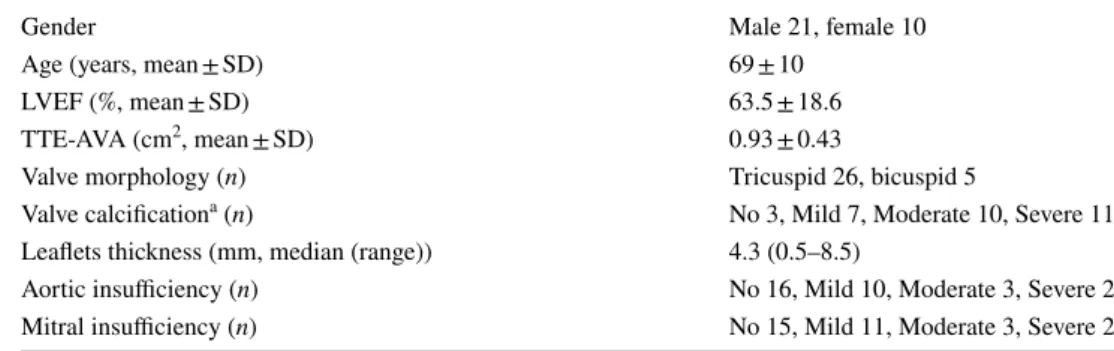
This is a retrospective observational study with a two-site— Chieti, Italy and Bristol, UK—enrollment of 31 consecutive patients (21 men, 10 women, mean age 69 ± 10 years, 20 in Chieti, 11 in Bristol) with symptomatic moderate-to-severe aortic valve stenosis first assessed by TTE, and scheduled for elective aortic valve replacement. Demographic, anatomic and hemodynamic data, as well as clinical presentation of patients studied are summarized in Table 1.
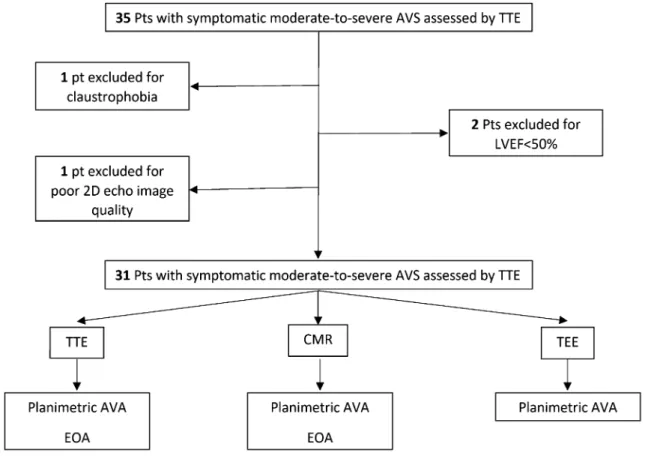
Exclusion criteria were: LVEF < 50%, more than mild mitral valve disease or aortic regurgitation, dynamic LVOT obstruction, hemodynamic instability, rapid uncontrolled arrhythmia, New York Heart Association (NYHA) class IV, or any contraindication to CMR (pacemaker or severe claustrophobia), and poor 2D echocardiography image qual-ity (Fig. 1).
Protocol
Patients were imaged with standardized TTE, TEE and CMR. In all patients, TTE, TEE and CMR were performed
Table 1 Demographic, anatomic and hemodynamic data of the study population
SD standard deviation, LVEF left ventricular ejection fraction, TTE-AVA transthoracic echocardiography-aortic valve area
a Grading according Rosenhek et al. (Online Supplement Ref. 4)
Gender Male 21, female 10
Age (years, mean ± SD) 69 ± 10
LVEF (%, mean ± SD) 63.5 ± 18.6
TTE-AVA (cm2, mean ± SD) 0.93 ± 0.43
Valve morphology (n) Tricuspid 26, bicuspid 5
Valve calcificationa (n) No 3, Mild 7, Moderate 10, Severe 11
Leaflets thickness (mm, median (range)) 4.3 (0.5–8.5)
Aortic insufficiency (n) No 16, Mild 10, Moderate 3, Severe 2
according to established and standardized protocols by qual-ified observers aware of patients’ medical history, suspected underlying disease and major comorbidities, but who were blinded to the results of other examinations. All examina-tions in the same patient had to be performed within a time interval of 7 days. Imaging and acquisition protocols were in agreement with recommendations from the Society for Cardiovascular Magnetic Resonance Board of Trustees Task Force on Standardized Protocols [10] and with the American Society of Echocardiography Recommendations for Quality Echocardiography Laboratory Operations [11]. Being this a retrospective analysis of data acquired for clinical purposes, approval by the local Ethics Committee was not necessary and was not sought. Patient’s informed consent for the per-formance of the here-reported diagnostic examinations was obtained from all individual participants included in the study.
Transthoracic Doppler echocardiography (TTE) TTE was performed using conventional ultrasound sys-tems (Philips Sonos 5500 and Philips iE33 X5-1, Philips
Healthcare, Best, the Netherlands) attached to 1–5 MHz transducers. Details of the methods here used are provided in the Online Supplemental Material.
Transesophageal echocardiography (TEE)
2D-TEE was performed using conventional ultrasound sys-tems (Philips Sonos 5500 and Philips iE33 X7-2t) attached to 2–7 MHz transducers. AVA assessment by direct plani-metry was obtained from the mid-esophageal aortic valve short-axis view. After the TEE probe was positioned in the esophagus at the level of the aortic valve, the trans-ducer was rotated from 0° to 30°–45° to obtain a short-axis cross-sectional view of the aortic valve. After selecting one frame, in which the maximum aortic valve opening was observed, with fine adjustments of the cutting plane to delineate the smallest aortic valve orifice, the inner bor-ders of the valve leaflets were traced manually using a magnified view to measure the AVA. Calcifications were considered as part of the cusp tissue. Final measurements were averaged in at least 3 cardiac cycles.
Fig. 1 Study population flowchart. Pts patients, LVEF left ventricular ejection fraction, TTE transthoracic echocardiography, CMR cardiac mag-netic resonance, TEE transesophageal echocardiography, AVA aortic valve area, EOA effective orifice area
CMR imaging
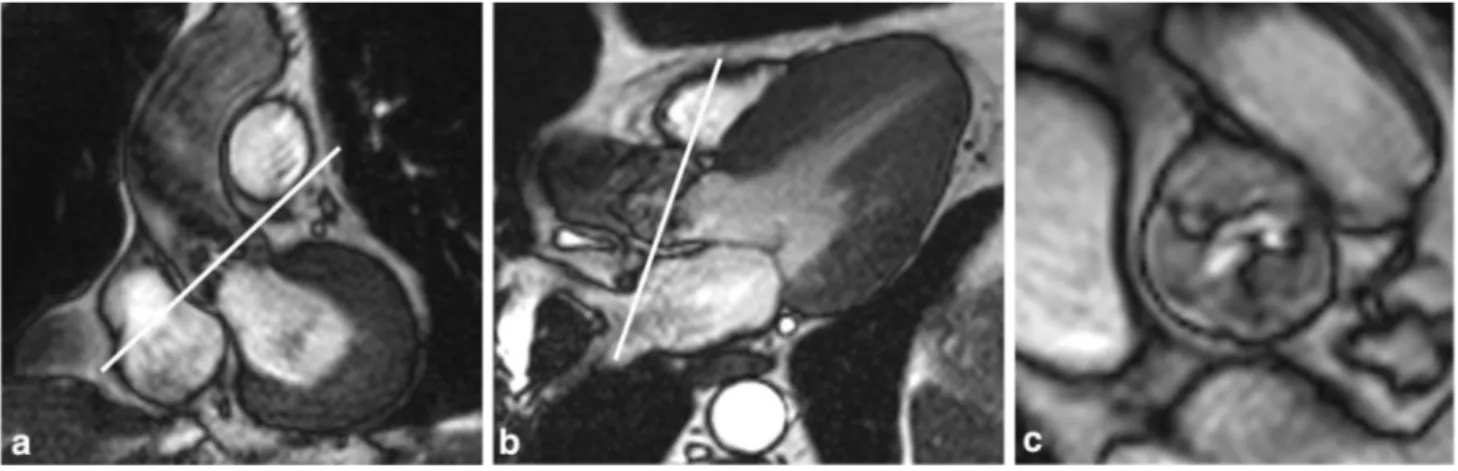
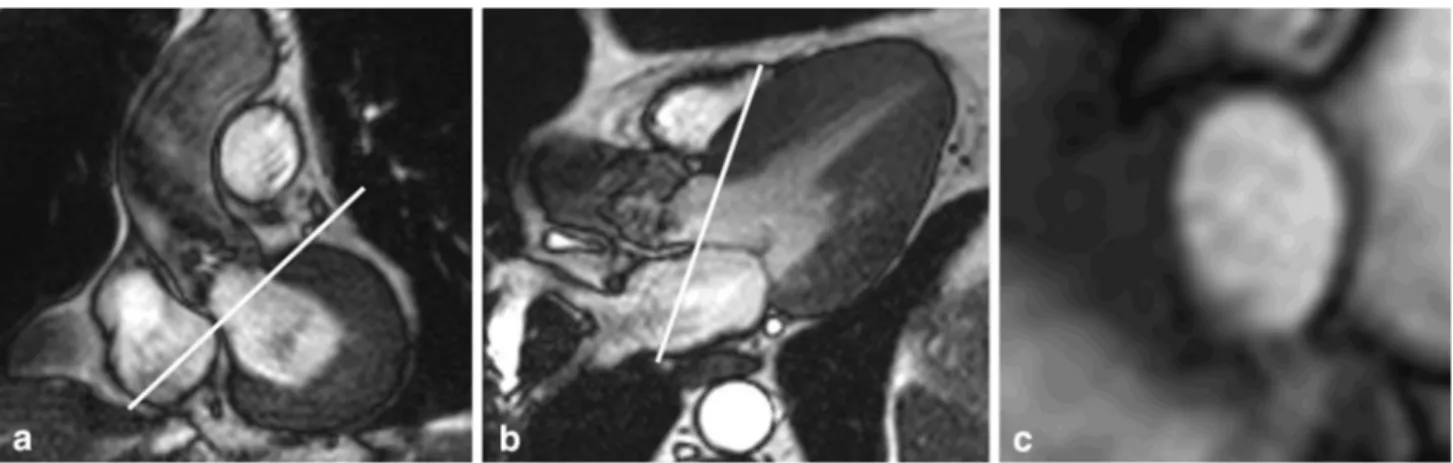
CMR imaging was performed on 1.5 Tesla MR scanners (Achieva; Philips Medical System, Best, the Netherlands, for the Chieti patients; and Avanto, Siemens, Enlargen, Germany, for the Bristol patients), each using a dedicated 8-element phased-array cardiac synergy coil for signal reception. After localization of the heart using three-plane and oblique survey images, cine-imaging was performed with a balanced steady-state free-precession (bSSFP) technique at 30 phases per cardiac cycle (by vectorcar-diographic gating) in 8–14 parallel short axis, and two chamber and four chamber (8 mm thickness, 0 mm gap). A three-chamber view (for the LVOT) and an oblique coronal view cine-image (for the aortic outflow tract of the left ventricle) were also acquired. These images were used as localizers to plan 4 contiguous cross-sectional cine-images of the aortic valve between the outflow tract and the level of the valve tips (Fig. 2). Cine-images were acquired using a multislice cine-bSSFP pulse sequence with retrospective gating during multiple breath holds. Typical parameters of aortic valve cross-sectional cine-images included slice thickness of 6 mm, gap of − 1 mm, TR/TE of 3.4/1.2 ms, flip angle 40°, number of excita-tions (NEX) = 1, yielding an in-plane spatial resolution of 1.4 mm × 1.4 mm. Subsequently, for the quantitative flow measurements, 2 through-plane breath-hold phase-contrast (sQFlow) images were planned using the high-resolution cine-images (slice thickness of 8 mm) and acquired in an axial plane in the LVOT at 10 mm below the aortic valve annulus (reference: 0 mm) and in the ascending aorta 10 mm above the annulus. MR (VTI and V) data acquired at this level are most strongly correlated with the ultra-sound measures (VTI and V) in the LVOT and at the aor-tic valve [12, 13]. Phase-contrast MR imaging parameters
consisted of TR/TE of 4.60–4.92/2.76–3.05 ms, flip angle 15°, 24 phases, pixel spacing 1.32–2.07 mm, slice thick-ness 10 mm and acquisition matrix of 256 × 208. Each phase-contrast velocity mapping acquisition produced 2 images: one magnitude image and one phase image. For each patient, peak aortic jet velocity measured by TTE was used to define CMR encoding velocity (CMR veloc-ity encoding (VENC) = (1.25–1.5) × peak jet velocveloc-ity) to optimally define resolution. Velocities were assessed with ‘through-plane’ velocity mapping above the aortic valve plane. Importantly, our phase mapping protocol included preliminary in-plane phase-contrast (PC) analysis aimed at imaging transaortic flow direction and to assist in plan-ning the appropriate location of subsequent perpendicular ‘through-plane’ slabs [14]. Typically, the maximum VENC was 2 m/s for the LVOT and 6 m/s in the aorta. However, in case of aliasing, flow images were reacquired in steps of 50 cm/s. As the first VENC range is subjectively set depending on the expected velocity of the jet and in order to speed up the scouting process, we ran flow mapping by selecting the VENC range based on transvalvular aortic peak velocity as measured by CW Doppler on TTE. In each of the 2 participating centers, all measurements were independently taken in duplicate by two observers blinded to clinical, TTE and TEE results. Cardiac MR planimetry of the valvular orifice was performed by precisely delineat-ing the inner edges of maximum systolic opendelineat-ing of the aortic cusps. EOA was computed from phase-contrast MR images using the simplified continuity equation [15, 16]. For this purpose, regions of interest (ROIs) were drawn on each of the 24 phases of magnitude images to include the lumen of the LVOT (10 mm below the aortic valve annu-lus) and of the aorta (10 mm above the annuannu-lus), and peak velocities were computed (V). LVOTCSA was measured
on the through-plane phase-contrast images acquired at
Fig. 2 Slice positioning for planimetry of the aortic valve at cardiac magnetic resonance (CMR). Oblique coronal (a) and three-chamber long-axis view (b) of the aortic outflow tract with slice position for
planimetry indicated by white lines parallel to the aortic annulus. Cross-sectional bSSFP image (c) shows a stenotic tricuspid valve
10 mm below the aortic valve annulus, manually delineat-ing the inner borders of the LVOT lumen. AVA was then calculated with the following formula:
For each modality, the valve opening was judged to be mod-erately stenotic (1.0 < AVA > 1.5 cm2), or severely stenotic
(AVA < 1.0 cm2). In addition, for each modality, the valve
morphology was defined by two reviewers, in consensus, as bicuspid or tricuspid.
Statistical analysis
Normal distribution was described as mean, standard devia-tion (SD) or 95% confidence interval (CI). Linear regression analysis was performed to describe correlations between the different techniques. Agreements between different methods were explored using Lin’s concordance correlation coeffi-cient (CCC) and with the Bland–Altman analysis [17]. The CCC (ccc/rho_c/ρc) combines measures of precision and accuracy for agreement on continuous variables. The CCC is the product of the Pearson correlation coefficient (r) by a bias correction factor (Cb) coefficient. The Pearson correla-tion coefficient measures how far each observacorrela-tion deviates from the best-fit line and is a measure of precision; bias correction factor measures how far the best-fit line deviates from the 45° line through the origin and is a measure of accuracy. This coefficient ranges from zero (no agreement) to one (perfect agreement), without categorized levels for CCC values. For descriptive reasons, we here arbitrarily chose four categories for correlation: high (ρc ≥ 0.8), good (0.7 ≤ ρc < 0.8), fair (0.6 ≤ ρc < 0.7) and poor (ρc < 0.6). We used Bland–Altman plots to graphically represent results obtained by two methods of measurement, which is useful to estimate and represent measurement errors graphically.
Results
Patient characteristics and study protocol
One patient was excluded from the study because of severe claustrophobia, two for LVEF < 50% and one for poor 2D echocardiography image quality (Fig. 1). AVA, as assessed by CMR, ranged from 0.4 to 1.5 cm2 (0.93 ± 0.42 cm2).
Twenty-four (77.5%) patients were classified by CMR as affected by severe AS, with AVA ≤ 1.0 cm2. Of these, 8
(32.2%) patients had critical AS, with an AVA ≤ 0.75 cm2.
Out of 31 patients, 5 had bicuspid aortic valve disease, 24 “degenerative” AS and 2 rheumatic aortic valve disease. A total of 11 patients (all of whom with an AVA < 1.2 cm2)
AVA = ALVOT⋅
( VLVOT
VAO
)
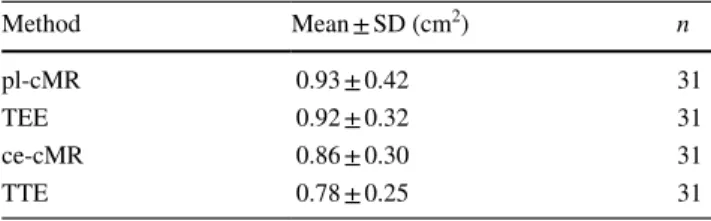
had grade 3 (moderate) or 4 (severe) calcifications on TTE. Mean values of AVA by the different methods are used, and concordance correlation coefficients are summarized in Tables 2 and 3, respectively.
Planimetric AVAs by CMR and TEE
Image quality of short-axis cine-CMR and TEE images through the aortic valve was uniformly estimated as good according to guideline criteria and allowed successful plani-metry of AVA in all 31 patients.
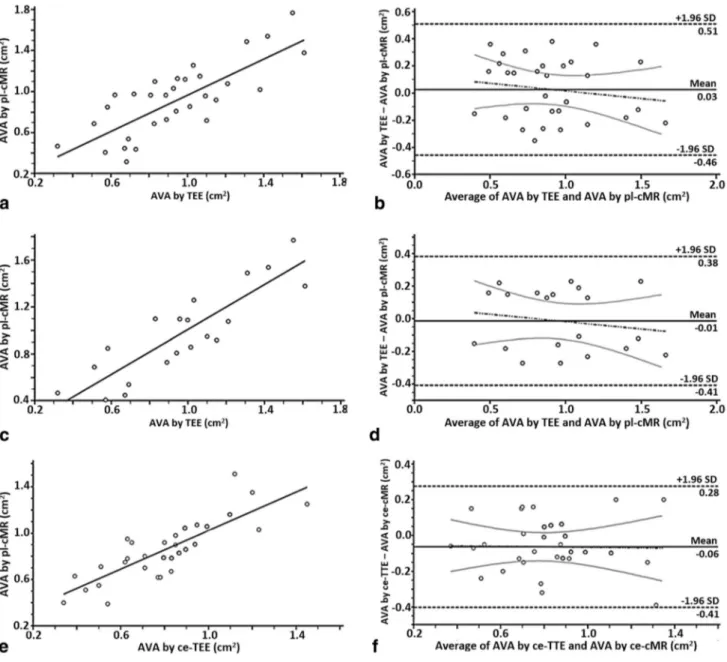
As shown in Fig. 3a, b, CMR planimetry (0.93 ± 0.42 cm2)
correlated highly with TEE planimetry (0.92 ± 0.32 cm2),
with a CCC of 0.85 (CI 95% 0.75–0.91). Excluding patients with moderately calcified (score 3) and extensive thickening and heavy calcification of all cusps (score 4) (Fig. 3c, d), the CCC increased to 0.93 (CI 95% 0.86–0.96).
Simplified continuity equation‑derived EOAs by CMR and TTE
Measurements of the LVOT area by CMR were feasible in all 31 patients. As shown in Fig. 3e, f, EOA measured by continuity equation CMR (0.86 ± 0.30 cm2) was very Table 2 Mean values of AVA by the different methods investigated in this study
AVA aortic valve area, SD standard deviation, pl-cMR planimetry by cardiac magnetic resonance, TEE transesophageal echocardiography, ce-cMR continuity equation by cardiac magnetic resonance, TTE tran-sthoracic echocardiography Method Mean ± SD (cm2) n pl-cMR 0.93 ± 0.42 31 TEE 0.92 ± 0.32 31 ce-cMR 0.86 ± 0.30 31 TTE 0.78 ± 0.25 31
Table 3 Concordance correlation coefficients between the different methods investigated in this study
CCC concordance correlation coefficient, CI confidence interval, pl-cMR planimetry by cardiac magnetic resonance, TEE transesophageal echocardiography, ce-cMR continuity equation by cardiac magnetic resonance, TTE transthoracic echocardiography
Methods compared CCC
pl-cMR and TEE 0.85 (95% CI 0.75–0.91)
Excluding patients with heavily calcified
valve 0.93 (95% CI 0.86–0.96)
ce-cMR and TEE 0.79 (95% CI 0.63–0.89)
ce-cMR and TTE 0.82 (95% CI 0.68–0.90)
pl-cMR and TTE 0.70 (95% CI 0.47–0.83)
similar to TTE-derived EOA (0.78 ± 0.25 cm2) with a CCC
of 0.82 (CI 95% 0.68–0.90). LVOT cross-sectional area obtained by TTE (3.3 ± 0.8 cm2) resulted to be smaller
than the area obtained by CMR (3.8 ± 0.7 cm2), with a
CCC = 0.71. Cardiac MR revealed that the LVOT shape was oval in the vast majority of patients (Fig. 4).
Comparison of planimetric AVA and continuity equation‑derived EOAs
There was a good correlation between planimetric (both CMR and TEE-derived) AVAs and continuity equa-tion-derived EOAs (by CMR and TTE). Planimetric
Fig. 3 Statistical analysis of concordance between measurements per-formed. Linear regression (a) and Bland–Altman analysis (b) illus-trating the agreement between AVA assessed by planimetric meas-urements (CMR and TEE). Linear regression (c) and Bland–Altman analysis (d) illustrating the agreement between AVA assessed by planimetric measurements after exclusion of patients with extensive
thickening and heavy calcification of all cusps. Linear regression (e) and Bland–Altman analysis (f) illustrating the agreement between EOA assessed by simplified continuity equation (CMR and TTE). AVA aortic valve area, CMR cardiac magnetic resonance, EOA effec-tive orifice area, TEE transesophageal echocardiography
measurements by CMR (0.93 ± 0.42 cm2) and TEE
(0.92 ± 0.32 cm2) turned out to be significantly higher
than corresponding values obtained with the continuity equation by CMR (0.86 ± 0.30 cm2; p < 0.05) and TTE
(0.78 ± 0.25 cm2; p < 0.001).
Comparison of bicuspid and tricuspid AVA
After the exclusion of 5 patients with bicuspid aortic valve, we observed no statistically significant differences in terms of CCC both between planimetric AVA at CMR and the same parameter at TEE (0.89 vs 0.85) and EOA at CMR and TTE (0.83 vs 0.82).
The analysis restricted to the few (n = 5) patients with bicuspid aortic valve also revealed no statistically significant differences in terms of CCC both between planimetric AVA at CMR and TEE (0.79 vs 0.85) and EOA at CMR and TTE (0.78 vs 0.82).
Reproducibility
TTE and TEE measurements of the EOA and AVA were both repeated twice by the same observer 2 weeks after the first measurement. Both methods had similarly high intra-observer reproducibility (CCC = 0.90 and 0.92, respec-tively). Cardiac MR measurements were repeated twice immediately after the examination by one single observer. To investigate the inter-observer variability of CMR meas-urements, a second observer performed the measurements offline, blinded to the results of the first observer. CMR planimetry intra- and inter-observer reproducibility was excellent (CCC = 0.94 and 0.91, respectively). Intra- and inter-observer reproducibility of EOA was also excellent (CCC = 0.92 and 0.90, respectively).
Discussion
We here demonstrate the overall high concordance of meas-urements of aortic valve areas with a totally noninvasive technique, CMR, using both planimetry and continuity equa-tion, as compared with evaluations derived by 2D echocardi-ography. Also, we here demonstrate the increased agreement of CMR-derived planimetry after excluding patients with thickened and moderately/heavy calcified valves, which is one limitation to bear in mind when performing CMR analy-ses. In such cases, the continuity equation-derived evaluation appears to be the strategy of choice for CMR in grading the severity of isolated AS.
Echocardiographic assessment of AS severity by use of the simplified continuity equation or planimetry The 2D transesophageal planimetric method is known to be more accurate than the similar 2D transthoracic method. Although attractive, direct planimetry of the AVA by TEE is technically rather demanding. It indeed requires a precise positioning of the transducer to obtain the correct cross-sectional view at the level of the edges of the aortic cusps at their maximum opening, which can be quite challenging due to the aortic root anterior and superior movement during the cardiac cycle. Also, an accurate delineation of the leaflet edges can be difficult in cases of severely calcified leaflets. Currently, the preferred noninvasive method for grading AS severity is Doppler echocardiography with the use of the continuity equation [5]. Based on this principle, to calculate the EOA one needs to perform 3 measurements: the VTI of the LV outflow tract using PW Doppler, the VTI through the aortic valve using CW Doppler, and the cross-sectional area of the LVOT, which is calculated from the measured LVOT diameter by assuming a circular shape. Calculation
Fig. 4 Measurements of LVOT cross-sectional area. Slice position-ing for LVOT cross-section area measurements by CMR sequences acquired in a short-axis plane 10 mm below the aortic valve annulus.
CMR revealed that LVOT has an oval and not circular shape. LVOT left ventricular outflow tract
of the EOA by using the simplified continuity equation has some disadvantages, as it may not be feasible in a significant proportion of patients due to poor acoustic window and/or subvalvular flow acceleration. Moreover, given that the cal-culation of AVA requires the inclusion of 3 measurements (the LVOT diameter, the LVOT peak velocity and the aor-tic peak velocity) in the simplified continuity equation, this method may involve relatively large measurement errors. The precise estimation of LVOT diameter is the most criti-cal parameter for an accurate estimation of the EOA and is difficult in patients with poor acoustic windows or severe calcifications of the aortic valve and of the outflow tract. TTE also assumes a circular shape of the LVOT and uses the smaller antero-posterior diameter to compute the LVOT area. In contrast, CMR imaging reveals that the LVOT shape is elliptical in the vast majority of patients (Fig. 4). In addition, measurement of the peak flow velocity in the LVOT may be distorted in patients with high or low left cardiac output or associated valvular insufficiency, because it is susceptible to changes in flow dynamics. Because of these limitations, the direct AVA planimetry has been pro-posed as an alternative method. Today, this is best achieved with the use of multiplane TEE [18, 19], which is, however, technically demanding for the aforementioned reasons. This highlights the important need for additional noninvasive and accurate methods for the fine assessment of stenosis severity in the presence of possible discordances between TTE-EOA measurements, transvalvular gradients, dimensionless veloc-ity ratio, and eventually clinical findings.
Assessment of AS severity by CMR
Because of the aforementioned limitations of echocardiogra-phy, several investigators have recently proposed to grade the severity of AS by using CMR. Indeed, with the introduction of SSFP, CMR allows high-quality cine-short-axis images of the aortic valve, and therefore to obtain accurate direct planimetry of its maximum opening area.
Several recent studies have compared the measurements of AVA obtained by this planimetric approach with those obtained by TEE. All such studies have demonstrated a good agreement between CMR and both echocardiographically derived planimetric AVA or EOA [12, 20–23]. Potential limitations of CMR planimetry are difficulties in the precise visualization of the aortic cusps due to partial volume effects, the presence of calcifications, or flow-related artefacts. SSFP sequences are generally preferred because of their superior signal-to-noise ratio, clear-cut blood-tissue contrast, and high spatial and temporal resolutions, making the accurate identifi-cation of the fast-moving valve cusps easier [24]. Indeed, von Knobelsdorff-Brenkenhoff et al. [25] have demonstrated that also CMR planimetry of aortic bioprosthetic orifice area cor-relates highly with data obtained by TTE (r = 0.82) and TEE
planimetry (r = 0.92) despite artefacts caused by the presence of surgical foreign bodies, such as sternal wires and the struts of stented prostheses.
As shown in Table 4, the agreement between CMR and TEE to assess native aortic valves in our study (CCC = 0.85) is as high as those reported by Debl et al. (r = 0.86) [23], John et al. (r = 0.96) [21] and Pouleur et al. (r = 0.98) [26]. However, an original aspect of our results is the increase in CCC (from 0.85 to 0.93) after the exclusion of patients with extensive thickening and moderate-to-severe calcification of the aortic valve apparatus (Rosenhek grade 3–4). This result highlights a potential limitation of the CMR planimetric techniques, as dif-fuse valvular calcifications may hamper the correct delineation of the leaflets and the estimation of the valve area.
Besides the direct planimetry of the aortic valve open-ing, CMR also allows the EOA calculation by use of the continuity equation. As with Doppler echocardiography, this requires the obtainment of 2 different sets of data, i.e., supra- and subvalvular flow velocity data, which can be obtained by the use of velocity-encoded phase-contrast images, and anatomical information on the dimensions of the LVOT, which requires multislice cine-imaging.
Multidetector computed tomography is a powerful imag-ing modality to measure dimensions, surfaces and volumes of cardiac chambers. However, this method does not allow measurement of flow velocities, thereby not permitting the determination of continuity equation-derived AVA. Conversely, CMR is a noninvasive, radiation-free imag-ing modality that allows the quantification of flow veloci-ties. Moreover, CMR has superior temporal resolution as compared with computed tomography. EOA measured by continuity equation—CMR and TTE—is well correlated, with a CCC of 0.82. Noticeably, the LVOT cross-sectional area obtained by TTE (3.3 ± 0.8 cm2) resulted to be smaller
than the area obtained by CMR (3.9 ± 0.7 cm2), with a CCC
of 0.71. Pouleur et al. reported that CMR yielded larger LVOT diameter values [25]. Unlike the studies by Pouleur et al. [26] and Paelinck et al. [27], we measured the LVOT area on the through-plane phase-contrast images acquired at 10 mm below the aortic valve annulus, manually delin-eating the inner borders of the LVOT lumen and not the LVOT diameter. Thanks to this method, we show that the LVOT cross-section is typically elliptical and not circular; as a consequence, TTE underestimates the LVOT area cal-culated assuming a circular geometry. This is in agreement with conclusions derived from 3D echocardiography [28] and from another comparison of TTE and CMR [29]. Planimetric AVA versus continuity equation‑derived EOA
We found a good correlation between planimetric AVA (both by CMR and TEE) and continuity equation-derived
EOAs (both by CMR and TTE). Planimetric measurements by CMR (0.93 ± 0.42 cm2) and TEE (0.92 ± 0.32 cm2)
turned out to be significantly higher than those obtained by continuity equation at CMR (0.86 ± 0.30 cm2; p < 0.05)
and TTE (0.78 ± 0.25 cm2; p < 0.001). Our results are
con-sistent with those of Pouleur et al.26, who reported that the
EOA values calculated by the continuity equation (TTE and CMR) were systematically slightly lower than the val-ues derived by planimetry (TEE and CMR). This observa-tion is not surprising, since direct planimetry reflects the anatomical orifice area, while the calculated EOA reflects the functional orifice area. The latter indeed reflects the cross-sectional area of the vena contracta of the transval-vular flow jet. The EOA is generally smaller than the AVA because there is a contraction of the flow downstream of the valve orifice (1–3).
Clinical implications
Despite different techniques are available for the grading of AS severity, a “gold standard” is still lacking, since all available techniques have their limitations. In TTE, inac-curate measurements can be related to a poor acoustic win-dow, extensive valvular calcifications and the assumption of a circular shape of LVOT. Likewise, the peak transval-vular velocity may be missed if the ultrasound beam is not directed parallel to the velocity jet. TEE is a semi-invasive method. Furthermore, in patients with heavily calcified aor-tic valves the exact delineation of the leaflets and the exact planimetry of the AVA are hampered. CMR overcomes most of the above-mentioned methodological limitations, espe-cially using SSFP white-blood sequences, which allow an accurate delineation of valvular structures and of the orifice
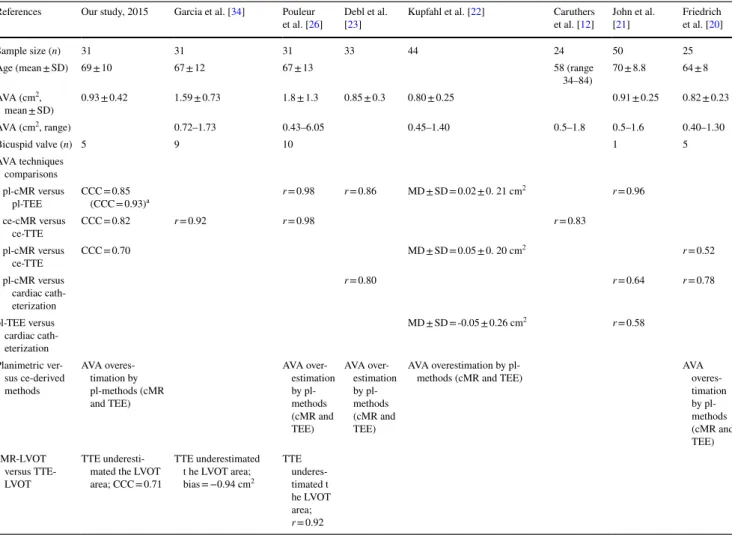
Table 4 Comparison of findings of the present studies with previous studies comparing performances of cMR with other techniques for the assessment of aortic stenosis
cMR cardiac magnetic resonance, SD standard deviation, AVA aortic valve area, pl-cMR planimetry by cardiac magnetic resonance, pl-TEE planimetry by transesophageal echocardiography, ce-cMR continuity equation by cardiac magnetic resonance, ce-TTE continuity equation by transthoracic echocardiography, CCC concordance correlation coefficient, MD mean difference, LVOT left ventricular outflow tract
a Excluding patients with extensive thickening and heavy calcification of all cusps, the CCC increased to 0.93
References Our study, 2015 Garcia et al. [34] Pouleur
et al. [26] Debl et al. [23] Kupfahl et al. [22] et al. [Caruthers 12] John et al. [21] Friedrich et al. [20]
Sample size (n) 31 31 31 33 44 24 50 25
Age (mean ± SD) 69 ± 10 67 ± 12 67 ± 13 58 (range
34–84) 70 ± 8.8 64 ± 8 AVA (cm2, mean ± SD) 0.93 ± 0.42 1.59 ± 0.73 1.8 ± 1.3 0.85 ± 0.3 0.80 ± 0.25 0.91 ± 0.25 0.82 ± 0.23 AVA (cm2, range) 0.72–1.73 0.43–6.05 0.45–1.40 0.5–1.8 0.5–1.6 0.40–1.30 Bicuspid valve (n) 5 9 10 1 5 AVA techniques comparisons pl-cMR versus pl-TEE CCC = 0.85 (CCC = 0.93)a r = 0.98 r = 0.86 MD ± SD = 0.02 ± 0. 21 cm 2 r = 0.96 ce-cMR versus ce-TTE CCC = 0.82 r = 0.92 r = 0.98 r = 0.83 pl-cMR versus ce-TTE CCC = 0.70 MD ± SD = 0.05 ± 0. 20 cm 2 r = 0.52 pl-cMR versus cardiac cath-eterization r = 0.80 r = 0.64 r = 0.78 pl-TEE versus cardiac cath-eterization MD ± SD = -0.05 ± 0.26 cm2 r = 0.58 Planimetric ver-sus ce-derived methods AVA overes-timation by pl-methods (cMR and TEE) AVA over-estimation by pl-methods (cMR and TEE) AVA over-estimation by pl-methods (cMR and TEE) AVA overestimation by
pl-methods (cMR and TEE) AVA
overes-timation by pl-methods (cMR and TEE) cMR-LVOT versus TTE-LVOT TTE underesti-mated the LVOT area; CCC = 0.71 TTE underestimated t he LVOT area; bias = −0.94 cm2 TTE underes-timated t he LVOT area; r = 0.92
area, and in addition potentially detects myocardial fibrosis and infarction (4). Nevertheless, it still has limitations in its contraindication, such as the presence of metal implants (now largely overcome), arrhythmias and claustrophobia. In practice, TTE is likely to remain the noninvasive, ubiq-uitously available and cost-effectively preferred technique for the initial evaluation of patients with suspected valvular heart disease in daily clinical practice. However, as shown by the present study, for a second-tier evaluation CMR may provide accurate data on AVA and EOA in patients with poor acoustic windows or in the presence of discordance between data obtained by TTE and clinical findings (5,6). In addition, due to the opportunity of revealing areas of fibrosis and/ or necrotic myocardium by late gadolinium enhancement, as well as to assess myocardial perfusion, not provided by standard TTE, CMR may be the preferred test for assessing patients with multiple cardiac abnormalities. In this setting, the assessment of valve stenosis severity becomes an impor-tant component of a comprehensive cardiac examination.
Several recent studies have reported that multidetector computed tomography (CT) planimetric measurements of AVA are highly reproducible and correlate strongly with CMR and TEE planimetry, and that the formers were very similar to the continuity equation TTE-derived AVA thanks to the high CT spatial resolution, which allows a precise delineation of the free edges of the valve. CT planimetric measurements also allows accurate in vivo quantification of aortic valve calcifications [30]. Multidetector CT has here, however, two great limitations, represented by the radiation exposure and the impossibility to obtain transvalvular flow and velocities, hence preventing from obtaining effective ori-fice area measurements. Conversely, CMR is a non-invasive, radiation-free imaging modality that allows quantification of flow velocities. Moreover, CMR has superior temporal resolution as compared with computed tomography [31, 32]. Study limitations
We acknowledge limitations in the present study. Firstly, the relatively small number of patients enrolled in our study prevented us from performing subgroups analyses in patients with different flow-gradient patterns. Further studies are warranted to investigate this issue. Secondly, we included 5 patients with bicuspid aortic valve, a condition known to be associated with complex flow patterns which may affect the accuracy of flow measurement by PC imaging. However, we used the simplified continuity equation method to derive AVA and in-plane PC to assist in planning the appropriate location of subsequent perpendicular ‘through-plane’ slabs in order to calculate the highest jet velocity. Thirdly, we acknowledge that 3D-TTE may provide with a better meas-urement of the LVOT likely improving accuracy and preci-sion of EOA determination [33].
Conclusions
The compared planimetric AVA and continuity equation-derived estimates of EOA by CMR and echocardiography in this study demonstrate the potential of CMR as a promising and non-invasive alternative diagnostic tool for the evalua-tion of AS in patients unsuitable to TTE examinaevalua-tion, in the presence of discordances between TTE-derived parameters and clinical findings, or in patients in whom CMR is advised for additional clinical reasons.
Acknowledgements No funding sources to be acknowledged from the Italian team. The part of this work performed in the UK was partially supported by the NIHR Bristol Cardiovascular Biomedical Research Unit (to Dr Chiara Bucciarelli-Ducci). The content of this work rep-resents the opinion of the authors and not of the UK Department of Health.
Compliance with ethical standards
Conflict of interest No conflicts of interest as to the content of this manuscript are reported by any of the authors.
Ethical approval All procedures performed in studies here presented and involving human participants were in accordance with the ethical standards of the national research committee and with the 1964 Dec-laration of Helsinki and its later amendments or comparable ethical standards. Not applicable: retrospective analysis of data acquired for clinical purpose: as such, approval from the local Ethics Committee was not necessary and was not sought.
Informed consent Informed consent for the performance of the diag-nostic examinations here reported was obtained from all individual participants included in the study.
References
1. Selzer A (1987) Changing aspects of the natural history of valvu-lar aortic stenosis. N Engl J Med 317:91–98
2. Otto CM, Kuusisto J, Reichenbach DD, Gown AM, O’Brien KD (1994) Characterization of the early lesion of ‘degenerative’ val-vular aortic stenosis. Histological and immunohistochemical stud-ies. Circulation 90:844–853
3. Lindroos M, Kupari M, Heikkila J, Tilvis R (1993) Prevalence of aortic valve abnormalities in the elderly: an echocardio-graphic study of a random population sample. J Am Coll Cardiol 21:1220–1225
4. Vahanian A, Alfieri O, Andreotti F et al (2012) Guidelines on the management of valvular heart disease (version 2012). Eur Heart J 33:2451–2496
5. Nishimura RA, Otto CM, Bonow RO et al (2014) 2014 AHA/ACC guideline for the management of patients with valvular heart dis-ease: a report of the American College of Cardiology/American Heart Association Task Force on Practice Guidelines. J Am Coll Cardiol 63:e57–e185
6. Cannon SR, Richards KL, Crawford MH et al (1988) Inadequacy of the Gorlin formula for predicting prosthetic valve area. Am J Cardiol 62:113–116
7. Yoon YE, Hong YJ, Kim HK et al (2014) 2014 Korean guidelines for appropriate utilization of cardiovascular magnetic resonance imaging: a joint report of the Korean Society of Cardiology and the Korean Society of Radiology. Korean J Radiol 15:659–688 8. Sondergaard L, Hildebrandt P, Lindvig K et al (1993) Valve area
and cardiac output in aortic stenosis: quantification by magnetic resonance velocity mapping. Am Heart J 126:1156–1164 9. Cawley PJ, Maki JH, Otto CM (2009) Cardiovascular magnetic
resonance imaging for valvular heart disease: technique and vali-dation. Circulation 119:468–478
10. Kramer CM, Barkhausen J, Flamm SD, Kim RJ, Nagel E (2013) Society for Cardiovascular Magnetic Resonance Board of Trus-tees Task Force on Standardized P. Standardized cardiovascular magnetic resonance (CMR) protocols 2013 update. J Cardiovasc Magn Reson 15:91
11. Picard MH, Adams D, Bierig SM et al (2011) American Society of Echocardiography recommendations for quality echocardiography laboratory operations. J Am Soc Echocardiogr 24:1–10
12. Caruthers SD, Lin SJ, Brown P et al (2003) Practical value of cardiac magnetic resonance imaging for clinical quantification of aortic valve stenosis: comparison with echocardiography. Circula-tion 108:2236–2243
13. Waters EA, Caruthers SD, Wickline SA (2005) Correlation analy-sis of stenotic aortic valve flow patterns using phase contrast MRI. Ann Biomed Eng 33:878–887
14. Myerson SG (2012) Heart valve disease: investigation by cardio-vascular magnetic resonance. J Cardiovasc Magn Reson 14:7 15. Muzzarelli S, Monney P, O’Brien K et al (2014) Quantification of
aortic flow by phase-contrast magnetic resonance in patients with bicuspid aortic valve. Eur Heart J Cardiovasc Imaging 15:77–84 16. Yap SC, van Geuns RJ, Meijboom FJ et al (2007) A simplified
continuity equation approach to the quantification of stenotic bicuspid aortic valves using velocity-encoded cardiovascular magnetic resonance. J Cardiovasc Magn Reson 9:899–906 17. Lin LI (1989) A concordance correlation coefficient to evaluate
reproducibility. Biometrics 45:255–268
18. Stoddard MF, Arce J, Liddell NE, Peters G, Dillon S, Kupersmith J (1991) Two-dimensional transesophageal echocardiographic determination of aortic valve area in adults with aortic stenosis. Am Heart J 122:1415–1422
19. Tribouilloy C, Shen WF, Peltier M, Mirode A, Rey JL, Lesbre JP (1994) Quantitation of aortic valve area in aortic stenosis with multiplane transesophageal echocardiography: comparison with monoplane transesophageal approach. Am Heart J 128:526–532 20. Friedrich MG, Schulz-Menger J, Poetsch T, Pilz B, Uhlich F,
Dietz R (2002) Quantification of valvular aortic stenosis by mag-netic resonance imaging. Am Heart J 144:329–334
21. John AS, Dill T, Brandt RR et al (2003) Magnetic resonance to assess the aortic valve area in aortic stenosis: how does it compare to current diagnostic standards? J Am Coll Cardiol 42:519–526 22. Kupfahl C, Honold M, Meinhardt G et al (2004) Evaluation of
aortic stenosis by cardiovascular magnetic resonance imaging:
comparison with established routine clinical techniques. Heart 90:893–901
23. Debl K, Djavidani B, Seitz J et al (2005) Planimetry of aortic valve area in aortic stenosis by magnetic resonance imaging. Invest Radiol 40:631–636
24. Hildebrand LB, Buonocore MH (2002) Fully refocused gradient recalled echo (FRGRE): factors affecting flow and motion sensi-tivity in cardiac MRI. J Cardiovasc Magn Reson 4:211–222 25. von Knobelsdorff-Brenkenhoff F, Rudolph A, Wassmuth R et al
(2009) Feasibility of cardiovascular magnetic resonance to assess the orifice area of aortic bioprostheses. Circ Cardiovasc Imaging 2:397–404 (2 p following 404)
26. Pouleur AC, le Polain de Waroux JB, Pasquet A, Vancraeynest D, Vanoverschelde JL, Gerber BL (2007) Planimetric and continuity equation assessment of aortic valve area: head to head compari-son between cardiac magnetic recompari-sonance and echocardiography. J Magn Reson Imaging 26:1436–1443
27. Paelinck BP, Van Herck PL, Rodrigus I et al (2011) Comparison of magnetic resonance imaging of aortic valve stenosis and aortic root to multimodality imaging for selection of transcatheter aortic valve implantation candidates. Am J Cardiol 108:92–98 28. Janosi RA, Plicht B, Kahlert P et al (2014) Quantitative analysis
of aortic valve stenosis and aortic root dimensions by three-dimen-sional echocardiography in patients scheduled for transcutaneous aortic valve implantation. Curr Cardiovasc Imaging Rep 7:9296 29. Chin CW, Khaw HJ, Luo E et al (2014) Echocardiography
under-estimates stroke volume and aortic valve area: implications for patients with small-area low-gradient aortic stenosis. Can J Car-diol 30:1064–1072
30. Koos R, Mahnken AH, Kuhl HP et al (2006) Quantification of aortic valve calcification using multislice spiral computed tomog-raphy: comparison with atomic absorption spectroscopy. Invest Radiol 41:485–489
31. La Grutta L, Toia P, Galia M et al (2016) Role of cardiac com-puted tomography in the evaluation of coronary artery stenosis in patients with ascending aorta aneurysm detected at transthoracic echocardiography. J Comput Assist Tomogr 40:393–397 32. Pouleur AC, le Polain de Waroux JB, Pasquet A, Vanoverschelde
JL, Gerber BL (2007) Aortic valve area assessment: multidetec-tor CT compared with cine MR imaging and transthoracic and transesophageal echocardiography. Radiology 244:745–754 33. Furukawa A, Abe Y, Tanaka C et al (2012) Comparison of
two-dimensional and real-time three-two-dimensional transesophageal echocardiography in the assessment of aortic valve area. J Cardiol 59:337–343
34. Garcia J, Kadem L, Larose E, Clavel MA, Pibarot P (2011) Com-parison between cardiovascular magnetic resonance and transtho-racic Doppler echocardiography for the estimation of effective orifice area in aortic stenosis. J Cardiovasc Magn Reson 13:25
Affiliations
Cesare Mantini1 · Gabriele Di Giammarco2 · Jacopo Pizzicannella3 · Sabina Gallina3 · Fabrizio Ricci3 · Emilia D’Ugo3 ·
Marziale Marchetti3 · Antonio Raffaele Cotroneo1 · Nauman Ahmed4,5 · Chiara Bucciarelli‑Ducci4,5,6 ·
Armando Tartaro1 · Raffaele De Caterina3 Cesare Mantini [email protected] Gabriele Di Giammarco [email protected] Jacopo Pizzicannella [email protected] Sabina Gallina [email protected]
Fabrizio Ricci [email protected] Emilia D’Ugo [email protected] Marziale Marchetti [email protected] Antonio Raffaele Cotroneo [email protected] Nauman Ahmed [email protected] Chiara Bucciarelli-Ducci [email protected] Armando Tartaro [email protected]
1 Section of Diagnostic Imaging and Therapy-Radiology
Division, Department of Neurosciences, Imaging
and Clinical Sciences, “G. d’Annunzio” University, Chieti, Italy
2 Section and Cardiovascular Surgery Division,
“G. d’Annunzio” University, Chieti, Italy
3 Section of Cardiovascular Sciences and Cardiology Division,
University Cardiology Division, “G. d’Annunzio” University – Chieti, C/o Ospedale SS. Annunziata, Via dei Vestini, 31, 66013 Chieti, Italy
4 NIHR Bristol Cardiovascular Biomedical Research Unit,
Bristol Heart Institute, University Hospitals Bristol, Bristol, UK
5 University of Bristol, Bristol, UK
6 National Heart and Lung Institute, Imperial College London,