UNIVERSITÀ DEGLI STUDI DELLA TUSCIA DI VITERBO
DIPARTIMENTO DI AGROBIOLOGIA E AGROCHIMICA
CORSO DI DOTTORATO DI RICERCA
BIOTECNOLOGIE VEGETALI- XVIII° CICLO
Tesi di Dottorato di Ricerca
PhD Dissertation
Comparative transcriptional and proteomic profiling of bread wheat cv. Bobwhite
and its derived transgenic line over-expressing a
lmw-gs
gene
AGR/07
Coordinatore: Prof. Domenico Lafiandra
Firma: _______________
Tutor: Prof. Stefania Masci
Firma: _______________
Dottorando: Federico Scossa
Firma: __________________
ABSTRACT ... 1
1. INTRODUCTION... 3
1.1 Wheat... 3
1.2 Origin of wheat ... 4
1.3 Wheat grain anatomy and composition... 7
1.3.1 The bran ... 8
1.3.2 The endosperm and the embryo ... 8
1.3.3. Endosperm development ... 11
1.3.4 Starch ... 13
1.3.5 Seed storage proteins... 14
1.3.5.1 Storage albumins and globulins ... 14
1.3.5.2 Gluten proteins... 15
1.3.5.2.1 Gliadins ... 16
Genetics and polymorphism ... 17
Amino acid sequences and structure of ω-gliadins ... 18
Amino acid sequences and structure of α/β- and γ-gliadins... 19
Relationship of gliadins to wheat quality... 20
1.3.5.2.2 Glutenins (glutenin polymers)... 22
1.3.5.2.2.1 HMW-GS (High Molecular Weight – Glutenin Subunits)... 23
1.3.5.2.2.2. LMW-GS (Low Molecular Weight – Glutenin Subunits) ... 29
1.3.5.2.3 Polymer formation ... 37
1.3.5.2.4 Regulation of prolamin gene expression ... 38
1.3.5.3. Seed storage proteins synthesis and deposition ... 40
1.3.5.3.1 Deposition of storage albumins and globulins ... 41
1.3.5.3.2 Deposition of prolamines ... 42
1.3.5.4 Allergenicity of the seed storage proteins in wheat flours... 43
1.4. Bread and pasta making... 44
1.4.1 Rheology... 45
1.4.1.1 Assay methods of the dough properties ... 45
The Zeleny sedimentation test ... 45
The SDS sedimentation test... 46
The mixograph ... 47
1.5 Genetic improvement of wheat ... 48
1.5.1 Genetic manipulation of gluten protein composition... 52
1.6 Safety assessment for the biotech crops ... 53
1.6.1 Methods to detect and assess unintended effects of a genetic modification... 54
DNA analysis ... 55
Gene expression analysis ... 55
Proteomics ... 56
2. AIM OF WORK... 59
3. MATERIALS AND METHODS... 61
3.1 Genetic material ... 61
3.2 Microarray profiling ... 62
3.2.1 Plant material and seed collection strategy... 62
3.2.3 RNA isolation and purification ... 67
3.2.4 Target synthesis... 67
3.2.5 Wheat cDNA Array construction... 67
3.2.6 Array hybridization ... 69
3.2.7 Scanning parameters, data analysis and presentation... 69
3.2.8 Classification of the differentially expressed genes... 71
3.3 Comparative analysis of seed-storage proteins ... 71
3.3.1 Isolation of albumins and globulins from wheat flours ... 71
3.3.2 Isolation of gliadins... 72
3.3.3 Isolation of glutenins ... 72
3.3.4 Enrichment procedure for the D-group of low-molecular-weight glutenin subunits... 72
3.3.5 Enrichment procedure for the B- and C-groups of low-molecular-weight glutenin subunits ... 73
3.3.6 Acid polyacrylamide gel electrophoresis (Acid-PAGE)... 73
3.3.7 Two-dimensional electrophoresis (Acid-PAGE x SDS-PAGE) of gliadins, B-, C- and D-type low-molecular-weight glutenin subunits... 73
3.3.8 Electroblotting and amino acid sequencing... 74
4. RESULTS AND DISCUSSION ... 77
4.1 Overview... 77
4.1.1 General considerations about the microarray experimental design... 77
4.1.2 Dual nature of the microarray experiment and transformation of the dataset ... 78
4.1.3 Nature of the proteomic profiling ... 79
4.2 Identification of differentially expressed genes during the period of grain filling between the LMW-GS over-expressing line and the wild type genotype... 80
4.2.1 Overall gene regulation throughout the seed development ... 81
4.2.2 Differentially-expressed genes at 10 DPA “early”... 91
4.2.3 Differentially-expressed genes at 10 DPA “late”... 93
4.2.4 Differentially-expressed genes at 20 DPA... 97
4.2.5 Differentially-expressed genes at 30 and 35 DPA ... 100
4.3 Expression profiles of genes during seed maturation ... 102
4.3.1 The issue of cross-hybridization... 102
4.3.2 Storage proteins... 103
4.3.3 Over-expressed genes have two different patterns of expression... 107
.4.3.4 Starch biosynthetic enzymes are not differentially expressed ... 110
4.4 Proteomic profiling ... 112
4.4.1 Two-dimensional electrophoresis (Acid-PAGExSDS-PAGE) of B-type LMW-GS ... 112
4.4.2 Two-dimensional electrophoresis (Acid-PAGExSDS-PAGE) of C- and D-type LMW-GS ... 113
4.4.3 Gliadins analysis ... 116
5. CONCLUSIONS ... 119
6. REFERENCES ... 121
ABSTRACT
Since wheat is indisputably one of the major food crops in the world and the single most important source of plant protein in the human diet, it has always been a target of choice for classical and biotechnological-oriented breeding programs.
The quality of the wheat end-use products is largely determined by the gluten proteins, a complex mixture of polypeptides accounting for up to 80% of the total seed proteins. Gluten proteins are the determinants of the visco-elastic properties of the wheat doughs, and their quantity in the seeds is directly correlated with the quality of end-use products.
Recent efforts to increase the quantity of gluten proteins in the seeds focused on the introduction of additional gene copies by means of genetic engineering technology. We have thus produced and extensively characterized an independent transgenic bread wheat line overexpressing a LMW-GS (Low Molecular Weight-Glutenin Subunit), whose relative quantity in the seed is expected to positively affect the technological properties of the flour.
In order to define the consequences of transgene(s) insertion/expression and the effects of genetic transformation on the global endosperm gene expression, we carried out a comparative proteomic and transcriptional profiling between the seeds of the transgenic line with its non-transformed counterpart.
Microarray analysis showed that, during the seed development, 542 unigenes were significantly differentially expressed. Those genes for which a reliable annotation was available have been classified, according to their putative functional category, to provide an overview of the genome responses to genetic transformation and trasgene(s) expression. By expression pattern matching, we identified a number of genes strongly correlated to the expression of the transgenes during the process of seed maturation. The implications of the lmw-gs over-expression on the partitioning and accumulation of storage reserves in developing wheat grains are also discussed.
Evidence for differential expression of several seed storage-related genes was confirmed at the protein level, both in developing and mature seeds, with quantitative proteomic analyses of the corresponding encoded subunits.
Our data define in part the downstream responses in developing seeds to genetic transformation and over-expression of a lmw-gs transgene in bread wheat.
1. INTRODUCTION 1.1 Wheat
Wheat is the world’s most popular crop. It is grown over a large area and under a wide range of conditions. Over 600 million tons (Mt) are produced annually on 215 million hectares (Mha), an average of 2.79 t ha-1 (Tab. 1.1). At present, wheat is the staple food in more than 40 countries for over 35% of the world’s population and provides over 20% of the calories and proteins in human nutrition.
Its key role is due to several reasons. It can grow over a wide range of climatic conditions, elevations, and soil fertility. It is easily transported and safely stored over long periods of time, and perhaps, most important, it can be consumed by humans with minimal processing: its seeds can be ground into flour or semolina which form the basic ingredients to prepare leavened and unleavened bread, noodles, cakes, biscuits and pasta. Moreover, wheat-derived products are widely accepted by people of all religions and races. Basically, in one form or another, wherever we are in the world, we consume wheat at every meal.
In particular, wheat endosperm, as a major component of the human diet, is not only a source of carbohydrates, but also of proteins, minerals and vitamins and it can be a sufficient protein supplier when balanced with other foods rich in lysine and methionine. The protein content of wheat grains can vary from 10 to 18% of the dry weight and the majority of the proteins accumulate in the endosperm as storage proteins that represent a source of carbon and nitrogen during the germination process.
2004 Wheat
production (Mt) 2004 Wheat area harvest (Ha)
World 627,130,584 215,765,044
Africa 21,682,410 9,675,588
North & Central
America 87,110,539 30,663,190
South America 24,017,168 9,715,534
Asia 255,118,303 96,419,605
Europe 218,539,154 57,260,121
Oceania 20,663,010 12,031,006
Tab. 1.1: Wheat production and area harvest in different continents and in the world (FAOSTAT data, 2005).
Storage proteins form a complex called gluten which shows, upon mixing with water, unique rheological properties such as elasticity and extensibility. By modifying the rheological properties of gluten, wheat flour can be used to produce a wide variety of food products.
Owing to the importance of wheat as a food crop, it has been, and it is still is, extensively studied. The wheat storage proteins, in particular, have been widely characterized to understand their contribution to the physical and chemical properties of the wheat flour/dough (Osborne, 1924; Shewry and Tatham, 1990; Shewry et al., 1999 for general review) with the final goal to improve the wheat end-product quality, although many aspects still remain unclear due to the peculiar structure and organisation of the endosperm proteins into gluten.
1.2 Origin of wheat
It is widely accepted today that wheat was first grown as a food crop since 10,000-8,000 B.C.. The origin of the genus Triticum is found in Asia and part of Africa, in the area that extends from Syria to Kashmir, and southwards to Ethiopia. This is where cultivated wheats gradually evolved from wild plants. Emmer is generally regarded as one of the ancestors of the wheats commonly grown today, because it closely resembles the wild species of wheat found in the mountainous regions of Syria and the area formerly part of Palestine. Moreover, crude wheat plants, such as einkorn and emmer, and many wild species of grass were common to the same area.
According to the modern taxonomy, wheat belongs to the genus Triticum of the family Gramineae; it includes several species forming a polyploid series, with a basic chromosome number (x) equal to 7, comprising diploid (2n=2x=14), tetraploid (2n=4x=28) and hexaploid (2n=6x=42) wheats.
Today's commercial wheat, tetraploid and hexaploid wheats, contain two and three homeologous genomes, respectively. These genomes are named A, B, D and G, according to the donor species, each of which consists of seven pairs of chromosomes numbered 1 to 7. They are products of natural hybridisation of ancestral types, none of which nowadays is still of any commercial importance. In the hybridisation process, spontaneous crosses between wild species with different chromosomes have been followed by spontaneous doubling of chromosomes to originate a fertile allopolyploid (Fig.1.1).
Diploid wheat (einkorn) comprises three species: T. boeoticum, T. urartu, and T. monococcum, the first two of which are wild and the last is cultivated. All contain the A genome that is shared with polyploid wheats. Triticum monococcum was probably domesticated from its wild progenitors in the Karacadag Mountains of south-eastern Turkey about 10,000 years ago.
Tetraploid T. turgidum contains the A and B genomes. There has been an ongoing controversy regarding the diploid source of the B genome, but the current consensus of opinion is that it was Aegilops speltoides Tausch or a close relative within the Sitopsis section of the Aegilops genus.
The cultivated form var. durum (often called T. durum) is widely grown in regions with a Mediterranean climate as durum or pasta wheat.
The cultivated tetraploid wheats have evolved from two wild type groups, T. dicoccoides (AABB) and T. araraticum (AAGG) (Feldman, 2001), derived from diploid progenitors.
A second tetraploid species, T. timopheevii, as its wild progenitor T. araraticum , contains the G genome, which is closely related to the genome of Aegilops speltoides (S genome). T. timopheevii is still grown to a limited extent in Armenia and Transcaucasia.
Of all cultivated tetraploid wheats, today T. durum types are by far the most important, even though they are only grown on about 10% of the wheat total cultivated area, the remaining 90% being dedicated to the hexaploid wheats.
Nowadays, durum wheat, that is particularly suited to the production of pasta products, but also of some types of bread in Southern of Italy and couscous in North of Africa, is getting more and more importance with the increase of pasta products demand.
The hexaploid wheats originated some 6,000-7,000 years ago by natural hybridisation of tetraploid wheat, most likely T. dicoccum (AABB) with the diploid wild grass Aegilops squarrosa (DD), also known as T. tauschii (Miller, 1987). The resulting hexaploid species T. aestivum (AABBDD), the common “bread wheat”, is the dominant species in world agriculture. Most bread wheat is the free threshing var. aestivum, but other free threshing types (vars. compactum and sphaerococcum) are grown in restricted areas.
The hexaploid wheat species T. zhukovskyi, whose genomic composition is AAAAGG, could have been originated recently by interspecific hybridization of cultivated tetraploid T. timopheevvii (AAGG) with the cultivated diploid T. monococcum (AA).
The evolution of the polyploidy complex of the genus Triticum and a possible classification of cultivated wheats along with its wild progenitors are shown in Fig. 1.1 and Table 1.2, respectively.
Fig. 1.1: A schematic representation of the evolution of the polyploid wheats. Letters in brackets indicate the genomic composition of the species.
Ae. Sez. Sitopsis (Ae. speltoides) (BB, GG) T. monococcum ssp. boeoticum (AA) T. monococcum ssp. monococcum (AA) T. urartu (AA) T. turgidum ssp. dicoccoides (AABB) T. tauschii (DD) T. urartu (AA) T. timopheevi ssp. araraticum (AAGG) T. turgidum ssp. dicoccum (AABB) T. turgidum ssp: durum turgidum polonicum carthlicum turanicum (AABB) T. aestivum ssp: aestivum compactum sphaerococcum T. spelta T. macha T. vavilovii (AABBDD) T. timopheevi ssp. timopheevi (AAGG) T. zhukovskyi (AA AA GG) Wild wheats Cultivated wheats
Species Genome Wild (hulled) Cultivated (Hulled) Cultivated (Free-threshing) DIPLOID (2n=14) Aegilops speltoides Aegilops squarrosa Triticum urartu Triticum monococcum S (G) D A A All All All var. boeoticum (wild einkorn) var. monococcum (cultivated einkorn) var. monococcum (cultivated einkorn) TETRAPLOID (2n=28) Triticum timopheevii Triticum turgidum AG AB var. araraticum var.dicoccoides (wild emmer) var.timopheevii var. dicoccum (cultivated emmer) var. militinae var. durum var. turgidum var. polonicum HEXAPLOID (2n=42)
Triticum aestivum ABD var. spelta
var. macha var. vavilovii var. aestivum var. compactum var. sphaerococcum Tab. 1.2: Classification of cultivated wheats and related wild species
Redrawn from Feldman et al. (1995), modified.
It should be noted that the high chromosome number of hexaploid wheats definitely contributed to their wider adaptability than other species; this explains the great dispersion from South-Western Asia in various directions.
Moreover, the unique milling and baking properties of common bread wheat are not found among the diploid and tetraploid wheats. Since only the hexaploid group possesses the D set of chromosomes, the desirable quality characteristics of bread wheats have been attributed preponderantly to the presence of this third genomic component.
By crossing and selecting, man has produced numerous cultivars of hexaploid wheat; nowadays it is still the most important species grown in Europe, North America and Australia.
1.3 Wheat grain anatomy and composition
The wheat grain is botanically a single-seeded fruit, called a ‘‘caryopsis’’ or ‘‘kernel’’ (Fig. 1.2 and Fig. 1.3). It develops within floral envelopes (the ‘‘lemma’’ and ‘‘palea’’), which are actually modified leaves. At maturity, the wheat kernel averages ∼2.5-3.0 mm thick (or high as it stands on its base), ∼3.0-3.5 mm wide, ∼6.0-7.0 mm in length, with an average weight of ∼30-40 mg.
Wheat kernels are rounded on the dorsal side, with a longitudinal ‘‘crease’’ (a deep groove) running the full length of the ventral side. The shape of the groove is a characteristic feature of some species and varieties.
The wheat grain is constituted by three distinct parts: the bran, the starchy endosperm and the embryo (called “germ” by millers). These different components account for 13-17%, 80-85% and 2-3% of the dry weight, respectively.
The main inner volume of the grain is thus taken up by the starchy endosperm, which becomes the white flour that is released and crushed to fine particles by the flour miller.
1.3.1 The bran
The bran of the wheat grain is composed by a series of different cell layers. The ‘‘pericarp’’ (fruit coat) surrounds the entire seed and consists of two portions, the outer pericarp and the inner pericarp. The outer pericarp is composed by the epidermis (epicarp), the hypodermis, and by the innermost layer, called the remnants of thin-walled cells. The inner pericarp, adjacent to the remnants, is composed of intermediate cells (cross cells and tube cells). The cross cells are long and cylindrical (∼125x20 μm). They are tightly packed, with little or no intercellular space. The tube cells are similar in size and shape to the cross cells, but they are not packed tightly and do not form a continuous layer; thus have many intercellular spaces. A further inner layer of cells is the seedcoat (also called “testa”) which is firmly joined to the tube cells. Grain color, usually red or white, is related to pigment in the seedcoat. Tightly bound to the internal surface of the “testa” is the nucellar epidermis (‘‘hyaline layer,’’ or ‘‘perisperm’’).
The total pericarp has been reported to comprise ∼5% of the kernel volume.
1.3.2 The endosperm and the embryo
The mature wheat grain consists of two genetically different organs, the endosperm and embryo, that arise from separate fertilization events. The pollen tube delivers two sperm cells into the embryo sac, one of which fuses with the egg cell to give the diploid zygote. This gives rise in the mature grain to the embryonic axis and to a single cotyledon, called the scutellum. The second sperm cell fuses with two polar nuclei to form a triploid endosperm cell that expands, cellularizes, divides, and differentiates to give two tissues: the starchy endosperm, which comprises about 80% of the dry matter and 72% of the protein in the mature grain (Pomeranz, 1988), and the aleurone, which completely surrounds the kernel and is generally one cell thick. It is the intermediate cell layer between the nucellar epidermis and the peripheral cells of the starchy endosperm. The majority of the mineral matter located in bran is found in the aleurone layer, which also has high content of thiamine. The aleurone cells are heavy-walled, essentially cube-shaped, and free of starch. They can vary in thickness from 30-70 μm within a single kernel and have thick (6-8 μm), double-layered cellulosic walls.
Whole Grain Starchy
Endosperm Bran Embryo (Germ)
Proteins 16 13 16 22 Fats 2 1.5 5 7 Carbohydrates 68 82 16 40 Dietary fibers 11 1.5 53 25 Minerals (ash) 1.8 0.5 7.2 4.5 Other components 1.2 1.5 2.8 1.5 Total 100 100 100 100
Tab. 1.3: Chemical composition of the whole wheat grain with its various parts. Numbers are average percentages converted on a dry matter basis. Redrawn from Belderok (2000).
Essentially, mature starchy endosperm comprises cells in which starch granules are embedded in a matrix of storage proteins. These two components, together with cell walls and minor constituents, accumulate as a source of nutrients for the accompanying embryo when it begins to germinate. The nutrients are made available as a result of hydrolysis by enzymes produced in the embryo itself or in the aleurone, or both. Most of the starchy endosperm consists of food reserves: 82% carbohydrates (mainly starch), 13% proteins (Wieser et al., 1998) and 1.5% fats. The content of mineral and of dietary fibres is low, 0.5% and 1.5% respectively (Pomeranz, 1988).
Fig. 1.2: Structure of the wheat grain.
The wheat embryo is composed of two major parts, the embryonic axis (rudimentary root and shoot) and the scutellum, which functions as a storage organ. The scutellum is adjacent to the endosperm and contains some storage compounds (notably oil and globulin storage proteins), but it does not contain gluten proteins. The germ is quite rich in vitamin E and in B-vitamins. It contains many enzymes. The germ is a rich source of protein (25%), sugar (18%), oil (16% of the embryonic axis, and 32% of the scutellum are oil). The sugars are mainly sucrose and raffinose. On incineration, the germ gives a high level of ash (5%). Recovery of the germ during the milling process is an important step because of its value in the food and pharmaceutical industries.
Fig. 1.3: Cross-section of the wheat kernel.
1.3.3. Endosperm development
The development of the wheat plant is often described using the Feekes, Zadoks or Heun scales that assign numbers to visual landmarks that are useful for crop management purposes (Chang et al., 1974; Large, 1954). These subjective scales divide grain development into early, medium and late milk stages, and early, soft and hard dough stages. The temporal pattern of grain development also can be described in terms of transition points in the accumulation of total dry matter, starch, protein, and water, in order to pinpoint times in grain development when changes in gene expression and protein accumulation are likely to occur (Altenbach et al., 2003). Endosperm development begins with fertilization of a diploid cell, followed by repeated division of the triploid nuclei, gradual formation of cell walls, and partitioning of the original vacuolated cell into a characteristic cellular pattern (Olsen, 2001; Olsen et al., 1999; Lohe and Chaudhury, 2002). Next is a period of cell expansion in which water content increases and starch and protein reserves accumulate. Endoreduplication of DNA within the nuclei continues during this phase and has been reported to influence final grain size in maize (Engelen-Eiges et al., 2000). The maximum amounts of starch and protein that accumulate in each grain depend on the number of endosperm cells, determined early in grain fill, and the final size of the cells, which is influenced by water uptake, cell-wall extensibility and rate and duration of grain fill (Egli, 1998). Cell-wall-loosening enzymes may play a role in determining the extent of cell enlargement (Chanda and Singh, 1998). In maize, endosperm expansion was also reported to be influenced by cell division in the peripheral layers (Vilhar et al., 2002).
Cell expansion and water accumulation stop before the cessation of dry matter accumulation, starch and protein replace cell water, and the kernel begins to desiccate (Berger, 1999; Lopes and Larkins, 1993; Rogers and Quatrano, 1983). Late in development, the formation of a waxy layer at the chalaza impedes input of sugars and amino acids into the grain (Sofield et al., 1977a; Cochrane et al.,1983), protein and starch deposition cease and the grain reaches maximum dry weight or physiological maturity. At approximately this time the endosperm tissue undergoes a form of apoptosis, or programmed cell death, similar to that observed in other plant and animal tissues (Beltrano et al., 1994; Young and Gallie, 1999; Young and Gallie, 2000). Cell death, visualized by viability staining, progresses gradually throughout the endosperm tissue and is accompanied by internucleosomal fragmentation of genomic DNA. Only the aleurone cells remain viable. Finally, kernels desiccate rapidly, losing all but 10–15% of their water content, at which time they are ready for harvest.
Fig. 1.4: Temporal patterns in the accumulation of starch and protein described by the water content (►), fresh weight (■) and dry weight (●) during the grain development. Proteins were measured by a nitrogen combustion analysis, starch was measured by a specific assay kit, and the onset of apoptosis was estimated by the analysis of fragmented genomic DNA. Plants were grown under a 24°C/17°C day/night regimen. Taken from DuPont (2003), based on data from Altenbach (2003).
1.3.4 Starch
Starch is the major component of the endosperm of the cereal grains. It is the stored form of energy that is released on germination when amylase enzymes (both synthesized and deposited during the period of grain filling or de novo synthesized upon germination) break the starch down to glucose units for the developing embryo, roots, and shoots. For feed and food, starch also provides the major source of energy, providing it in a ‘‘slow-release’’ form that is well suited to our digestive systems.
Wheat starch is composed only of glucose units; the glucose units are linked α-1,4 to form linear chains and branches are formed through the connection of α-1,4 linked chains via α-1,6 linkages.
Starch is generally described as containing two broad classes of molecules, amylose and amylopectin, that differ in degree of polymerisation and branch frequency. Amylopectin is a very large molecule with a degree of polymerisation from 105 to 107 and contains frequent branch points, on average approximately one branch for every 15–20 glucose units.
Amylose has a lower degree of polymerisation (103 to 104) and contains from zero to a few branch points. These differences in amylose and amylopectin are functionally important and are reflected in the variety of applications these polymers find in the food and chemical industries. In hexaploid and durum wheats, amylose content ranges from about 18 to 35%, although waxy wheats containing effectively zero amylose have now been produced.
Starch is deposited in granules in the wheat endosperm in amyloplasts, specialised starch biosynthetic organelles derived from the same proplastids as chloroplasts, but containing no photosynthetic apparatus. The precise molecular events that occur at the initiation of the starch granule remain obscure. In wheat, granule initiation occurs in two phases, in the period 3–7 days after anthesis, during which time the large (25-40 μm) “A” granules are initiated (Briarty et al., 1979). Granule initiation then appears to cease until mid endosperm development, when a second, much more prolific, period of granule initiation occurs leading to the development of the small (5-10 μm) “B” granule populations. A third burst of “C” granule initiation has also been observed in wheat. A-granules develop a bulbous protuberance that develops into an apposition plate that progressively extends around the granule, eventually encircling the granule. The deposition on the faces of the equatorial plate appears to proceed in a diurnal manner, producing the characteristic alternating layers of starch.
The B-granules were seen in lateral evaginations of the amyloplast membrane, and multiple small B-granules were seen in a single evagination. B granules remain spherical and do not proceed through the equatorial plate formation pathway typical for the A-granule. There are marked differences in the patterns of starch deposition in different cereals that result in different starch granule size distributions and morphologies.
In addition to starch, the starch granule contains two other important components. Firstly, the interior of the starch granule contains a range of starch biosynthetic enzymes that account for about 0,5% of the mass of the granule (Denyer et al., 1995; Rahman et al., 1995). Secondly, the granule contains lipids, complexed within the amylose fraction (Morrison and Gadan, 1987).
These lipids are thought to exert important effects on the interactions of the granule with water during gelatinisation and swelling (Morrison et al., 1993). The properties and functionality of wheat starch are controlled not only by the nature and composition of the starch granule, but are also strongly influenced by the nature of the endosperm material in which the granule is embedded in the desiccated grain. The hardness of the grain controls the manner in which the endosperm and starch granule is fractured during the milling process, leading to important effects on processing performance.
In summary the key features of the deposition of starch in the wheat endosperm that control functionality are starch content, grain hardness, granule size distribution and shape, the presence of endogenous lipids in the granule, amylopectin structure, and the ratio of amylose to amylopectin. These differences in starch deposition define the ways in which starch responds to heat and water during the utilisation of starch in the complex foods prepared from cereal flours. Each of these features may be amenable to modification by molecular/genetic changes in genomic DNA.
1.3.5 Seed storage proteins
Wheat grains contain relatively little protein compared to legume seeds, with an average of about 10–12% dry weight.
Nevertheless, they provide over 200 mt of protein for the nutrition of humans and livestock, which is about three times the amount derived from the more protein-rich (20–40%) legume seeds. In addition to their nutritional importance, cereal seed proteins also influence the utilization of the grain in food processing. In particular, the unique property of wheat flour to form an extensible and elastic dough reside primarily in the storage proteins of its endosperm.
The scientific study of cereal grain proteins extends back to 1745, with the pioneering work of Giacomo Beccari, professor of Chemistry at the University of Bologna. He was the first one to describe and call “gluten” that cohesive protein mass obtained after washing wheat flour with water (Beccari, 1745). Since then more systematic studies have been carried out, notably by Osborne (1859–1929). Osborne developed a classification of wheat seed proteins based on their solubility in a series of solvents, for example, albumins in water, globulins in dilute saline, prolamins, soluble in alcohol-water mixtures and glutelins, soluble in dilute acid or basic solutions.
1.3.5.1 Storage albumins and globulins
In classifications of storage proteins based on solubility, those that are soluble in water and in salt solutions are called albumins and globulins, respectively.
Many water or salt-soluble wheat proteins are located in the embryo and aleurone layers; others are distributed throughout the endosperm. They may amount to about 20% of the total proteins
Payne and Rhodes (1982) noted that soluble proteins are complex mixtures containing: 1) metabolic enzymes that survived dehydration, 2) hydrolytic enzymes necessary for germination, 3) enzyme inhibitors.
Also present are proteins related to legumins (the seed storage proteins of legumes), called “triticins”, which were extensively studied by Singh and Shepherd (1985). They account for about 5 % of the total seed proteins and are located in the protein bodies of the starchy endosperm. When considering their solubility properties, they behave as globulins, but no important link with pasta or breadmaking quality has been established.
The storage globulins of maize and wheat have been characterized in some detail (Kriz, 1999 and Singh et al., 2001). They are readily soluble in dilute salt solution and have sedimentation coefficients of about 7. They have limited sequence similarity with, and may be homologous to, the 7S vicilins of legumes and other dicotyledonous plants; they also have similar structures and properties (Kriz, 1999).
The 7S globulins are stored in protein bodies and appear to function solely as storage proteins. However, they do not appear to be absolutely required for normal seed function, at least in maize, where a null mutant behaves normally in terms of development and germination (Kriz and Wallace, 1991). Furthermore, although the aleurone and embryo are rich in proteins compared with the starchy endosperm, the globulins in these tissues have limited impact on the end use properties of the grain. In wheat, the aleurone and embryo account only for about 10% of the grain dry weight and are usually removed by milling before human consumption.
Genes for the major albumins and globulins of wheat have been assigned to chromosome groups 3, 4, 5, 6, and 7 (Garcia Olmedo et al., 1982). A major component of the albumins of low molecular weight (14,000–16,000 Da) is encoded by the short arm of chromosome 3D, as suggested by its absence in the water extracts of aneuploid strains nullisomic-3D, tetrasomic-3B, and ditelosomic-3DL of Chinese Spring (Pogna et al., 1991). In amino acid composition, albumins and globulins differ from the gluten proteins in having lower amounts of glutamic acid and more lysine. In fact, due to the lysine, this family of proteins has an amino acid composition that fits the dietary requirements of humans and monogastric animals. Unfortunately, because they are present in the wheat endosperm in minor proportions, their presence it is not enough to overcome the lack of lysine in wheat flour.
1.3.5.2 Gluten proteins
Gluten proteins may amount to about 80% of the total proteins in the caryopsis.
Gluten is classically divided into alcohol-soluble (gliadin) and insoluble (glutenin) fractions, which are further separated by electrophoresis.
The gliadins consist of monomeric proteins, which are separated into α, β, γ, and ω groups by polyacrylamide electrophoresis at low pH (Woychik et al., 1961). The glutenins consist of polymeric proteins stabilized by inter- and intrachain disulfide bonds.
These bonds need to be reduced before the component subunits can be separated into two groups, high molecular weight (HMW) and low molecular weight (LMW) subunits, with the latter being further divided into B-, C-, and D-type subunits according to size, isoelectric points, and composition (D'Ovidio and Masci, 2004).
It was long considered that the gliadin and glutenin fractions comprised different types of proteins that corresponded to the prolamins and glutelins, respectively, as defined by Osborne. However, a range of biochemical and molecular studies carried out over the past two decades have demonstrated that this is not the case and we now know that all gluten proteins are structurally and evolutionarily related and they can all be defined as “prolamins” (for the high content of the amino acids proline and glutamine) in that they are soluble in alcohol–water mixtures either as protein monomers (gliadins) or as reduced subunits (glutenins). Furthermore, it is possible to define three groups of prolamins, which contain gliadin and/or glutenin proteins. These are: 1) the high molecular weight prolamins, which comprise only the HMW subunits of glutenin polymers; 2) the sulfur-poor (S-poor) prolamins, which comprise ω-gliadins and D-type LMW subunits of glutenin polymers, and 3) the S-rich prolamins, which comprise α and β-type gliadins, γ-type gliadins, and the B- and C-type LMW subunits of glutenin polymers. Furthermore, the C and D groups of LMW subunits are highly similar in sequence to individual α-type/γ-type and ω-gliadins, respectively, and are considered to be derived from these components by mutations resulting in the presence of additional cysteine residues, which are able to form interchain disulfide bonds. In contrast, the B-type LMW subunits form a discrete group and no closely related gliadin components have been identified (D'Ovidio and Masci, 2004).
The main distinction between the gliadin and glutenin proteins is that the former are monomeric and the latter polymeric. Nevertheless, this classification has been retained by cereal chemists mainly because it has functional significance, with the glutenins being primarily responsible for the elasticity (strength) of the gluten and the gliadins for viscosity.
1.3.5.2.1 Gliadins
Gliadins are heterogeneous mixtures of single-chained polypeptides which are, in their native state, soluble in 70% aqueous alcohol. In accordance with their mobility in A-PAGE (acid-PAGE), they are divided into four groups: α- (fastest mobility), β-, γ-, and ω-gliadins (slowest mobility) (Woychik et al., 1961).
However, according to the amino acid analyses and N-terminal sequences, Kasarda et al. (1983) suggested that the gliadins can be arranged into three major groups of α/β-, γ-, and ω-gliadins.
The molecular weight range is ≈30,000 to 75,000 Da. Using one-dimensional electrophoresis, gliadins of a single wheat grain can be separated into 20–25 components (Bushuk and Zillman 1978; Autran et al 1979; Wrigley et al 1982; Metakovsky et al 1984). Two-dimensional electrophoresis allows better separation with a resolution of up to 50 components (Wrigley 1970;
polymorphism, these proteins have been widely used for cultivar identification in hexaploid and tetraploid wheats.
The γ-gliadins differ from α- and β-gliadins in the amount of aspartic acid, proline, methionine, tyrosine, phenilalanine, and tryptophan (Bietz et al 1977). The ω-gliadins differ in amino acid composition from other gliadins and do not have cysteine. The ω-gliadins are characterized by high levels of glutamine (+glutamate) (40–50 mol%), proline (20–30 mol%), and phenylalanine (7– 9 mol%), which represent >80% of the total amino acid residues (Tatham and Shewry 1995). All gliadins are low in the ionic amino acids (histidine, arginine, lysine, and free carboxylic groups of aspartic acid and glutamic acid). Glutamic and aspartic acids exist almost entirely as amides. Also, gliadins can be classified according to their N-terminal amino acid sequence.
Genetics and polymorphism
The first reports on the chromosomal location of gluten protein genes date back to the late 1960s when Boyd and Lee (1967) and Shepherd (1968), using starch gel electrophoresis, analyzed the compensating nullisomic–tetrasomic and ditelosomic series developed by Sears (1954, 1966) in the bread wheat cv. Chinese Spring. These authors reported that gliadin proteins are controlled by genes present on the short arm of the homoeologous group 1 and 6 chromosomes. The poor resolution of the one-dimensional separations and the overlapping of many gliadin components meant that it was possible to assign only a few of them to specific chromosomes.
The development of more refined two-dimensional electrophoretic techniques, in which starch was replaced by polyacrylamide gels, resulted in increases in the resolution and number of components detected, but essentially confirmed the chromosomal assignments of gliadin coding-genes in Chinese Spring as well as in different bread wheat cultivars (Brown et al., 1981b; Payne et al., 1982; Lafiandra et al., 1984). Similar studies of durum wheat (Joppa et al., 1983; Lafiandra et al., 1987) and wild relatives of wheat have confirmed these results (Lafiandra et al., 1993a).
Extensive studies of the inheritance of gliadins in the progeny of specific crosses have indicated that the major gliadin genes occur in tightly linked clusters, termed blocks, with intrablock recombination being rare (Sozinov and Poperelya, 1980). It is now generally accepted that the ω- and γ-gliadins are controlled by clusters of tightly linked genes present at the Gli-1 loci (Gli-A1, Gli-B1, and Gli-D1) on the short arms of the homoeologous group 1 chromosomes, whereas the α- and β-gliadins are controlled by the Gli-2 loci (Gli-A2, Gli-B2, and Gli-D2) present on the short arms of the group 6 chromosomes (Payne, 1987). This spatial separation of gliadin genes on the group 1 and 6 chromosomes has been attributed to an ancient interchromosomal translocation, with the Gli-2 locus originating from the translocation of a γ-type gene from chromosome 1 to chromosome 6, followed by divergence of the coding sequence to give rise to the α-type sequence (Shewry et al., 1984b). The Gli-1 loci have been shown to be present on the distal parts of the group 1 chromosomes, showing independent or loose linkage with their
respective centromeres (Shepherd, 1988). The Gli-2 loci have been studied in less detail, but telocentric mapping showed 35% recombination between the Gli-A2 locus and the centromere (Payne, 1987). The individual Gli-1 and Gli-2 loci exhibit extensive polymorphism, as detected by electrophoretic techniques, with allelic blocks differing in the numbers, proportions, and mobilities of different components. This results in a great diversity of gliadin patterns, providing the basis for distinguishing different wheat cultivars (Metakovsky, 1991).
Amino acid sequences and structure of ω-gliadins
ω-gliadins have a very high level of glutamine and proline with a low level of sulfur amino acids. Their methionine level may be <0.1% and they are totally lacking in cysteine and are not able to produce -S-S- type bonding. Also, they have few basic amino acids and a higher level of phenylalanine in comparison with the other gliadin groups (Kasarda et al 1983; Tatham and Shewry 1995). Nevertheless, their surface hydrophobicity is lower than that of the α- and γ-type gliadins. They are the first peptides to elute from the RP-HPLC column (Popineau and Pineau 1987). They are also the most hydrophilic of the gluten proteins in terms of total amino acid composition with only a few residues with charged side chains (DuPont et al. 2000).
On the basis of the N-terminal sequences, three different types of ω-gliadins have been observed in wheat and in related proteins such as C-hordeins and ω-secalins. These sequences are named ARQ-, KEL-, and SRL-types on the basis of the first three amino acids of their N-terminal sequences (Kasarda et al 1983; Tatham and Shewry 1995). According to previous reports by Kasarda et al (1983) and Tatham and Shewry (1995), the ARQ-type is thought to be the ancestral sequence type. The KEL-type differs from the ARQ-type in its lack of the first eight residues and also with respect to a highly conserved sequence in the first 10 positions. The third type of ω- gliadin N-terminal sequence is the SRL-type, which is characteristic of ω-gliadins encoded by chromosome 1B (Tatham and Shewry 1995; DuPont et al 2000). The primary sequences of C-hordeins (Tatham et al 1989) and ω-gliadins from the 1D chromosome (Hsia and Anderson 2001) are based on an octapeptide repeat motif made almost entirely from glutamine and proline residues in the sequence PQQPFPQQ. It appears likely that this repeat motif is related, from an evolutionary point of view, to the repeats present in the S-rich prolamins. However, ω-gliadins encoded at chromosome 1B are characterized by different internal peptides rich in glutamine such as QQXP, QQQXP, and QQQQXP, where X is F, I, or L in order of predominance (DuPont et al. 2000).
The structural studies of C-hordeins (Tatham et al 1985b; Field et al 1986), which are related to the gliadins, served as a model for understanding the structure of the S-poor prolamins (Tatham and Shewry 1995). The ω-gliadins are homologous to rye ω-secalins and barley C-hordeins (Tatham and Shewry 1995). The DNA sequences of two full-length wheat ω-gliadin genes (ωF20b and ωG3) containing significant 5' and 3' flanking DNA sequence have been completed (Hsia and Anderson, 2001). The general protein structure is consistent in 19 amino acid
repetitive N-terminal region, then a repetitive region encompassing 90–96% of the protein and a C-terminal region with 10–11 amino acid residues (Hsia and Anderson, 2001).
The ω-gliadins do not have a compact structure, and circular dichroism spectra indicate β-turns and only low levels of α-helices and β- sheets (Tatham and Shewry 1985).
Amino acid sequences and structure of α/β- and γ-gliadins
α/β- and γ-gliadins are also characterized by high levels of glutamine and proline, where ≈90% of the glutamic and aspartic acid residues are amidated (Bietz et al 1977; Ewart 1983; Kasarda et al 1983). They are relatively high in leucine and low in basic amino acid.
The α/β- and γ-gliadins are rich in sulfur with six and eight cysteine residues, respectively. As a result, three and four intramolecular disulfide bonds are formed (Kasarda et al 1984; Köhler et al 1993; Müller and Wieser 1995, 1997).
On the basis of N-terminal sequences, the α/β-gliadins are represented by a very small sequence of five amino acid residues (VRVPV) (Bietz et al 1977). Peptide motifs based on the pentapeptides PQQQP and PQQPY are always present in a repetitive region that follows the N-terminal region of the α/β-gliadin proteins (Shewry et al 1986). The N-N-terminal region of the γ-gliadins is formed by 12 amino acid residues (NMQVDPSGQVQW) that precedes a series of repeats based on the consensus motif PQQPFPQ (Autran et al 1979; Kasarda et al 1983; Shewry and Tatham 1990).
The complete amino acid sequence from a number of α/β-gliadins (Kasarda et al. 1984) and γ-gliadins (Sugiyama et al 1986; Rafalski 1986) comes from the analysis of cDNA and genomic DNA sequences. The sequences show that the primary structure of these proteins is divided into several domains of variable size, a trait common to all prolamins. The N-terminal is a short domain with 5–14 amino acid residues. The central repetitive domain has up to 100 residues organized as repeat sequences of one or two motifs composed of glutamine, proline, and hydrophobic amino acids (phenylalanine or tyrosine). Finally, in the C-terminus non-repetitive domain, there is a succession of segments of polyglutamine and unique sequences particularly rich in lysine and arginine that contain all the sulfur amino acids (Thompson et al 1994; Müller and Wieser 1997). In their structure, α-gliadins have six cysteine residues, while γ-gliadins have eight.
They form three and four disulfide bonds, respectively. There are no free cysteines, and all S-S linkages are intramolecular, preventing gliadins from participating in the polymeric structure of glutenin. In γ-gliadins, the repetitive domain is rich in β-reverse turns and may form an extended structure. The non-repetitive domain is rich in α-helices (Tatham et al 1990b). This feature is also present in α-gliadins, but the β-turns have an irregular distribution when compared with γ-type gliadins (Tatham et al 1987, 1990c).
Relationship of gliadins to wheat quality
Sozinov and Poperelya (1980, 1982) analyzed progeny from many different crosses to demonstrate that allelic variation at the Gli-1 and Gli-2 loci was associated with variation in breadmaking properties, and also established a ranking order of the different blocks of gliadin components. The contributions of different gliadin components to variation in breadmaking performance has also been reported by others, including Pogna et al. (1982), Wrigley et al. (1982), Branlard and Dardevet (1985a), and Metakovsky et al. (1997b,c), with allelic variation present at the Gli-1 loci being more effective in influencing breadmaking properties compared with the Gli-2 loci. In most of these studies correlations between gluten components and breadmaking properties of flour have been assessed by the SDS sedimentation test, an indirect test in which good breadmaking performance is associated with the formation of a large sediment when the flour is suspended in water containing SDS and lactic acid.
Studies by Moonen et al. (1982) and Payne et al. (1987b) have demonstrated that large sedimentation volumes result from the formation of an extensive gel, comprised exclusively of the larger and more insoluble glutenin polymers, leading to the conclusion, supported by genetic studies (Pogna et al., 1988, 1990), that the superior quality associated with gliadins present at the Gli-1 loci is the result of linkage with genes encoding LMW subunits at the Glu-3 loci. Similarly, reports that differences in dough strength were correlated with the presence of certain Gli-2 alleles (Metakovsky et al., 1997b; Branlard et al., 2001) could be related to the association with C-type LMW glutenin subunits, which have been reported to be closely linked to gliadin components encoded by genes on the group 6 chromosomes (Masci et al., 2002).
Gli-D1
Glu-D1
Gli-A1
Glu-A3
Glu-A1
Gli-B1
Glu-B3
Glu-B1
Glu-D3
Gli-A2
Gli-B2
Gli-D2
1A 1B
1D
6A 6B
6D
Tetraploid wheat
Hexaploid wheat
Fig. 1.5: Schematic representation of the chromosomal locations for the genes encoding the gluten proteins of tetraploid and hexaploid wheats.
Fig. 1.6: Schematic illustration of α/β-, γ-, and ω-gliadins. Black bars with letter s indicate the approximate position of cysteine residues, that are all involved in intramolecular disulphide bonds.
1.3.5.2.2 Glutenins (glutenin polymers)
Based on gel filtration (Huebner and Wall 1976; Bietz and Simpson 1992) and flow field-flow fractionation (FFF) studies (Wahlund et al 1996; Stevenson and Preston 1996), the molecular weight of glutenin polymers reach over twenty millions daltons. They are the largest protein molecules in nature (Wrigley 1996).
These proteins are heterogeneous mixtures of polymers formed by disulfide-bonded linkages of polypeptides that can be classified in four groups according to their electrophoretic mobility in SDS-PAGE after reduction of disulfide bonds (the A-, B-, C- and D-regions of electrophoretic mobility). The A-group (with an apparent molecular weight range of 80,000–120,000 Da) corresponds to the HMW-GS (Payne and Corfield, 1979). The B-group (42,000–51,000 Da) and C group (30,000–40,000 Da) are LMW-GS distantly related to γ- and α-gliadins (Payne and Corfield 1979; Payne et al 1985; Thompson et al 1994). Finally, the D-group, also belonging to the LMW-GS group, is highly acidic and related to ω-gliadins (Jackson et al 1983; Masci et al 1993).
N
Repeated domain
Repeated domain
N Repeated domain
C
N
C
γ-gliadin α/β-gliadin ω-gliadinC
s
s s
s
s s
s s s s
s s
s s
1.3.5.2.2.1 HMW-GS (High Molecular Weight – Glutenin Subunits)
The HMW-GS are minor components in terms of quantity, but they are key factors in the process of breadmaking because they are major determinants of gluten elasticity (Tatham et al 1985a) to the extent that they appear to promote the formation of larger glutenin polymers.
The apparent molecular weights of HMW-GS estimated by SDS-PAGE are ≈80,000–130,000 Da. However, true estimates calculated from derived amino acid sequences indicate lower molecular weights (60,000–90,000 Da) (Anderson et al 1988, 1989; Anderson and Green 1989).
Genetics and polymorphism
Orth and Bushuk (1974) and Bietz et al. (1975), using the Chinese Spring aneuploids line, located the HMW subunit genes on the long arms of the homoeologous group 1 chromosome. Subsequently, the study of different sets of intervarietal chromosome substitution lines, using discontinuous SDS–PAGE systems, allowed the results obtained in Chinese Spring to be extended to other bread wheat cultivars (Lawrence and Shepherd, 1980; Payne et al., 1980; Galili and Feldman, 1985). These results provided the evidence that in bread wheat the HMW subunits are encoded by genes at complex loci, designated Glu-1, present on the long arm of the homoeologous group 1 chromosomes (Glu-A1, Glu-B1, Glu-D1). Each locus contains two tightly linked genes (Harberd et al., 1986) encoding subunits designated as x- and y-type based on their molecular weights and biochemical characteristics (Payne et al., 1981a). The x-type subunits generally have a slower electrophoretic mobility in SDS-PAGE and higher molecular weight than the y-type subunits.
However, because of the silencing of some genes, only three to five HMW subunit genes are expressed in different bread wheat cultivars. In particular, two subunits are always expressed by the Glu-D1 locus, two or one by the Glu-B1 locus and one or none by the Glu-A1 locus. When only one subunit is expressed by the Glu-B1 or Glu-A1 loci, this is always the x-type subunit. A similar situation occurs at the Glu-A1 and Glu-B1 loci in durum wheat. However, the y-type gene present at the Glu-A1 locus may be expressed in cultivated and wild diploid wheats (T. monococcum subsp. monococcum, subsp. boeoticum, and T. urartu), in the wild tetraploid wheat T. turgidum subsp. dicoccoides (Waines and Payne, 1987; Levy et al., 1988), and also in cultivated and wild forms oftetraploid wheats with the genomic formula AAGG (T. timopheevii subsp.timopheevii and subsp. araraticum) (Margiotta et al., 1998).
Allelic variation has also been reported in the subunits encoded by each Glu-1 locus in bread wheat cultivars (Lawrence and Shepherd, 1980).
Payne and Lawrence (1983) developeda numbering system to identify different HMW-GS which also provides a chromosomal location of the genes and is the system in current use. Originally, the assignment of ascending numbers was related to the mobility in SDS-PAGE, lower numbers equating to lower mobility. As new subunits have been identified, there has been difficulty in following this logical order. Thus, there are some subunits, such as 20, with lower mobility and
higher number than the original subunits. When identifying subunits numerically, it is customary to include both the genome from which the subunit is derived and the indication of whether it is an x-type or y-type subunit (e.g., Dx5, By9).
Fig. 1.7: SDS-PAGE of allelic HMW-GS present at the three Glu-1 loci. Taken from Shewry et al. (2003).
Analyses of large collections of bread wheat landraces have identified rare alleles at the different Glu-1 loci. Payne et al. (1983) and Lafiandra et al. (1997) have described the identification of subunits with high molecular weights encoded by the Glu-D1 and Glu-A1 loci. Null forms lacking x- and/or y-type subunits have also been detected (Bietz et al., 1975; Payne et al. 1984a; Lafiandra et al., 1988). Combination of the different null Glu-1 alleles has resulted in the production of genotypes with unusual HMW subunit
Compositions. For example, Lawrence et al. (1988) have developed a set of bread wheat lines in which the number of subunits increased progressively from zero to five while Lafiandra et al. (2000b) have produced wheat lines with single x- or y-type subunits. This material has proved useful in determining the relative effects of individual HMW subunits on flour breadmaking properties and provided the possibility of developing wheats suitable for different end uses (Lawrence et al., 1988; Payne and Seekings, 1996; Lafiandra et al., 2000a).
Although the genes encoding x- and y-type subunits are tightly linked, rare cases of recombination have been reported to occur (Payne, 1987; Singh and Shepherd, 1988b). The Glu-1 loci have been mapped relative to the centromeres by telocentric and translocation mapping, with the latter giving larger map distances (28–34 cM) than the former (7.6–10.1 cM). The identification of two chromosome mutants lacking about half of the long arms of chromosome 1B and 1D and also lacking the corresponding Glu-B1- and Glu-D1-encoded HMW subunits led Payne (1987) to conclude that the Glu-1 loci are physically located on the distal halves of the chromosome arms. This was subsequently confirmed by Curtis and Lukaszewski (1991), who used C-banding patterns to study the distribution of recombination along chromosome 1B.
Amino acid sequences and structures of the HMW-GS
The availability of cloned cDNA and genomic sequences coding for HMW-GS (Forde J. et al 1985; Halford et al 1987, 1992; Anderson et al 1988, 1989, 1991; Anderson and Green 1989;
deduced, providing a basis for gene structural analysis, biochemical modelling and biophysical studies. Such molecular and biophysical studies give us today a detailed picture of the HMW-GS structure (Shewry et al 1989, 1992, 1997).
HMW-GS have high content of glutamic acid (mostly as the amidated form glutamine), proline, glycine and low contents of lysine. Structural features include a central repetitive domain (composed of short amino acid motifs that constitute ≤85% of the protein sequence), and two non-repetitive terminal domains that contain the majority of the cysteine residues. These domains presumably form the molecular basis of the role of the HMW-GS in gluten functionality.
Fig. 1.8: Structure of the x- and y-type HMW-GS. Black bars with letter s represent cysteine residues which may be involved in either an inter- or intramolecular disulphide bond. (s) indicates the cysteine residues not found in some x- and y-type HMW-GS.
The N-terminal region has a non-repetitive, conservative sequence of 81-140 residues with three to five cysteine residues. Cysteine residues provide intermolecular disulfide bonds between HMW-GS and LMW-GS to form protein polymers with a range of different sizes that could reach up to tens of millions of daltons (Shewry et al 1992; MacRitchie 1992; Wrigley 1996). In the first 16 amino acids residues, it is possible to distinguish only small differences such as the sixth residue that could be E (glutamic acid) in Dx-type glutenin subunits or R (arginine) in Dy-type subunits (EGEAS-QLQCERELQE). At position 10 in all HMW-GS, there is a C residue (cysteine). Some differences have been observed for the By7 subunit at positions 12 and 14 (Shewry et al 1984; Anderson et al 1991). The C-terminus is a non repetitive domain consisting of 42 residues that include one residue of cysteine.
The amino acid composition of HMW-GS has indicated the hydrophilic nature of the central repetitive domain and the hydrophobic characteristics of the N- and C-terminal domains (Shewry et al 1989). The proportion of the different amino acids is mainly defined by sequences of repeated polypeptide motifs. The sequences PGQGQQ, GYYPTSPQQ form >90% of the
s
s
N
Repeated domain
C
s (s) s
s s
N
Repeated domain
C
s s s
(s) s
x-type HMW-GS y-type HMW-GSrepetitive domain (Anderson and Greene 1989; Shewry et al 1992, 1997). The repetitive domains of x-type also have a tri-peptide motif (GQQ). The central domains of y-type HMW-GS often have the second proline in the GYYPTSPQQ repeat motif replaced by a leucine. Both x- and y-type repetitive domains are predicted to adopt a β-turn conformation (Tatham et al 1990a). Miles et al. (1991) suggested that the β-turns may be organized in a β-spiral structure, ranging from 490 to 700 residues, rich in glutamine, proline, glycine and poor in sulphur (0 or 1 cysteine). Miles et al. (1991) and Shewry et al. (1992, 1997) also proposed an α-helical arrangement of the amino acids for both N- and C-terminal regions. Belton et al. (1994, 1999) noted that the high level of glutamine residues in the central repetitive domain has a very high capacity to form both intra- and intermolecular hydrogen bonds and this feature could therefore be involved in elasticity through formation of intermolecular hydrogen bonds. In the dough, some of these bonds break on stretching, giving rise to unbonded mobile regions (loops) and bonded regions (trains). Thus, the loops can be stretched and then reform when the stress is removed, which accounts for the elastic restoring force of the dough, as in rubber elasticity.
It has been proposed that the length variation observed for the HMW-GS encoded at the Glu-1 locus is mainly due to variations in the length of the central repetitive domain (Halford et al 1987; Anderson et al 1988, 1989; Shewry et al 1989, 1992; D’Ovidio et al 1994, 1995b). This hypothesis has been confirmed by PCR analyses using primers specific for the N-terminal, C-terminal, and repetitive regions of HMW-GS genes at the Glu-D1 locus in hexaploid wheats (D’Ovidio et al 1995b). Other authors (Payne et al 1983; Shewry et al 1989; D’Ovidio et al 1996) point out that the most likely mechanism giving rise to variation in size of glutenin subunit is an unequal crossing-over event. This is a relatively common process among genes belonging to multigene families in eukaryotes (Baltimore, 1981). Unequal crossing-over could also produce very long genes (as a result of insertion of several blocks of repetitive motifs) according to D’Ovidio et al. (1996) or very short ones (as a result of deletion of several blocks) such as subunit 12.4t present in T. tauschii (Gianibelli et al 1996a).
Relationship of HMW-GS to wheat quality
The establishment of allelic variation in HMW glutenin subunits as a major contributor to genetic variation in breadmaking quality was pioneered by Payne and co-workers with a series of studies starting at the end of the 1970s (Payne et al., 1979).
Based on the analyses of a large numbers of cultivars, Payne et al. (1987a) also developed a scoring system for the HMW-GS in which individual subunits are graded with numbers based on quality evaluations. A given cultivar can then be assigned a Glu-1 score, which is the sum of the contributions of each of the three HMW-GS loci. The HMW-GS score has been shown to have more influence in some sets of wheats than in others (MacRitchie et al 1990). This is likely to be due to the complex interaction of factors that define wheat quality. These factors, in which HMW-GS have a major role, also include LMW-GS, gliadins, and abiotic stresses. One aspect that is sometimes overlooked when using the scoring system is that subunits with the same
protein sequences and surface hydrophobicity. For example, after the Glu-1 score was established, Sutton (1991) found differences in retention time for subunit 8 in some cultivars when subjected to RP-HPLC. He concluded that two different subunit 8 were involved (8 and 8*). Also, different electrophoretic mobilities were reported for subunit 7 (7 and 7*). Thus, four different alleles, instead of just one, are expected for this pair (7+8; 7*+8; 7+8*; 7*+8*) (Marchylo et al 1992b). Interestingly, there are contrasting effects on quality within these pairs and, hence, the score originally given to the pair 7+8 is sometimes misleading. Nevertheless, reference to HMW-GS composition has proved valuable in the segregation of lines in the process of breeding for specific quality targets (Cornish 1995; Cornish et al 1999).
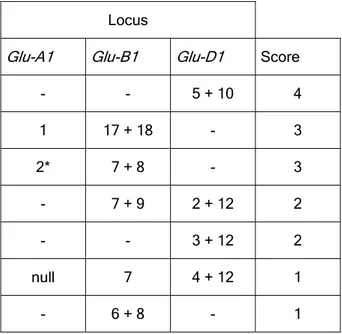
Tab. 1.4: Quality scores assigned to individual HMW glutenin subunits or subunits pairs (from Payne et al., 1987a).
Several HMW-GS alleles have been closely associated with breadmaking quality. The studies of Payne et al. (1981b) mainly involved the analysis of the random progeny from various crosses between lines with different HMW subunits composition and contrasting breadmaking properties. He showed that allelic variation in subunits affected breadmaking properties as measured by the SDS sedimentation test. For example, the allelic pairs of HMW subunits 1Dx5 + 1Dy10 and 1Dx2 + 1Dy12 encoded by the Glu-D1 locus were correlated with good and poor breadmaking properties, respectively. We now know that the observed differences in breadmaking properties (i.e., dough strength) were due to differences in molecular size of glutenin polymers (Gupta and MacRitchie, 1994). When comparing the allelic pair of HMW subunits 1Dx5 + 1Dy10 Vs. 1Dx2 + 1Dy12, Anderson and Green (1989) and Kasarda (1999) both consider the presence of an extra cysteine residue in Dx5 as the determinant of the allelic differences observed. Similarly, Payne et al. (1981b) also showed differential effects of allelic subunits encoded by the Glu-B1 and Glu-A1 loci.
Locus
Glu-A1 Glu-B1 Glu-D1 Score
- - 5 + 10 4 1 17 + 18 - 3 2* 7 + 8 - 3 - 7 + 9 2 + 12 2 - - 3 + 12 2 null 7 4 + 12 1 - 6 + 8 - 1
Analyses of varieties grown in different countries have essentially confirmed the role of allelic difference at the three Glu-1 loci in determining breadmaking properties (MacRitchie et al., 1990). Subsequently, Payne et al. (1987c) used a set of near-isogenic lines developed in the bread wheat cultivar Sicco [HMW subunit composition 1Ax1 (Glu-A1), 1Bx7 + 1By9 (Glu-B1), 1Dx5 + 1Dy10 (Glu-D1)] to show effects associated with the replacement of subunits 1Dx5 + 1Dy10 with the allelic pair 1Dx2 + 1Dy12. SDS sedimentation, farinograph and baking tests clearly showed the superior effects on breadmaking of the former pair compared with the latter. Furthermore, near-isogenic lines of Sicco, in which HMW subunits had been eliminated, demonstrated that the removal of subunits 1Dx5 + 1Dy10 had severe effects on the SDS sedimentation volume and loaf volume. These results were similar to those obtained by Lawrence et al. (1988), who crossed a mutant line of the cultivar Olympic, which is null at the Glu-B1 locus, with a line of the cultivar Gabo, which is null at the Glu-A1 and Glu-D1 loci, to generate a series of lines containing from zero to five subunits.
By the middle of the 1980s, the results of extensive genetic and biochemical studies had clearly demonstrated that differences in number and type of HMW glutenin subunits strongly affected the breadmaking properties through effects on the amount and size distribution of glutenin polymers.
Halford et al. (1992) carried out quantitative analyses of total protein extracts from 22 bread wheat cultivars and demonstrated that the presence of the allelic subunits 1Ax1 or 1Ax2*, when compared with the null allele, resulted in an increase in the proportion of total HMW subunits from about 8 to 10%. This led them to suggest that the increase in breadmaking quality associated with the presence of subunit 1Ax1 or 1Ax2* may result from an increase in the total proportion of HMW glutenin subunits, which can in turn result in a higher amount of large glutenin polymers. Popineau et al. (1994) used the near-isogenic lines developed in the bread wheat cultivar Sicco to show that elimination of HMW subunits associated with the Glu-A1 and Glu-D1 loci strongly reduced the amount of the large size glutenin polymers, as measured by size-exclusion chromatography (SE-HPLC), with a marked decrease in gluten viscoelasticity. The substitution of the pair 1Dx5 + 1Dy10, normally present in Sicco, with the pair 1Dx2 + 1Dy12 also negatively affected the size distribution of glutenin polymers and gluten viscoelasticity. These results were paralleled by studies performed by Gupta and MacRitchie (1994), who used recombinant inbred lines and biotypes differing in allelic composition at the Glu-B1 (1Bx17 + 1By18 vs 1Bx20 + 1By20) or the Glu-D1 locus (1Dx5 + 1Dy10 vs 1Dx2 + 1Dy12) to show that the allelic pairs 1Bx17 + 1By18 and 1Dx5 + 1Dy10 were associated with the production of larger amounts of large-sized glutenin polymers. No quantitative differences were found between the pairs of allelic combinations tested. However, subunit 1Dx5 contains an additional cysteine residue compared with subunit 1Bx2 while subunit 1Bx20 contains two cysteine residues compared with four in subunit 1Bx17. It has been suggested that these differences may be critical in determining the size distribution of glutenin polymers (Lafiandra et al., 1993b, 1999; Gupta and MacRitchie, 1994).
Killermann and Zimmermann, 2000; Lukow, 2000; Cornish et al., 2001). Killermann and Zimmermann (2000) used four doubled haploid populations differing in glutenin subunits associated at the Glu-1 and Glu-3 loci and demonstrated that the effects of the different alleles were strongly dependent on the genetic background of the material. In fact, comparison of the allelic pairs 1Dx5 + 1Dy10 versus 1Dx2 + 1Dy12, and of 1Bx7 + 1By9 versus 1Bx6 + 1By8, consistently showed superior effects of 1Dx5 + 1Dy10 and 1Bx7 + 1By9, whereas comparison of the null allele (the silenced Glu-A1 locus) with subunit 1 at the Glu-A1 locus showed significant positive effects only in one population.
The effect of individual proteins (HMW-GS, LMW-GS, hordeins, gliadins) on dough properties can also be evaluated by studying the mixing behaviour of a base flour, modified either by incorporation or addition of the specific proteins (Bekes et al 1994a,b). Recent advances in microscale mixing and protein engineering systems have proved to be valuable in elucidating structure and functional relationship in gluten proteins (Bekes et al 1998). Chain-extender proteins such as HMW-GS and LMW-GS increased dough strength and stability estimated by mixograph parameters (Sissons et al 1998; Lee et al 1999a). Likewise, chain-extender proteins with longer repetitive domains increased the stability and strength more than proteins with shorter domains (Bekes et al 1998). Polypeptides containing a single cysteine can act as chain terminators during the formation of the glutenin polymers, producing decreases in dough strength and stability (Kasarda, 1989; Buonocore et al. 1998; Tamas et al. 1998; Greenfield et al. 1998; Masci et al. 1999).
1.3.5.2.2.2. LMW-GS (Low Molecular Weight – Glutenin Subunits)
The LMW-GS represent about one-third of the total seed protein and ≈60% of total glutenins (Bietz and Wall 1973). Despite their abundance, LMW-GS have received much less research attention than the HMW-GS. This has been mainly due to the difficulty in identifying them in one dimensional SDS-PAGE gels, since LMW-GS largely overlap with gliadins. However, improved resolution of capillary electrophoresis (Bean and Lookhart, 2000) and recent advances in two-dimensional gel-based mapping approaches (Skylas et al. 2000, Vensel et al. 2005), allowed us to get new insights about the genetic, structural and functional characteristics of these subunits.
LMW-GS can be classified, as proposed by Jackson et al. (1983), in B-, C-, and D-subunits on the basis of molecular weight and isoelectric point. Based on SDS-PAGE estimates, their molecular weight range is 20,000-45,000 Da (D’Ovidio and Masci, 2004). While most of the LMW-GS belong to the B group (“typical” LMW-GS) we now know that the D group is actually composed of modified ω-gliadin components that have acquired a cysteine residue (ω-gliadins lack this amino acid residue). This finding was the first evidence that gliadin-like subunits were present and incorporated in the glutenin polymers (Masci et al., 1993, 1999).
LMW-GS with α- and γ-type gliadin-like N-terminal sequences are the most abundant proteins in the so-called C group, with at least thirty components being detected by two-dimensional analyses (Masci et al., 2002). As for the D subunits, it is probable that they form part of the