An International Journal of
Mineralogy, Crystallography, Geochemistry, Ore Deposits, Petrology, Volcanology
and applied topics on Environment, Archaeometry and Cultural Heritage
PERIODICO di MINERALOGIA
established in 1930
INTRODUCTION
The Rietveld method, known for over 50 years (Rietveld, 1967), was conceived to perform the structural
analysis of poly-crystalline (powder) compounds by neutron diffraction. From the second half of the 1980s, it was also used for quantitative phase analysis (Bish
ABSTRACT
The quantitative phase analysis using the Rietveld method is one of the most used analytical protocols for the characterization of several types of natural and synthetic materials, and it can be performed both on fully crystalline multiphase systems and on materials containing even an amorphous fraction. Therefore, there are several applications of this method (e.g., to natural raw materials, traditional ceramics, bricks, glass-ceramics, cementitious binders, etc.). More recently, the application of the Rietveld method has disseminated also in the chemical, pharmaceutical, and other high added-value industrial areas, where it is exploited in the operational planning, formulation analysis, and in patent protection. Nowadays, in consequence of this diffusion, several academic and private laboratories provide phase quantitative analysis using the Rietveld method as customers service, but an accreditation procedure is still pending and lacks a protocol for checking the authenticity and quality of the analytical reports.
In this letter, we focus on the principal elements that an analytical report of quantitative phase analysis, based on the Rietveld method, should contain, as well as some best-practice guidelines for sample preparation and data collection procedure.
Keywords: Rietveld; preferred orientations; quantitative phase analysis; x-ray data collection; x-ray sample preparation.
ARTICLE INFO Submitted: April 2019 Accepted: May 2019 Available on line: June 2019
* Corresponding author: daniele.malferrari@unimore.it DOI: 10.2451/2019PM870 How to cite this article: Gualtieri A.F. et al. (2019) Period. Mineral. 88, 147-151
Quantitative phase analysis using the Rietveld method:
towards a procedure for checking the reliability and quality
of the results
Alessandro Francesco Gualtieri 1, Giacomo Diego Gatta 2, Rossella Arletti 3,
Gilberto Artioli 4, Paolo Ballirano 5, Giuseppe Cruciani 6, Antonietta Guagliardi 7,
Daniele Malferrari 1,*, Norberto Masciocchi 8, Paolo Scardi 9
1 Department of Chemical and Geological Sciences, University of Modena and Reggio Emilia, Via
G. Campi 103, 41125 Modena, Italy
2 Department of Earth Sciences, University of Milano, Via Botticelli 23, 20133 Milano, Italy 3 Department of Earth Sciences, University of Torino, Via Valperga Caluso, 35, 10125 Torino, Italy 4 Department of Geosciences and CIRCe Centre, University of Padova, Via Gradenigo 6, 35131
Padova, Italy
5 Department of Earth Sciences, Sapienza University of Roma, P.le Aldo Moro 5, 00185 Roma, Italy 6 Department of Physics and Earth Sciences, University of Ferrara, Via Saragat 1, 44122 Ferrara,
Italy
7 Institute of Crystallography, CNR and To.Sca.Lab., at University of Insubria, Via Valleggio 11,
22100 Como, Italy
8 Department of Sciences and High technology and To.Sca.Lab., University of Insubria, Via
Valleggio, 11, 22100 Como, Italy
9 Department of Civil, Environmental and Mechanical Engineering, University of Trento, via
and Howard, 1988) and later also for microstructural investigation (e.g., Dutta et al., 2003) by X-ray diffraction. Quantitative phase analysis using the Rietveld method (Hill and Howard, 1987; Bish and Post, 1993; Young, 1995; Gualtieri, 2000; Altomare et al., 2017) has now become an important procedure for the characterization of both natural and synthetic materials.
The quantitative phase analysis can be performed both on fully crystalline multiphase material as well as when an additional amorphous phase is present. A large number of examples of the application of this method, in several fields, are available in the open literature, but an exhaustive discussion of them goes beyond the scope of this communication. However, the selection hereafter reported could be considered as well representative for the different fields (and may represent a starting point for those who wish to deepen their knowledge on the use of the method): clays (Ufer et al., 2008), cultural heritage (Siano et al., 2002; Ballirano and Maras, 2006), advanced ceramic materials (Leoni et al., 1998), traditional ceramic materials and glass-ceramic (Lutterotti et al., 1998; Gualtieri et al., 2014), cementitious binders (De la Torre et al., 2001; De la Torre and Aranda, 2003; Gualtieri et al., 2006; Valentini et al., 2011), photocatalytic materials (Tobaldi et al., 2014), metals (Zhou et al., 2012), pharmaceuticals (Iyengar et al., 2001; Colombo et al., 2014), zeolitic tuffs (Gualtieri, 1996; Snellings et al., 2010).
Nowadays, various academic, industrial, and professional laboratories can offer to customers quantitative phase analysis by the Rietveld method. Although specific guidelines for X-ray powder diffraction measurements, based on the UNI-EN recommendations (e.g., UNI EN 1: 2006; UNI EN 2: 2006; UNI EN 13925-3: 2005), are already existing, no universally accepted validation protocol for the assessment of the quantitative phase analysis quality is currently available.
In this letter, we focus on the principal elements that an analytical report of quantitative phase analysis, based on the Rietveld method, should contain, as well as some best-practice guidelines for sample preparation and data collection procedure. Reliability and quality of the data can be easily ascertained if a defined protocol is followed in any given laboratory.
DESCRIPTION OF THE ANALYTICAL PARAMETERS
A quantitative phase analysis report, based on the Rietveld method, should always specify:
1) If an internal standard has been used. If this is the case, it is necessary to indicate its origin, nature, certification (if any), and the weight fraction (wt%) added to the sample. It is always assumed that both the standard and the sample have been efficiently ground and homogenized, after mild
drying to remove adsorbed water; drying and grinding conditions should be reported.
2) The experimental set-up: i) X-ray (or neutron) diffraction geometry (reflection or transmission); ii) sample holder type; iii) optics (e.g., fixed or variable slits, focusing mirror, monochromator type, and filter on incident or diffracted beam); iv) detector type (e.g., point det., linear or areal).
3) Radiation type and wavelength.
4) Data collection conditions: °2q range, step size, time per step; for a standard data collection with Cu-Kα radiation, it is recommended to collect data at least within the 3-80 °2q range.
5) Sample loading procedure (e.g., top, side or back loading), and whether sample rotation or other methods, aimed to minimize the preferred orientation effects, are used; for transmission geometry with capillary, the diameter of the capillary and its nature (glass, quartz, kapton, etc.) should be given as well.
6) If specific corrections have been applied to the preliminary data before the treatment (e.g., smoothing or
Ka2 stripping).
7) The software used for the Rietveld refinement. 8) The structural models used for the full-profile fit refinement (giving the sources: literature reference, database or phase code) and the list of the refined/not-refined parameters, with special attention to the unit-cell parameters and to the atomic displacement parameters
(Uiso or Biso).
9) If a correction for preferred orientation effects (e.g., March-Dollase function, or spherical harmonics) has been applied.
10) The agreement factors (McCusker et al., 1999). For example: R profile (R-pattern o Rp) R weighted profile (R-weighted-pattern o Rwp) (Goodness of fit) where:
wi=1/yo,i or 1/s2(yo,i); N is the number of observations,
P is the number of parameters; yi(obs) is the observed
𝑹𝑹𝒑𝒑= 𝒊𝒊𝒚𝒚𝒐𝒐,𝒊𝒊𝒚𝒚− 𝒚𝒚𝒄𝒄,𝒊𝒊 𝒐𝒐,𝒊𝒊 𝒊𝒊 𝑹𝑹𝒘𝒘𝒘𝒘= 𝒘𝒘𝒊𝒊 𝒚𝒚𝒐𝒐,𝒊𝒊− 𝒚𝒚𝒄𝒄,𝒊𝒊 𝟐𝟐 𝒊𝒊 𝒘𝒘𝒊𝒊 𝒚𝒚𝒐𝒐,𝒊𝒊 𝟐𝟐 𝒊𝒊 𝝌𝝌𝟐𝟐= 𝑹𝑹𝒘𝒘𝒘𝒘 𝑹𝑹𝒆𝒆𝒆𝒆𝒘𝒘 𝑹𝑹𝒆𝒆𝒆𝒆𝒆𝒆= 𝑤𝑤𝑁𝑁 − 𝑃𝑃 * 𝑦𝑦* obs0 *
intensity at step i; yo,i and yc,i are the i-th point of the
observed and calculated pattern, respectively.
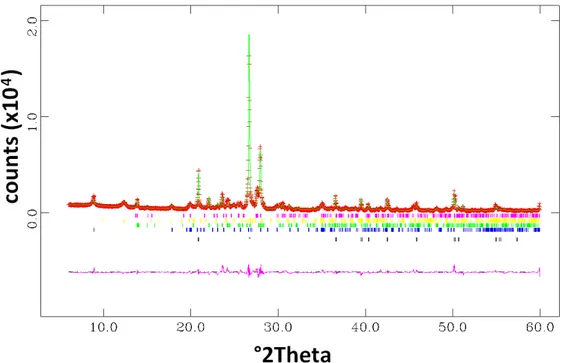
11) The graphical output of the Rietveld full-profile fit should be shown (or a segment which contains, at least, one of the main Bragg peak of each crystalline phase); calculated pattern, calculated background curve (in particular in the presence of an amorphous phase), observed-calculated difference curve, and graphical markers of the peak positions for each crystalline phase should be shown as well.
Figure 1 shows, as an example, the Rietveld full-profile fit obtained using the GSAS suite (Larson and Von Dreele, 1994) and the graphic interface EXPGUI (Toby, 2001) for a natural raw material. More in detail, the diagram shows: i) the observed profile (red crosses), the calculated profile (solid green line), and the differences curve between observed and calculated profiles (solid pink line). Furthermore, Figure 1 shows, using different colors, the graphical markers of the Bragg peak positions of each crystalline phase (from the bottom: quartz, illite, plagioclase, kaolinite and microcline). The plot could also be given in logarithmic scale, to better enhance the low-intensity (or high-angle) signals.
12) A table with the numerical results of the quantitative refinement, with the refined weight fraction of each crystalline phase and its relative standard uncertainty (usually given in brackets after the last significant digit).
As an example, an analytical report of quantitative
phase analysis obtained by the Rietveld method can be
downloaded from http://fibers.unimore.it/?page_id=877
(accessed on April 2019).
It is recommended to check and confirm the absence of significant correlations between the refined parameters, as they could affect the quantitative estimation of the weight fraction per each phase. If systematic correlations are detected, it is recommended to limit the number of variable parameters, and/or imposing physical constraints on those that can be considered as “well-known” or measured against certified analytical standards.
The aforementioned analytical details (# 1-12) can also be integrated with the indication of possible corrections for surface roughness effects (in reflection geometry) or for beam attenuation/absorption (in transmission geometry).
With a modern diffractometer and with an adequate data collection strategy, the signal/noise ratio should be good enough to detect crystalline phases even with concentration of 0.5-1 wt%.
In order to check and improve the accuracy of the quantitative estimation, it would be a good practice to repeat the measurements, possibly preparing the sample in different ways. Frequently, a series of measurements is a simple way to reduce (or even eliminate) issues related to low counting statistics, graininess (Dinnebier and Billinge, 2008), and preferred orientations effects.
Finally, to avoid the fictitious quantification of phases
Figure 1. Example of a graphical output of a Rietveld full-profile fit for quantitative phase analysis of a natural raw material (radiation: Cu-Kα; further details in the text).
trough peaks that merge with the background curve, it is recommended to provide, in the report, the average crystallite size for each phase.
With this contribution, which should not be considered either definitive or mandatory, we would like to open the way towards the formulation of a more general protocol, encompassing also indications for the analysis of others compounds (e.g., molecular-organic materials) that require a different approach such as, for example, corrections for transparency and beam overspill at low angle (Matulis and Taylor, 1992).
REFERENCES
Altomare A., Cuocci C., Gatta G.D., Moliterni A., Rizzi R., 2017. Methods of crystallography: powder X-ray diffraction. EMU Notes in Mineralogy 19, 79-138.
Ballirano P. and Maras A., 2006. Mineralogical characterization of the blue pigment of Michelangelo’s fresco “The Last Judgment”. American Mineralogist 91, 997-1005.
Bish D.L. and Howard S.A., 1988. Quantitative phase analysis using the Rietveld method. Journal of Applied Crystallography 21, 86-91.
Bish D.L. and Post J.E., 1993. Quantitative mineralogical analysis using the Rietveld full-pattern fitting method. American Mineralogist 78, 932-940.
Colombo V., Masciocchi N., Palmisano G., 2014. Crystal chemistry of the antibiotic doripenem. Journal of pharmaceutical sciences 103, 3641-3647.
De La Torre A.G., Bruque S., Aranda M.A.G., 2001. Rietveld quantitative amorphous content analysis. Journal of Applied Crystallography 34, 196-202.
De la Torre A.G. and Aranda M.A.G., 2003. Accuracy in Rietveld quantitative phase analysis of Portland cements. Journal of Applied Crystallography 36, 1169-1176.
Dinnebier R.E. and Billinge S.L., 2008. Powder Diffraction. Theory and Practice. Cambridge, UK, RSC Publishing, 604 pp.
Dutta H., Sahu P., Pradhan S.K., De M., 2003. Microstructure characterization of polymorphic transformed ball-milled anatase TiO2 by Rietveld method. Materials Chemistry and Physics 77, 153-164.
Gualtieri A.F., 1996. Modal analysis of pyroclastic rocks by combined Rietveld and RIR methods. Powder diffraction 11, 97-106.
Gualtieri A.F., 2000. Accuracy of XRPD QPA using the combined Rietveld-RIR method. Journal of Applied Crystallography 33, 267-278.
Gualtieri A.F., Viani A., Montanari C., 2006. Quantitative phase analysis of hydraulic limes using the Rietveld method. Cement and Concrete Research 36, 401-406.
Gualtieri A.F., Riva V., Bresciani A., Maretti S., Tamburini M., Viani A., 2014. Accuracy in quantitative phase analysis of mixtures with large amorphous contents. The case of stoneware
ceramics and bricks. Journal of Applied Crystallography 47, 835-846.
Hill R.J. and Howard C.J., 1987. Quantitative phase analysis from neutron powder diffraction data using the Rietveld method. Journal of Applied Crystallography 20, 467-474. Iyengar S.S., Phadnis N.V., Suryanarayanan R., 2001.
Quantitative analyses of complex pharmaceutical mixtures by the Rietveld method. Powder Diffraction 16, 20-24.
Larson A.C. and Von Dreele R.B., 1994. GSAS, General Structure Analysis System. Report LAUR, 86-748.
Leoni M., Jones R.L., Scardi P., 1998. Phase stability of scandia–yttria-stabilized zirconia TBCs. Surface and coatings technology 108, 107-113.
Lutterotti L., Ceccato R., Dal Maschio R., Pagani E., 1998. Quantitative analysis of silicate glass in ceramic materials by the Rietveld method. Materials Science Forum. Aedermannsdorf, Switzerland: Trans Tech Publications 278-281, 87-92.
Matulis C.E. and Taylor J.C., 1992. Intensity calibration curves for Bragg-Brentano X-ray diffractometers. Powder Diffraction 7, 89-94.
McCusker L.B., Von Dreele R.B., Cox D.E., Louër D., Scardi P., 1999. Rietveld refinement guidelines. Journal of Applied Crystallography 32 , 36-50.
Rietveld H.M., 1967. Line profiles of neutron powder-diffraction peaks for structure refinement. Acta Crystallographica 22, 151-152.
Siano S., Kockelmann W., Bafile U., Celli M., Lozzo M., Miccio M., Moze O., Pini R., Salimbeni M., Zoppi M., 2002. Quantitative multiphase analysis of archaeological bronzes by neutron diffraction. Applied Physics A 74, s1139-s1142. Snellings R., Machiels L., Mertens G., Elsen J., 2010. Rietveld
refinement strategy for quantitative phase analysis of partially amorphous zeolitized tuffaceous rocks. Geologica Belgica 13, 183-196.
Tobaldi D.M., Pullar R.C., Seabra M.P., Labrincha J.A., 2014. Fully quantitative X-ray characterisation of Evonik Aeroxide TiO2 P25®. Materials Letters 122, 345-347.
Toby B.H., 2001. EXPGUI, a graphical user interface for GSAS. Journal of Applied Crystallography 34, 210-213.
Ufer K., Stanjek H., Roth G., Dohrmann R., Kleeberg R., Kaufhold S., 2008. Quantitative phase analysis of bentonites by the Rietveld method. Clays and Clay Minerals 56, 272-282.
UNI EN 13925-1:2006 - Prove non distruttive - Diffrazione a raggi X dai materiali policristallini e amorfi - Parte 1: Principi generali.
UNI EN 13925-2:2006 - Prove non distruttive - Diffrazione a raggi X dai materiali policristallini e amorfi - Parte 2: Procedure.
UNI EN 13925-3:2005 - Prove non distruttive - Diffrazione a raggi X dai materiali policristallini e amorfi - Parte 3: Strumenti.
Valentini L., Dalconi M.C., Parisatto M., Cruciani G., Artioli G., 2011. Towards three-dimensional quantitative reconstruction of cement microstructure by X-ray diffraction microtomography. Journal of Applied Crystallography 44, 272-280.
Young R.A., 1995. The Rietveld Method (1995) International Union of Crystallography Monographs on Crystallography. Oxford University Press.
Zhou Y., Song W., Zeng X., Xie C., 2012. Quantitative X-ray Rietveld analysis of metallic aluminium content in nano-aluminium powders. Materials Letters 67, 177-179.
This work is licensed under a Creative Commons Attribution 4.0 International License CC BY. To view a copy of this license, visit http://creativecommons.org/licenses/ by/4.0/